
Infographic 11 — The Canadian Arctic: Communities inform coastal ecosystems
Long description
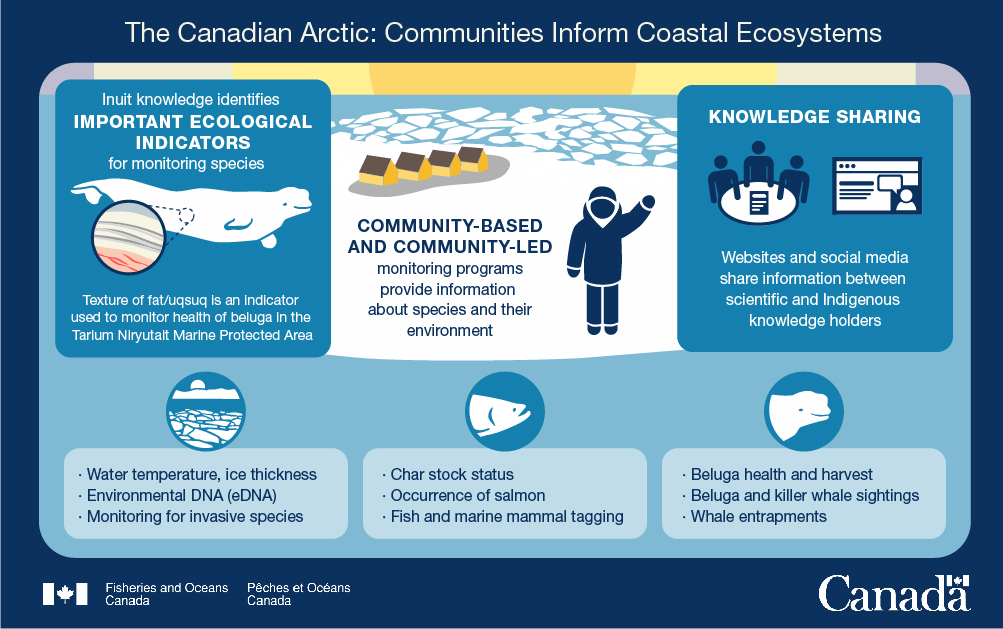
An infographic shows information on how communities inform coastal ecosystems. Two coloured informational boxes are laid out on either side of a simplified coastal Arctic scene. The box at left shows an icon of a beluga whale with a zoomed-in section showing the fat layer under the animal's skin. In the centre of the infographic is a scene with a coastal Arctic community and a human figure waving from the sea ice. The box at right shows an icon of three people sitting at a round table with a report and an icon of a computer screen with a person and a speech bubble. At the bottom of the infographic are three icons and accompanying informational boxes. The icon at left is a simplified Arctic coast and sunset with sea ice. The central icon is a fish head and the far right icon is a beluga head.
- Inuit knowledge identifies important ecological indicators for monitoring species
- Texture of fat/uqsuq is an indicator used to monitor health of beluga in the Tarium Niryutait Marine Protected Area
- Community-based and community-led monitoring programs provide information about species and their environment
- Knowledge Sharing
- Websites and social media share information between scientific and Indigenous knowledge holders
- Water temperature, ice thickness
- Environmental DNA (eDNA)
- Monitoring for invasive species
- Char stock status
- Occurrence of salmon
- Fish and marine mammal tagging
- Beluga health and harvest
- Beluga and killer whale sightings
- Whale entrapments
- Date modified: