
Canada’s Oceans Now: Atlantic Ecosystems, 2022
The information contained in this report reflects data up to the end of 2021 and should be interpreted within the context of the situation at that time. For the most recent science advice, please refer to our publications.
On this page
- Foreword
- A Changed Ocean
- Ocean Environment: Ocean Temperature and Sea Ice
- Ocean Environment: Acidity and Dissolved Oxygen
- Life in the Atlantic: Nutrients and Plankton
- Life in the Atlantic: Kelp and Eelgrass
- Life in the Atlantic: Large Invertebrates
- Life in the Atlantic: Fish
- Life in the Atlantic: Sea turtles
- Life in the Atlantic: Seabirds
- Life in the Atlantic: Marine Mammals
- Human Impact on the Atlantic Ocean
Foreword
Canada's Oceans Now is a report series that summarizes the current status and trends of Canada’s oceans. Each year focuses on the Pacific, Atlantic, or Arctic Ocean, followed by a national synthesis. The series reflects the Government of Canada's commitment to informing Canadians of the current state of the oceans by highlighting and providing examples of the many influences and changes that affect these dynamic ocean systems.
Canada's Oceans Now: Atlantic Ecosystems, 2022 describes the current status and trends in Atlantic Canada's marine ecosystems up to the end of 2021. This report is based on key findings and summaries of the marine ecosystem's physical, chemical, and biological components derived from monitoring and research programs. Supporting information is detailed in the State of the Atlantic Ocean Synthesis Report (Bernier et al. 2023), written by scientists from Fisheries and Oceans Canada with contributions from Environment and Climate Change Canada).
A Changed Ocean
Climate change and other stressors in the Canadian Atlantic have combined with natural variability to create a new reality for species.
Over the last century, climate change and other stressors have combined with natural variability to create a new reality for species living in our waters.
In this report, scientists share their recent observations and findings—focusing on key information from 2018 to 2021 put in the context of long-term trends. Together, ocean monitoring and research help us understand the complex changes and interactions taking place in Atlantic Canada's marine ecosystems, as well as contribute to their conservation and management. This includes information on the status and trends of key environmental components, species, and habitats, and what we know about how changes in one component affect the others.
Reading the report: Bioregions
A bioregion is an area with distinctive environmental conditions and habitats.
Most status and trends information in this report is presented by bioregion. For species with ranges that span bioregions or extend beyond Atlantic Canada, status and trends are discussed at the scales over time and space specific to each species.
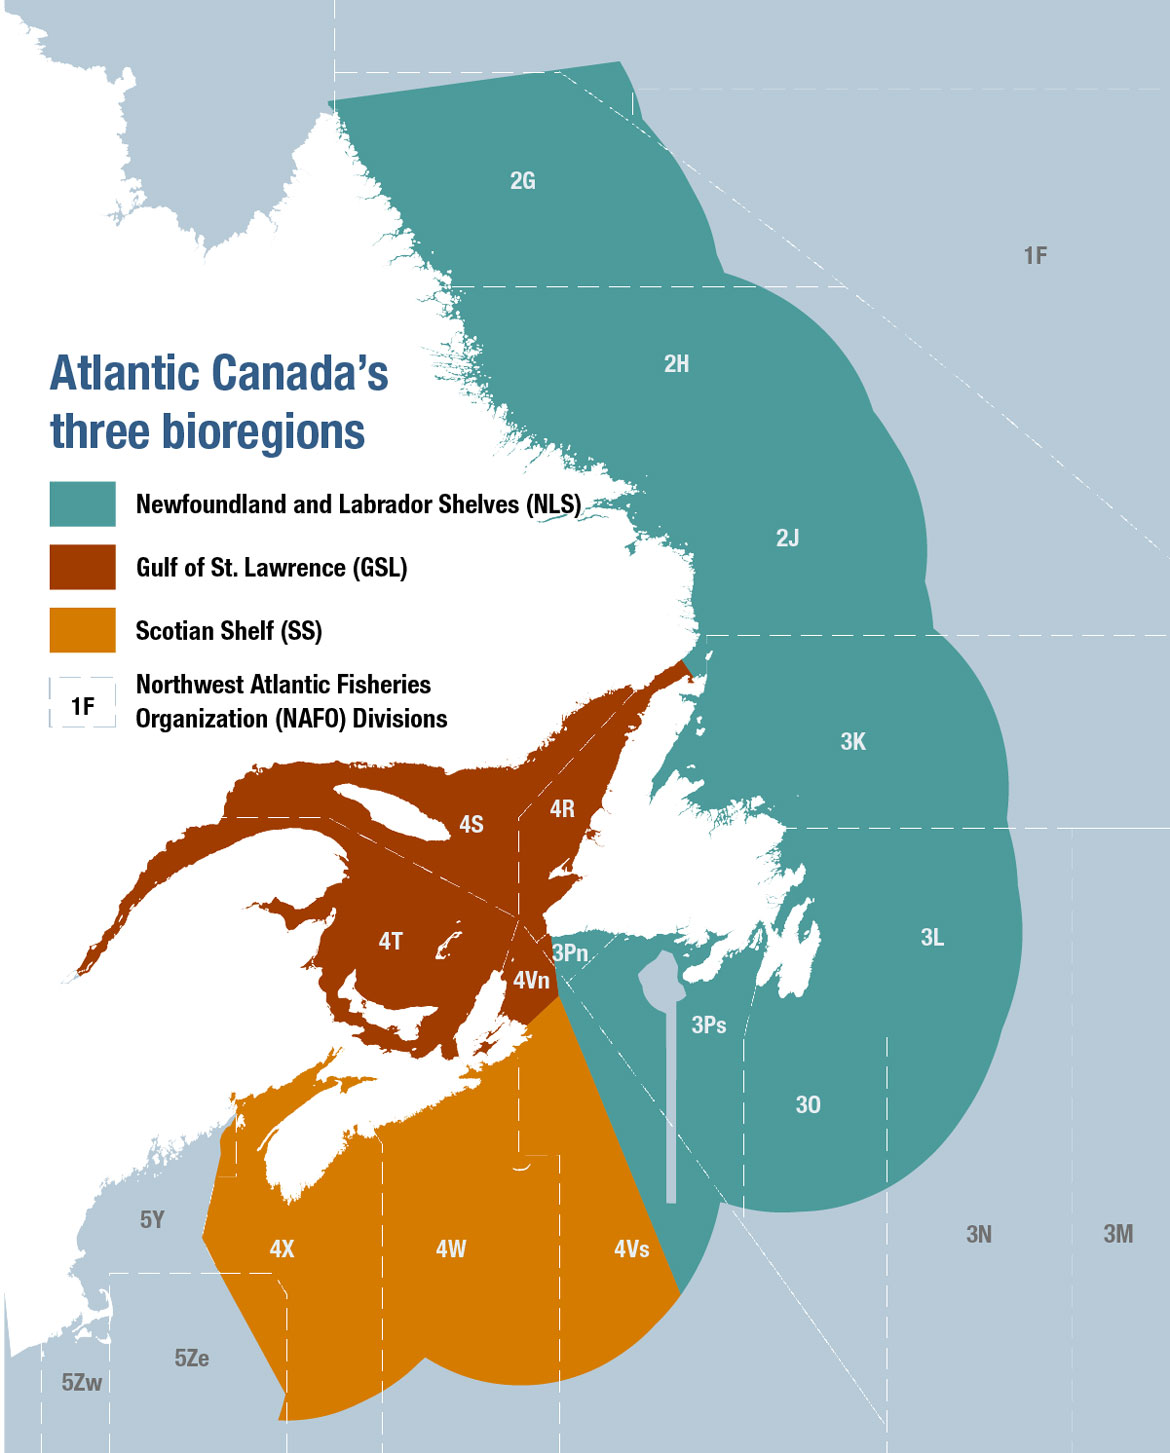
Atlantic Canada's three bioregions: the Gulf of St. Lawrence (GSL), the Scotian Shelf (SS), and the Newfoundland and Labrador Shelves (NLS).
Text version
Atlantic Canada's three bioregions
The Newfoundland and Labrador Shelves overlaps parts of NAFO Subdivisions (from north to south): 2G, 2H, 2J, 3K, 3L, 3N, 3O, 3Ps,3Pn, and 4Vs
The Scotian Shelves overlaps parts of NAFO Subdivisions (from east to west): 5Ze, 4X, 4W, and 4Vs
The Gulf of St. Lawrence includes NAFO Subdivisions: 4S and 4R (northern GSL), and 4T, and part of 4Vn (southern GSL)
Reading the report: Indices and anomalies
Oceanographic measurements, like temperature, sea ice, nutrients, and plankton, are summarized by year for each bioregion using indices that make overall trends easier to visualize and understand. Indices and anomalies are also used to understand long-term oceanographic patterns and trends for large invertebrate and fish species.
An index groups indicators in a way that simplifies data that makes them easier to interpret.
An anomaly is the difference between a value and its longer term average. Values can be 0 (average), negative (below average), or positive (above average) and help to compare new observations with historical trends.
More in-depth information and supporting peer-reviewed evidence are available in the State of the Atlantic Ocean Synthesis Report (Bernier et al. 2023).
Ocean Environment: Ocean Temperature and Sea Ice
Conditions across the Canadian Atlantic have been warmer than average.
| - | Component | Status and/or trend | Bioregion |
|---|---|---|---|
| Warmer conditions | Sea-surface temperature | Variable | GSL, SS, NLS |
| Third warmest on record in 2021 | GSL, SS, NLS | ||
| Cold intermediate layer | Warmer than average | GSL, SS, NLS | |
| Record low volume in 2021 | GSL | ||
| Bottom temperature | Average to above average | GSL, SS, NLS | |
| Record high in 2021 | NLS | ||
| Sea ice | Below average | GSL, SS, NLS | |
| Record low in 2021 | GSL, SS | ||
| - | Relative sea level | Generally rising in south and falling in north | GSL, SS, NLS |
Atlantic Canada's marine waters are a combination of warm water brought in by the Gulf Stream, cold water brought in by the Labrador Current, and freshwater delivered from rivers and melting sea ice. These waters meet and mix at different depths and locations to form new currents and layers from the sea surface to the bottom. These layers are dynamic and change seasonally according to the relative influence of the different waters that supply them. Recently, the Gulf Stream's influence has increased on the Scotian Shelf and in the deep channels in the northern part of the Gulf of St. Lawrence.
Ocean Temperature
Air temperature has been increasing steadily around the world—1°C per century since the 1870s—due to excess carbon dioxide (CO2) in the atmosphere from human activity. Overall, warmer air temperatures have caused warmer sea surface waters, less sea ice cover, and warmer bottom waters in some areas. Although surface water temperatures are highly variable from year to year in the Atlantic bioregions, they have been gradually warming in the long term. Sea-surface temperatures were the third warmest ever recorded in 2021, but were colder than average in 2018 and 2019.
All across Atlantic Canada's continental shelves, water near the seafloor had unusually high temperatures from 2016 to 2021 and all measures of bottom temperature were at or above average. In the Gulf of St. Lawrence and on the Scotian Shelf, higher temperatures were due to the increasing influence of the Gulf Stream. All bottom temperature anomalies were average to above average on the Scotian Shelf and in the northern Gulf of St. Lawrence, and series records were observed in the eastern, central, and western Scotian Shelf, as well as >100-year records in the northern Gulf of St. Lawrence and in the Cabot Strait. Deep water temperatures in the Georges Basin, Emerald Basin, and Cabot Strait have been the highest of the time series since 2016. The Newfoundland and Labrador Shelves also had periods of both average and above-average bottom temperatures, with warmest temperatures occurring in 2021.

Spotlight: A new index to track climate on the Newfoundland and Labrador Shelves
The Newfoundland and Labrador Climate Index (NLCI) shows how environmental conditions on the Newfoundland Shelf have changed over time. Ten different annual measurements were combined to create the NLCI, including air and water temperatures, salinity, sea ice season severity, and iceberg count.
This index highlights several distinct periods of warming and cooling. The 1960s stand out as the warmest decade of the entire period (1950–2020), which was followed by 20 years of gradual cooling. The coldest year on record since 1951 was in 1991, which was followed by a warming trend that has remained since, peaking around 2010.

Index of climate conditions on the Newfoundland Shelf from 1950 to 2020
Text version
| Year | Newfoundland and Labrador Climate Index |
|---|---|
| 1951 | 0.6 |
| 1952 | 0.3 |
| 1953 | 0.5 |
| 1954 | -0.1 |
| 1955 | 0.7 |
| 1956 | 0.1 |
| 1957 | -0.3 |
| 1958 | 0.7 |
| 1959 | -0.2 |
| 1960 | 0.6 |
| 1961 | 0.4 |
| 1962 | 0.5 |
| 1963 | 0.5 |
| 1964 | 0.1 |
| 1965 | 1.0 |
| 1966 | 1.4 |
| 1967 | 0.7 |
| 1968 | 0.9 |
| 1969 | 1.0 |
| 1970 | 1.1 |
| 1971 | 0.4 |
| 1972 | -0.8 |
| 1973 | -0.4 |
| 1974 | -0.4 |
| 1975 | -0.3 |
| 1976 | -0.1 |
| 1977 | 0.2 |
| 1978 | 0.2 |
| 1979 | 0.0 |
| 1980 | 0.6 |
| 1981 | 0.3 |
| 1982 | 0.5 |
| 1983 | -0.1 |
| 1984 | 0.7 |
| 1985 | 0.1 |
| 1986 | -0.3 |
| 1987 | 0.7 |
| 1988 | -0.2 |
| 1989 | 0.6 |
| 1990 | 0.4 |
| 1991 | 0.5 |
| 1992 | 0.5 |
| 1993 | 0.1 |
| 1994 | 1.0 |
| 1995 | 1.4 |
| 1996 | 0.7 |
| 1997 | 0.9 |
| 1998 | 1.0 |
| 1999 | 1.1 |
| 2000 | 0.4 |
| 2001 | -0.8 |
| 2002 | -0.4 |
| 2003 | -0.4 |
| 2004 | -0.3 |
| 2005 | -0.1 |
| 2006 | 0.2 |
| 2007 | 0.2 |
| 2008 | 0.0 |
| 2009 | 0.2 |
| 2010 | 0.5 |
| 2011 | -0.2 |
| 2012 | -0.6 |
| 2013 | -1.1 |
| 2014 | -0.9 |
| 2015 | -0.3 |
| 2016 | -0.3 |
| 2017 | -0.3 |
| 2018 | -0.7 |
| 2019 | -1.2 |
| 2020 | -1.3 |
| 2021 | -1.0 |
Download this dataset from the Federated Research Data Repository: Newfoundland and Labrador climate index
Sea Ice and the Cold Intermediate Layer
Historically, sea ice in the coldest months was present over the entire Gulf of St. Lawrence, the eastern Scotian Shelf and Cabot Strait, and off the eastern coast of Newfoundland and Labrador. Now, ice is extremely rare on the Scotian Shelf. More recently, sea ice indicators—volume, duration, and thickness—across the Gulf of St. Lawrence and the Newfoundland and Labrador Shelves have been lower than average, even reaching record lows in 2021. This reduction of sea ice reduces available habitat for marine life.
Warmer winters are also affecting the seasonal dynamics of the water column. In spring, runoff and melting sea ice add freshwater to the warming surface layer, trapping a cold layer in the middle of the water column. When winters are warmer, this cold intermediate layer (CIL) is weaker in the summer, which can lead to warmer bottom temperatures over time, particularly in shallower areas. Since 2017, the CIL has been weakening across the Atlantic bioregions.
All together these warmer conditions represent a significant change for the species that inhabit these areas, which are generally more adapted to colder temperatures.

Spotlight: Relative sea level rising and falling across Atlantic Canada
Sea level is rising around the globe due to ocean warming and ice melting on land. However, continental-scale geological movement can offset this rise in some areas, causing a local fall in sea level. In Atlantic Canada, much of the land in northern areas is rising in response to the retreat of glaciers since the last Ice Age. This combination of land and water movement causes different effects on sea levels across Atlantic Canada. In some areas, such as Halifax and Saint John, relative sea level is rising, in other areas, such as Harrington Harbour and Nain, relative sea level is falling.
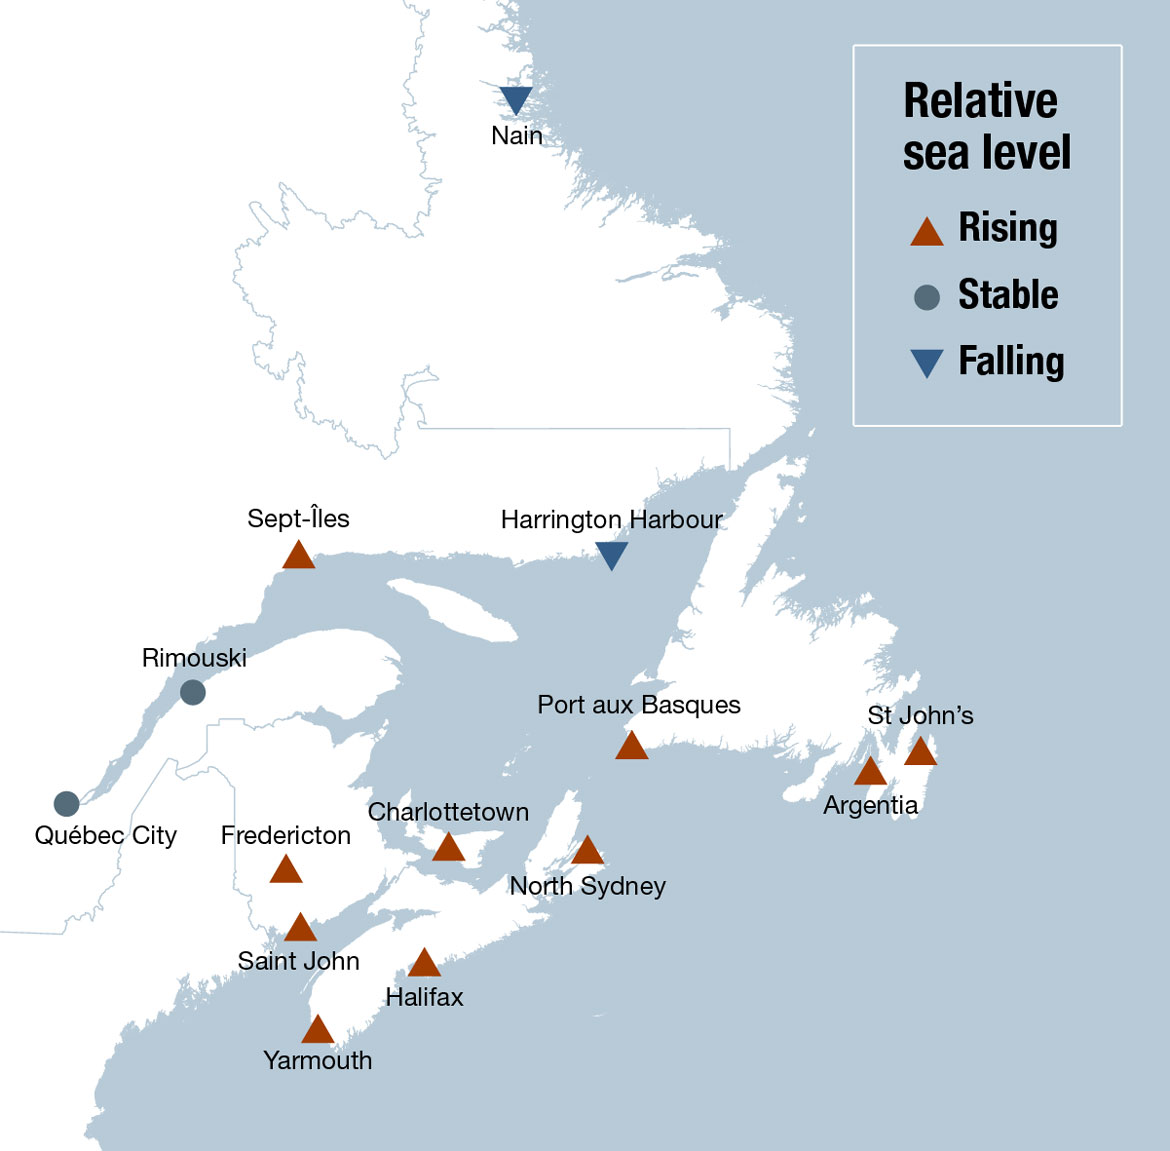
Locations where relative sea level is measured in Atlantic Canada
Text version
Relative sea level
Rising:
- Sept-Îles, QC
- Port aux Basques, NFL
- St John’s, NFL
- Argentia, NFL
- North Sydney, NS
- Charlottetown, PEI
- Halifax, NS
- Yarmouth, NS
- Saint John, NB
- Fredericton, NB
Stable:
- Québec City, QC
- Rimouski, QC
Falling:
- Nain, NFL
- Harrington Harbour, QC
Ocean Environment: Acidity and Dissolved Oxygen
The Canadian Atlantic has become more acidic, especially in the Gulf of St. Lawrence.
| - | Component | Status and/or trend | Bioregion |
|---|---|---|---|
| More acidic waters | pH | Decreasing | GSL, SS, NLS |
| Record low in 2020 | GSL | ||
| Carbonate saturation state (Ω) | Bottom waters undersaturated | GSL | |
| Slightly undersaturated in some areas | SS, NLS | ||
| - | Dissolved oxygen | Hypoxic deep channels | GSL |
| Generally high | SS, NLS |
pH is a measure of acidity—lower pH values are more acidic than higher values.
Carbonate saturation states (Ω) below 1 (undersaturated) indicate that the seawater has the potential to dissolve calcium carbonate shells and skeletons of marine plants and animals. Aragonite and calcite are both forms of calcium carbonate (CaCO3).
Hypoxic conditions occur when oxygen dissolved in seawater is below 30% of its potential saturation.
Ocean warming is not the only consequence of excess carbon dioxide in the atmosphere—the ocean's chemistry has also changed. Increased CO2 in the atmosphere is being absorbed by surface waters leading to higher acidity and lower carbonate ion concentrations (CO32–). These more acidic conditions reduce the ability of corals, molluscs, and crustaceans to build strong shells and skeletons.
In Atlantic Canada, pH has been decreasing faster than the global average. Both pH and carbonate ion concentrations are lower across the Atlantic, more so in the Gulf of St. Lawrence and on the Newfoundland and Labrador Shelves than on the Scotian Shelf. Near the seafloor, waters have also become more acidic, with the lowest values occurring along the deepest part of the Laurentian Channel in the St. Lawrence Estuary. In 2020, undersaturated conditions relative to aragonite reached the eastern Scotian Shelf, the Avalon Channel, the Grand Banks, and the deepest part of the Newfoundland Shelf slope.
The bottom waters of the deep channel of the St. Lawrence Estuary also reached severely low oxygen levels in 2021—an issue that has persisted and worsened since 1984. In combination, warmer temperatures, higher acidity, and lower oxygen in these deep waters increase the physiological stress on numerous marine organisms living in or on the seafloor.
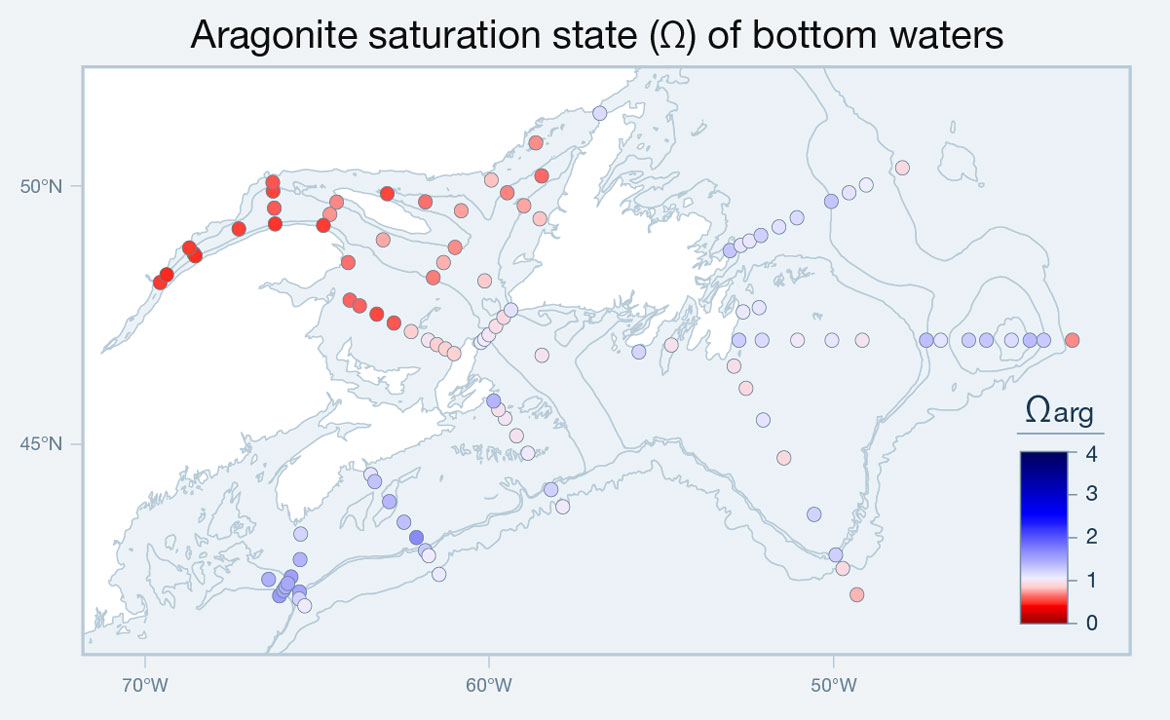
Aragonite saturation state (Ω) across Atlantic Canadian bottom waters in 2020
Text version
The map covers the area of the St. Lawrence Estuary, the Gulf of St. Lawrence, the Scotian Shelf, and the ocean shelf to the east of the island of Newfoundland. Coloured dots represent aragonite saturation state along lines which transect the shelf from land to offshore as well as within the Gulf of St. Lawrence. The colours range on a scale from dark to light reds representing a low aragonite saturation state (0 to 1), through white (value of 1), to light to dark blues representing a high aragonite saturation state (up to 4). On the map, values in the Gulf of St. Lawrence are in light to darker red while those on the Scotian Shelf and off Newfoundland are mostly lighter blues with a few light red. This illustrates that deeper areas of the St Lawrence Estuary and Gulf of St. Lawrence are experiencing lower aragonite saturation state than other areas.
| Latitude °N | Longitude °E | Aragonite Saturation State (Ω) |
|---|---|---|
| 43.2538 | -65.4660 | 1.2 |
| 42.7602 | -65.4833 | 1.4 |
| 42.1335 | -65.4997 | 1.5 |
| 42.0000 | -65.5097 | 1.2 |
| 41.8665 | -65.3493 | 1.0 |
| 42.4233 | -65.7458 | 1.5 |
| 42.0625 | -66.0835 | 1.6 |
| 42.1642 | -65.9685 | 1.5 |
| 42.2330 | -65.9032 | 1.4 |
| 42.2987 | -65.8398 | 1.5 |
| 42.3773 | -66.3987 | 1.4 |
| 44.4033 | -63.4257 | 1.1 |
| 44.2683 | -63.3097 | 1.3 |
| 43.8802 | -62.8823 | 1.4 |
| 43.4828 | -62.4603 | 1.3 |
| 43.1862 | -62.0948 | 1.7 |
| 42.9322 | -61.8377 | 1.3 |
| 42.8365 | -61.7382 | 1.0 |
| 42.4738 | -61.4362 | 1.1 |
| 43.7810 | -57.8350 | 1.0 |
| 44.1138 | -58.1755 | 1.2 |
| 44.8162 | -58.8493 | 1.0 |
| 45.1525 | -59.1825 | 1.0 |
| 45.4908 | -59.5175 | 1.0 |
| 45.6587 | -59.7067 | 1.0 |
| 45.8257 | -59.8462 | 1.4 |
| 46.9580 | -60.2163 | 1.1 |
| 47.0203 | -60.1152 | 1.0 |
| 47.1068 | -59.9892 | 1.0 |
| 47.2687 | -59.7837 | 0.9 |
| 47.4418 | -59.5547 | 0.9 |
| 47.5828 | -59.3417 | 1.1 |
| 46.7085 | -58.4428 | 1.0 |
| 48.6740 | -68.5768 | 0.5 |
| 48.5013 | -64.0823 | 0.7 |
| 48.9388 | -63.0657 | 0.8 |
| 47.7747 | -64.0338 | 0.6 |
| 47.6648 | -63.7508 | 0.6 |
| 47.5030 | -63.2495 | 0.5 |
| 47.3327 | -62.7515 | 0.6 |
| 47.1673 | -62.2503 | 0.9 |
| 47.0003 | -61.7498 | 1.0 |
| 46.9163 | -61.5003 | 0.9 |
| 46.8315 | -61.2518 | 0.9 |
| 46.7412 | -61.0000 | 0.9 |
| 48.1463 | -60.1092 | 0.9 |
| 48.2100 | -61.6065 | 0.7 |
| 48.5013 | -61.3083 | 0.8 |
| 48.7938 | -60.9718 | 0.7 |
| 49.5028 | -60.7925 | 0.8 |
| 50.0968 | -59.9150 | 0.8 |
| 49.8500 | -59.4520 | 0.7 |
| 49.5997 | -58.9643 | 0.8 |
| 49.3468 | -58.5033 | 0.8 |
| 50.1758 | -58.4488 | 0.6 |
| 50.8142 | -58.6187 | 0.7 |
| 51.3858 | -56.7537 | 1.2 |
| 49.6730 | -61.8347 | 0.7 |
| 49.8322 | -62.9465 | 0.5 |
| 49.6690 | -64.4198 | 0.7 |
| 49.4320 | -64.6147 | 0.7 |
| 49.2200 | -64.8047 | 0.5 |
| 49.2473 | -66.2105 | 0.5 |
| 49.5520 | -66.2337 | 0.6 |
| 49.8833 | -66.2698 | 0.5 |
| 50.0490 | -66.2793 | 0.6 |
| 49.1520 | -67.2665 | 0.5 |
| 48.6308 | -68.5327 | 0.5 |
| 48.7833 | -68.7077 | 0.5 |
| 48.1158 | -69.5565 | 0.5 |
| 48.2650 | -69.3668 | 0.5 |
| 46.9067 | -54.6750 | 1.0 |
| 46.7737 | -55.6190 | 1.2 |
| 46.5000 | -52.8500 | 0.9 |
| 46.0700 | -52.5000 | 0.9 |
| 45.4583 | -52.0000 | 1.1 |
| 44.7250 | -51.3950 | 0.9 |
| 43.6333 | -50.5167 | 1.2 |
| 42.8500 | -49.8867 | 1.3 |
| 42.5883 | -49.6833 | 0.9 |
| 42.0817 | -49.2700 | 0.8 |
| 47.0000 | -43.0000 | 0.7 |
| 47.0000 | -43.8333 | 1.3 |
| 47.0000 | -44.2317 | 1.4 |
| 47.0000 | -44.7717 | 1.2 |
| 47.0000 | -45.5000 | 1.3 |
| 47.0000 | -46.0167 | 1.3 |
| 47.0000 | -46.8333 | 1.1 |
| 47.0000 | -47.2500 | 1.3 |
| 47.0000 | -49.1167 | 1.0 |
| 47.0000 | -50.0000 | 1.1 |
| 47.0000 | -51.0000 | 1.0 |
| 47.0000 | -52.0333 | 1.2 |
| 47.5467 | -52.5867 | 1.1 |
| 47.0000 | -52.7050 | 1.3 |
| 48.7333 | -52.9667 | 1.3 |
| 48.8333 | -52.6500 | 1.1 |
| 48.9167 | -52.4000 | 1.1 |
| 49.0250 | -52.0667 | 1.2 |
| 49.1900 | -51.5417 | 1.1 |
| 49.3667 | -51.0167 | 1.2 |
| 49.6833 | -50.0167 | 1.3 |
| 49.8500 | -49.5000 | 1.1 |
| 50.0000 | -49.0000 | 1.1 |
| 50.3317 | -47.9467 | 0.9 |
| 47.6300 | -52.1200 | 1.1 |
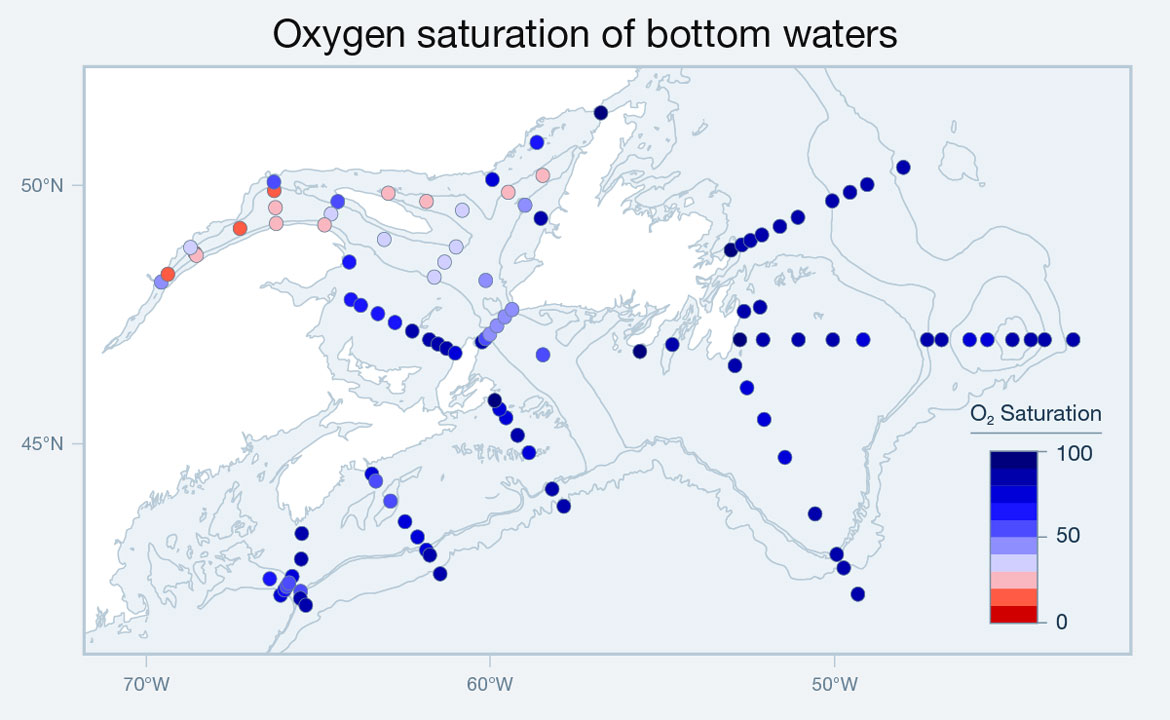
Dissolved oxygen saturation (%) across Atlantic Canadian bottom waters in 2020
Text version
The map covers the area of the St. Lawrence Estuary, the Gulf of St. Lawrence, the Scotian Shelf, and the shelf to the east of the island of Newfoundland. Coloured dots represent the dissolved oxygen in percent along lines which transect the shelf from land to offshore as well as within the Gulf of St. Lawrence. The colours range from dark to light reds representing dissolved oxygen from 0 to 30%, through light to dark blues representing dissolved oxygen from 30 to 100%. Most of the dots along the Scotian Shelf and off Newfoundland are shades of darker blue. Within the Gulf of St. Lawrence there are a few light red dots, and within the St. Lawrence Estuary there are more light to darker red dots indicating that this is an area of lower oxygen levels.
| Latitude °N | Longitude °E | Dissolved Oxygen Saturation (%) |
|---|---|---|
| 43.2538 | -65.4660 | 85 |
| 42.7602 | -65.4833 | 85 |
| 42.1335 | -65.4997 | 52 |
| 42.0000 | -65.5097 | 82 |
| 41.8665 | -65.3493 | 83 |
| 42.4233 | -65.7458 | 70 |
| 42.0625 | -66.0835 | 75 |
| 42.1642 | -65.9685 | 60 |
| 42.2330 | -65.9032 | 60 |
| 42.2987 | -65.8398 | 56 |
| 42.3773 | -66.3987 | 65 |
| 44.4033 | -63.4257 | 79 |
| 44.2683 | -63.3097 | 58 |
| 43.8802 | -62.8823 | 54 |
| 43.4828 | -62.4603 | 74 |
| 43.1862 | -62.0948 | 78 |
| 42.9322 | -61.8377 | 71 |
| 42.8365 | -61.7382 | 84 |
| 42.4738 | -61.4362 | 84 |
| 43.7810 | -57.8350 | 84 |
| 44.1138 | -58.1755 | 82 |
| 44.8162 | -58.8493 | 79 |
| 45.1525 | -59.1825 | 83 |
| 45.4908 | -59.5175 | 78 |
| 45.6587 | -59.7067 | 73 |
| 45.8257 | -59.8462 | 91 |
| 46.9580 | -60.2163 | 83 |
| 47.0203 | -60.1152 | 54 |
| 47.1068 | -59.9892 | 45 |
| 47.2687 | -59.7837 | 45 |
| 47.4418 | -59.5547 | 43 |
| 47.5828 | -59.3417 | 48 |
| 46.7085 | -58.4428 | 56 |
| 48.6740 | -68.5768 | 15 |
| 48.5013 | -64.0823 | 64 |
| 48.9388 | -63.0657 | 36 |
| 47.7747 | -64.0338 | 69 |
| 47.6648 | -63.7508 | 70 |
| 47.5030 | -63.2495 | 65 |
| 47.3327 | -62.7515 | 68 |
| 47.1673 | -62.2503 | 80 |
| 47.0003 | -61.7498 | 83 |
| 46.9163 | -61.5003 | 81 |
| 46.8315 | -61.2518 | 81 |
| 46.7412 | -61.0000 | 78 |
| 48.1463 | -60.1092 | 45 |
| 48.2100 | -61.6065 | 31 |
| 48.5013 | -61.3083 | 39 |
| 48.7938 | -60.9718 | 32 |
| 49.5028 | -60.7925 | 32 |
| 50.0968 | -59.9150 | 78 |
| 49.8500 | -59.4520 | 27 |
| 49.5997 | -58.9643 | 43 |
| 49.3468 | -58.5033 | 82 |
| 50.1758 | -58.4488 | 25 |
| 50.8142 | -58.6187 | 70 |
| 51.3858 | -56.7537 | 96 |
| 49.6730 | -61.8347 | 25 |
| 49.8322 | -62.9465 | 26 |
| 49.6690 | -64.4198 | 57 |
| 49.4320 | -64.6147 | 32 |
| 49.2200 | -64.8047 | 21 |
| 49.2473 | -66.2105 | 28 |
| 49.5520 | -66.2337 | 22 |
| 49.8833 | -66.2698 | 17 |
| 50.0490 | -66.2793 | 55 |
| 49.1520 | -67.2665 | 16 |
| 48.6308 | -68.5327 | 22 |
| 48.7833 | -68.7077 | 31 |
| 48.1158 | -69.5565 | 40 |
| 48.2650 | -69.3668 | 15 |
| 46.9067 | -54.6750 | 85 |
| 46.7737 | -55.6190 | 94 |
| 46.5000 | -52.8500 | 87 |
| 46.0700 | -52.5000 | 78 |
| 45.4583 | -52.0000 | 73 |
| 44.7250 | -51.3950 | 71 |
| 43.6333 | -50.5167 | 86 |
| 42.8500 | -49.8867 | 86 |
| 42.5883 | -49.6833 | 84 |
| 42.0817 | -49.2700 | 84 |
| 47.0000 | -43.0000 | 85 |
| 47.0000 | -43.8333 | 84 |
| 47.0000 | -44.2317 | 82 |
| 47.0000 | -44.7717 | 80 |
| 47.0000 | -45.5000 | 77 |
| 47.0000 | -46.0167 | 78 |
| 47.0000 | -46.8333 | 88 |
| 47.0000 | -47.2500 | 87 |
| 47.0000 | -49.1167 | 77 |
| 47.0000 | -50.0000 | 80 |
| 47.0000 | -51.0000 | 80 |
| 47.0000 | -52.0333 | 85 |
| 47.5467 | -52.5867 | 85 |
| 47.0000 | -52.7050 | 94 |
| 48.7333 | -52.9667 | 95 |
| 48.8333 | -52.6500 | 84 |
| 48.9167 | -52.4000 | 81 |
| 49.0250 | -52.0667 | 80 |
| 49.1900 | -51.5417 | 80 |
| 49.3667 | -51.0167 | 81 |
| 49.6833 | -50.0167 | 89 |
| 49.8500 | -49.5000 | 89 |
| 50.0000 | -49.0000 | 85 |
| 50.3317 | -47.9467 | 86 |
| 47.6300 | -52.1200 | 87 |
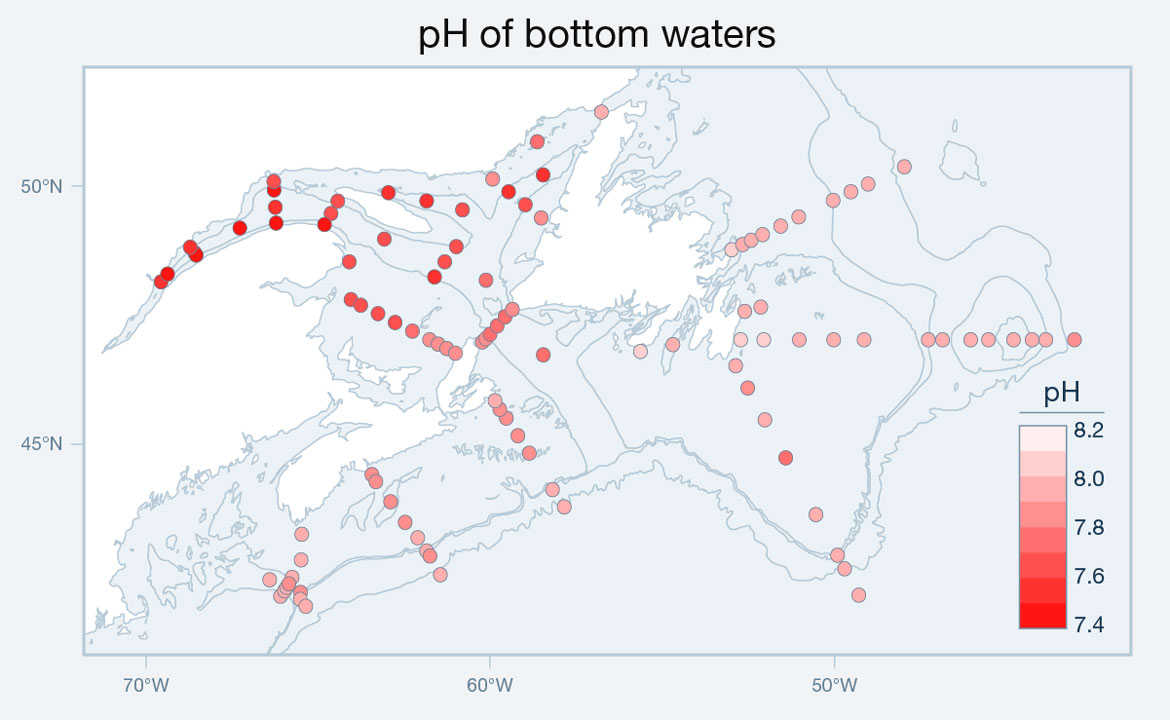
pH across Atlantic Canadian bottom waters in 2020
Text version
| Latitude °N | Longitude °E | pH |
|---|---|---|
| 43.2538 | -65.4660 | 7.92 |
| 42.7602 | -65.4833 | 7.94 |
| 42.1335 | -65.4997 | 7.90 |
| 42.0000 | -65.5097 | 7.97 |
| 41.8665 | -65.3493 | 7.95 |
| 42.4233 | -65.7458 | 7.90 |
| 42.0625 | -66.0835 | 7.93 |
| 42.1642 | -65.9685 | 7.91 |
| 42.2330 | -65.9032 | 7.90 |
| 42.2987 | -65.8398 | 7.90 |
| 42.3773 | -66.3987 | 7.91 |
| 44.4033 | -63.4257 | 7.88 |
| 44.2683 | -63.3097 | 7.85 |
| 43.8802 | -62.8823 | 7.87 |
| 43.4828 | -62.4603 | 7.90 |
| 43.1862 | -62.0948 | 7.96 |
| 42.9322 | -61.8377 | 7.93 |
| 42.8365 | -61.7382 | 7.89 |
| 42.4738 | -61.4362 | 7.97 |
| 43.7810 | -57.8350 | 7.95 |
| 44.1138 | -58.1755 | 7.95 |
| 44.8162 | -58.8493 | 7.89 |
| 45.1525 | -59.1825 | 7.88 |
| 45.4908 | -59.5175 | 7.87 |
| 45.6587 | -59.7067 | 7.85 |
| 45.8257 | -59.8462 | 7.97 |
| 46.9580 | -60.2163 | 7.90 |
| 47.0203 | -60.1152 | 7.80 |
| 47.1068 | -59.9892 | 7.78 |
| 47.2687 | -59.7837 | 7.77 |
| 47.4418 | -59.5547 | 7.75 |
| 47.5828 | -59.3417 | 7.81 |
| 46.7085 | -58.4428 | 7.79 |
| 48.6740 | -68.5768 | 7.46 |
| 48.5013 | -64.0823 | 7.69 |
| 48.9388 | -63.0657 | 7.66 |
| 47.7747 | -64.0338 | 7.70 |
| 47.6648 | -63.7508 | 7.70 |
| 47.5030 | -63.2495 | 7.64 |
| 47.3327 | -62.7515 | 7.67 |
| 47.1673 | -62.2503 | 7.78 |
| 47.0003 | -61.7498 | 7.83 |
| 46.9163 | -61.5003 | 7.81 |
| 46.8315 | -61.2518 | 7.82 |
| 46.7412 | -61.0000 | 7.80 |
| 48.1463 | -60.1092 | 7.71 |
| 48.2100 | -61.6065 | 7.60 |
| 48.5013 | -61.3083 | 7.67 |
| 48.7938 | -60.9718 | 7.62 |
| 49.5028 | -60.7925 | 7.64 |
| 50.0968 | -59.9150 | 7.80 |
| 49.8500 | -59.4520 | 7.60 |
| 49.5997 | -58.9643 | 7.66 |
| 49.3468 | -58.5033 | 7.82 |
| 50.1758 | -58.4488 | 7.57 |
| 50.8142 | -58.6187 | 7.74 |
| 51.3858 | -56.7537 | 7.96 |
| 49.6730 | -61.8347 | 7.58 |
| 49.8322 | -62.9465 | 7.51 |
| 49.6690 | -64.4198 | 7.68 |
| 49.4320 | -64.6147 | 7.63 |
| 49.2200 | -64.8047 | 7.49 |
| 49.2473 | -66.2105 | 7.49 |
| 49.5520 | -66.2337 | 7.55 |
| 49.8833 | -66.2698 | 7.49 |
| 50.0490 | -66.2793 | 7.62 |
| 49.1520 | -67.2665 | 7.49 |
| 48.6308 | -68.5327 | 7.47 |
| 48.7833 | -68.7077 | 7.51 |
| 48.1158 | -69.5565 | 7.53 |
| 48.2650 | -69.3668 | 7.45 |
| 46.9067 | -54.6750 | 7.94 |
| 46.7737 | -55.6190 | 8.01 |
| 46.5000 | -52.8500 | 7.91 |
| 46.0700 | -52.5000 | 7.88 |
| 45.4583 | -52.0000 | 7.92 |
| 44.7250 | -51.3950 | 7.80 |
| 43.6333 | -50.5167 | 7.95 |
| 42.8500 | -49.8867 | 7.96 |
| 42.5883 | -49.6833 | 7.94 |
| 42.0817 | -49.2700 | 7.92 |
| 47.0000 | -43.0000 | 7.89 |
| 47.0000 | -43.8333 | 7.96 |
| 47.0000 | -44.2317 | 7.97 |
| 47.0000 | -44.7717 | 7.90 |
| 47.0000 | -45.5000 | 7.95 |
| 47.0000 | -46.0167 | 7.94 |
| 47.0000 | -46.8333 | 7.94 |
| 47.0000 | -47.2500 | 7.99 |
| 47.0000 | -49.1167 | 7.90 |
| 47.0000 | -50.0000 | 7.95 |
| 47.0000 | -51.0000 | 7.94 |
| 47.0000 | -52.0333 | 8.00 |
| 47.5467 | -52.5867 | 7.97 |
| 47.0000 | -52.7050 | 8.03 |
| 48.7333 | -52.9667 | 8.04 |
| 48.8333 | -52.6500 | 7.96 |
| 48.9167 | -52.4000 | 7.92 |
| 49.0250 | -52.0667 | 7.97 |
| 49.1900 | -51.5417 | 7.92 |
| 49.3667 | -51.0167 | 7.93 |
| 49.6833 | -50.0167 | 7.98 |
| 49.8500 | -49.5000 | 7.96 |
| 50.0000 | -49.0000 | 7.96 |
| 50.3317 | -47.9467 | 7.96 |
| 47.6300 | -52.1200 | 7.98 |
Download the dataset from the Federated Research Data Repository: Ocean carbonate parameters on the Canadian Atlantic Continental Shelf.

Life in the Atlantic: Nutrients and Plankton
Conditions have shifted towards average with higher deep nitrate, phytoplankton, and Calanus copepods.
| - | Component | Status and/or trend | Bioregion |
|---|---|---|---|
| More average conditions | Deep nitrate (50–150 m) | Increased to near average in 2019 and 2020 | GSL, SS, NLS |
| Chlorophyll a | Near or above average | GSL, NLS | |
| Near or below average | SS | ||
| Calanus finmarchicus | Rebounding and near average after 2015 record low | GSL, SS, NLS | |
| Pseudocalanus spp. | Decline to near average after 2015 maximum | GSL, SS, NLS | |
| - | Non-copepods | Gradual decline after 2015 peak | GSL, SS, NLS |
Nitrate (NO3-) is a naturally occurring soluble inorganic form of nitrogen and a key nutrient needed for phytoplankton growth.
Phytoplankton are microscopic algae and bacteria that photosynthesize in surface waters.
Chlorophyll a is the main green pigment found in phytoplankton that facilitates photosynthesis.
Zooplankton are a broad variety of small animals that drift in the water column and consume phytoplankton and other zooplankton.
Biomass is a measure of the amount of a plant or animal based on its mass.
Productivity refers to the amount of biomass generated in an ecosystem in a given period of time.
Nitrate
Global warming of ocean waters has shifted ocean circulation, changing the amount of nutrients that are supplied to Atlantic Canadian waters. Strong wind-driven mixing in the late fall and winter months moves nitrate (NO3-)—an essential nutrient fuelling phytoplankton growth—to the surface where it is available for phytoplankton production when the water column stabilizes and light increases in the spring. In 2017 and 2018, deep nitrate levels were below average in most of the Atlantic bioregions; however, they rebounded to above average in the Gulf of St. Lawrence and on the Newfoundland and Labrador Shelves in 2019 and 2020. These year-to-year changes in deep nitrate levels are linked to variability in ocean circulation across the three bioregions.
Coastally, nitrate is also added to the ocean from land-based and coastal sources, such as agriculture, wastewater, and aquaculture. This type of pollution is generally low across the Atlantic bioregions, except for the St. Lawrence Estuary and some of the other estuaries in the Gulf of St. Lawrence, where a long history of fertilizer use on the surrounding landscape has led to high rates of nitrate loading into the coastal zone.

Index of deep nitrate (50–150 m) from 2000 to 2020
Text version
The y-axis has a scale from approximately -1 to 1, representing below average deep nitrate values (0 and below) and above average (0 and above). The index fluctuates over time with a decrease after 2015. The values increase again in 2019 to 2020. The deep nitrate index is rebounding in some areas.
| Year | Average Index Anomaly |
|---|---|
| 1999 | 0.0 |
| 2000 | 0.5 |
| 2001 | -0.3 |
| 2002 | 0.5 |
| 2003 | 0.4 |
| 2004 | 0.0 |
| 2005 | -0.4 |
| 2006 | 1.0 |
| 2007 | 0.1 |
| 2008 | 0.1 |
| 2009 | 0.3 |
| 2010 | -0.8 |
| 2011 | -0.1 |
| 2012 | 0.4 |
| 2013 | -0.3 |
| 2014 | -0.2 |
| 2015 | 0.8 |
| 2016 | 0.0 |
| 2017 | -0.8 |
| 2018 | -1.1 |
| 2019 | 0.0 |
| 2020 | 0.0 |

Phytoplankton
Phytoplankton form the base of many marine ecosystems and are a key food source for zooplankton and other animals. They increase rapidly, blooming when the combination of temperature, light, and nutrient supply becomes favourable. In the Atlantic, these peaks of abundance occur in the spring and fall, lasting until they are consumed by zooplankton or conditions become unfavourable.
Since 2017, the start of the spring bloom has been near average or later than average across the Atlantic and has lasted for an average or longer-than-average period. The biomass of phytoplankton in offshore waters has been near or above average on the Newfoundland and Labrador Shelves and in the Gulf of St. Lawrence and near or below average on the Scotian Shelf. The intensity of the spring bloom was not as consistent; it was more intense in 2018 and 2019 and near average in 2020.
The timing, duration, and magnitude of phytoplankton blooms have implications on how energy flows through marine food webs. The biomass of phytoplankton determines the quantity of food available for zooplankton.
Spotlight: Measuring phytoplankton at sea and from space
The concentration of chlorophyll a in seawater is used as a substitute for measuring phytoplankton biomass. Ocean samples collected from ships during research surveys and ocean colour observations from satellites are used together to estimate overall phytoplankton biomass as well as the timing, duration, and magnitude of their blooms.
Point samples taken from ships at specific locations and times of the year provide biomass estimates and help to interpret satellite data. Different types of phytoplankton contain different amounts of chlorophyll a and other pigments, so they appear as different colours to satellite sensors, such as the Moderate Resolution Imaging Spectroradiometer on the Aqua satellite (MODIS-Aqua) from the National Aeronautics and Space Administration (NASA). Ocean samples of phytoplankton help convert these ocean colour observations—obtained throughout the year and covering large areas of the ocean—to chlorophyll a to acquire important information about the seasonality of phytoplankton blooms.
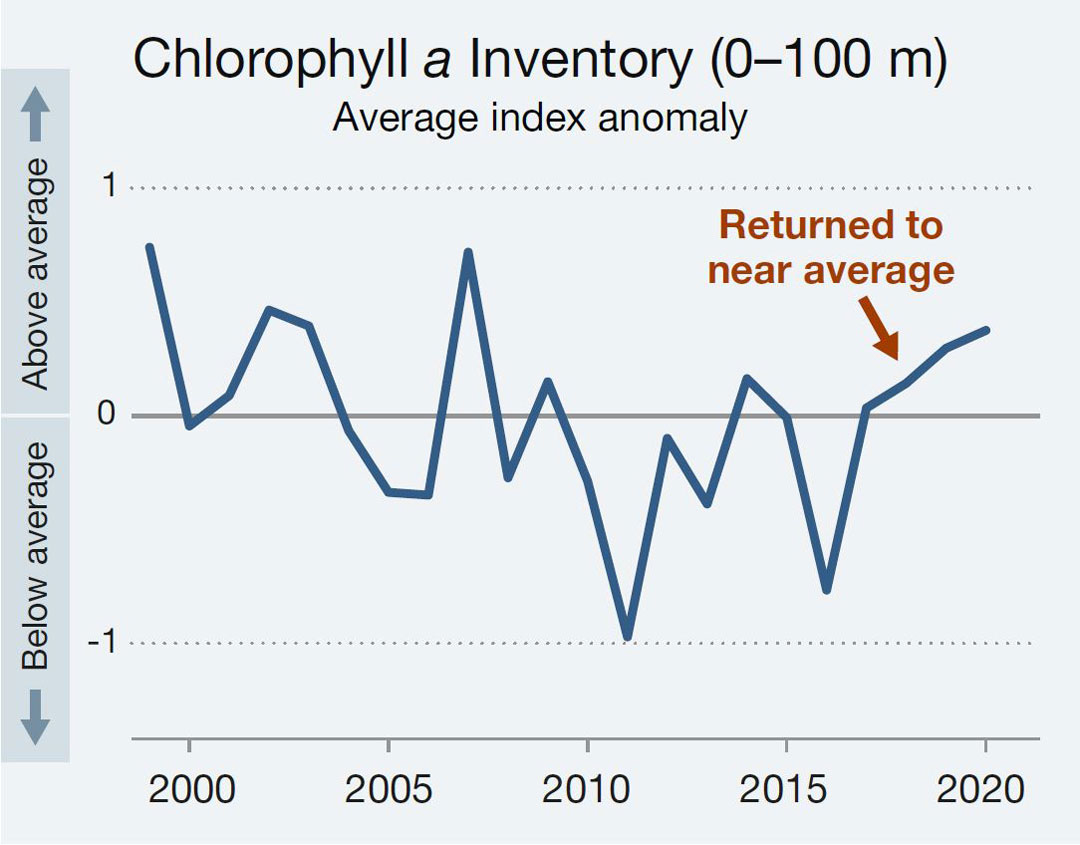
Trend for chlorophyll a (a proxy for phytoplankton) in the upper water column of Atlantic Canadian waters from 2000 to 2020 as measured from research surveys.
Text version
The y-axis is the average index anomaly from -1 to 1 with below average (0 and below) and above average (0 and above). The line representing the chloropyll a inventory fluctuates over time and is mostly below average from 2010 to 2017 and then it is above average to 2020. It has returned to near average.
| Year | Chlorophyll a Average Index Anomaly |
|---|---|
| 1999 | 0.7 |
| 2000 | 0.0 |
| 2001 | 0.1 |
| 2002 | 0.5 |
| 2003 | 0.4 |
| 2004 | -0.1 |
| 2005 | -0.3 |
| 2006 | -0.3 |
| 2007 | 0.7 |
| 2008 | -0.3 |
| 2009 | 0.1 |
| 2010 | -0.3 |
| 2011 | -1.0 |
| 2012 | -0.1 |
| 2013 | -0.4 |
| 2014 | 0.2 |
| 2015 | 0.0 |
| 2016 | -0.8 |
| 2017 | 0.0 |
| 2018 | 0.1 |
| 2019 | 0.3 |
| 2020 | 0.4 |
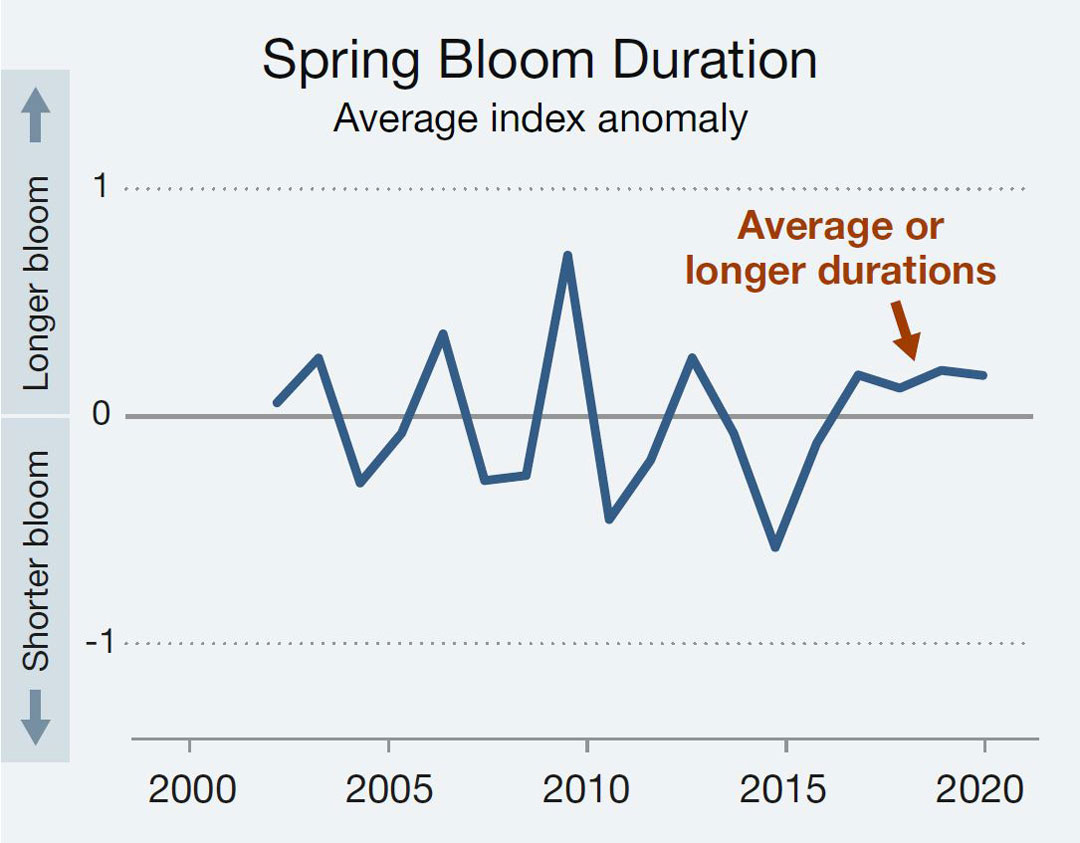
Duration of the spring phytoplankton bloom in Atlantic Canada derived from remote sensing ocean colour observations from 2003 to 2020
Text version
The y-axis is the average index anomaly from -1 to 1 with shorter bloom duration (0 and below) and longer bloom duration (0 and above). The blue line representing bloom duration fluctuates over time. It remains above average from 2017 to 2020, with average or longer durations in this period.
| Year | Spring Bloom Duration Average Index Anomaly |
|---|---|
| 2003 | 0.1 |
| 2004 | 0.3 |
| 2005 | -0.3 |
| 2006 | -0.1 |
| 2007 | 0.4 |
| 2008 | -0.3 |
| 2009 | -0.3 |
| 2010 | 0.7 |
| 2011 | -0.5 |
| 2012 | -0.2 |
| 2013 | 0.3 |
| 2014 | -0.1 |
| 2015 | -0.6 |
| 2016 | -0.1 |
| 2017 | 0.2 |
| 2018 | 0.1 |
| 2019 | 0.2 |
| 2020 | 0.2 |
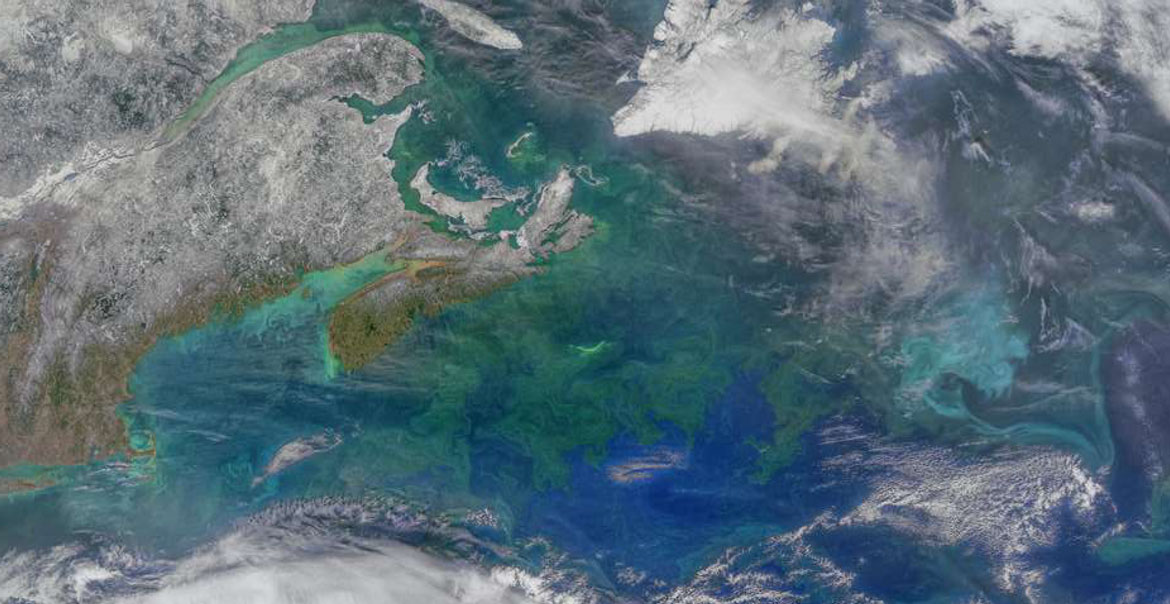
Since 2003, observations of surface chlorophyll a from satellites have allowed scientists to track the oceanic phytoplankton seasonal cycle and characteristics of the spring phytoplankton bloom in Atlantic Canada. Different phytoplankton communities bloom around the Canadian Maritime Provinces and across the northwestern Atlantic Ocean in this Aqua/MODIS composite collected on March 22, 2021. NASA.
Zooplankton
Zooplankton are the main consumers of phytoplankton and are a critical link to larger marine animals. Larger, more fatty zooplankton provide a more efficient energy source—animals obtain more food with less time and effort spent on feeding, which affects their potential growth and health.
From 2018 to 2020, overall zooplankton biomass was at near-average levels across the Atlantic—an increase from lower-than-average levels from 2010 to 2017. The abundance of the large, energy-rich copepod Calanus finmarchicus also rebounded from record lows in 2015 to near-average levels in 2018. Increases are occurring in some areas of each bioregion, but not all. In contrast, smaller, lower energy copepod species (Pseudocalanus spp.) decreased to near-average levels across the Atlantic bioregions from 2016 to 2020 after a record high in 2015.
The overall abundance of zooplankton and the relative numbers of their species groups are used to understand aspects of ecosystem productivity, like the potential impacts on the health of small pelagic fish stocks and the movement of North Atlantic Right Whales.

The rest of the zooplankton community—including pelagic tunicates and gastropods, krill, chaetognaths, cnidarians, and larval forms of molluscs, barnacles, worms, echinoderms, and fish—drift and grow in the upper ocean layers as part of the rich diversity of planktonic life. The total abundance of these non-copepod zooplankton peaked in 2015 and then gradually declined. However, it has remained mainly above average on the Newfoundland and Labrador Shelves and in the Gulf of St. Lawrence and less so on the Scotian Shelf.
Spotlight: New techniques for sorting through coastal zooplankton
Zooplankton are diverse, numerous, and difficult to see with the naked eye. In coastal waters, scientists are using new methods to identify these species as quickly and accurately as possible to make better decisions about protecting coastal waters.
Identifying and measuring zooplankton typically requires a microscope, a library of existing species in the area, and a significant amount of time. Some of this process can be automated using FlowCam®, an automated imaging technology that combines digital imaging with microscopy. FlowCam® has already been used to analyze zooplankton across Atlantic Canada, and as species libraries are built, the speed and accuracy of identification will improve.
Environmental DNA is also being used to identify zooplankton species more efficiently than traditional methods of collecting and identifying individual animals. If a species is present in the water column, so is its DNA. Water from the habitat of a species can be collected and analyzed for traces of DNA rather than looking for the zooplankton themselves. This technique can identify when different species are present in the water column, when they die off, and which species are found together.
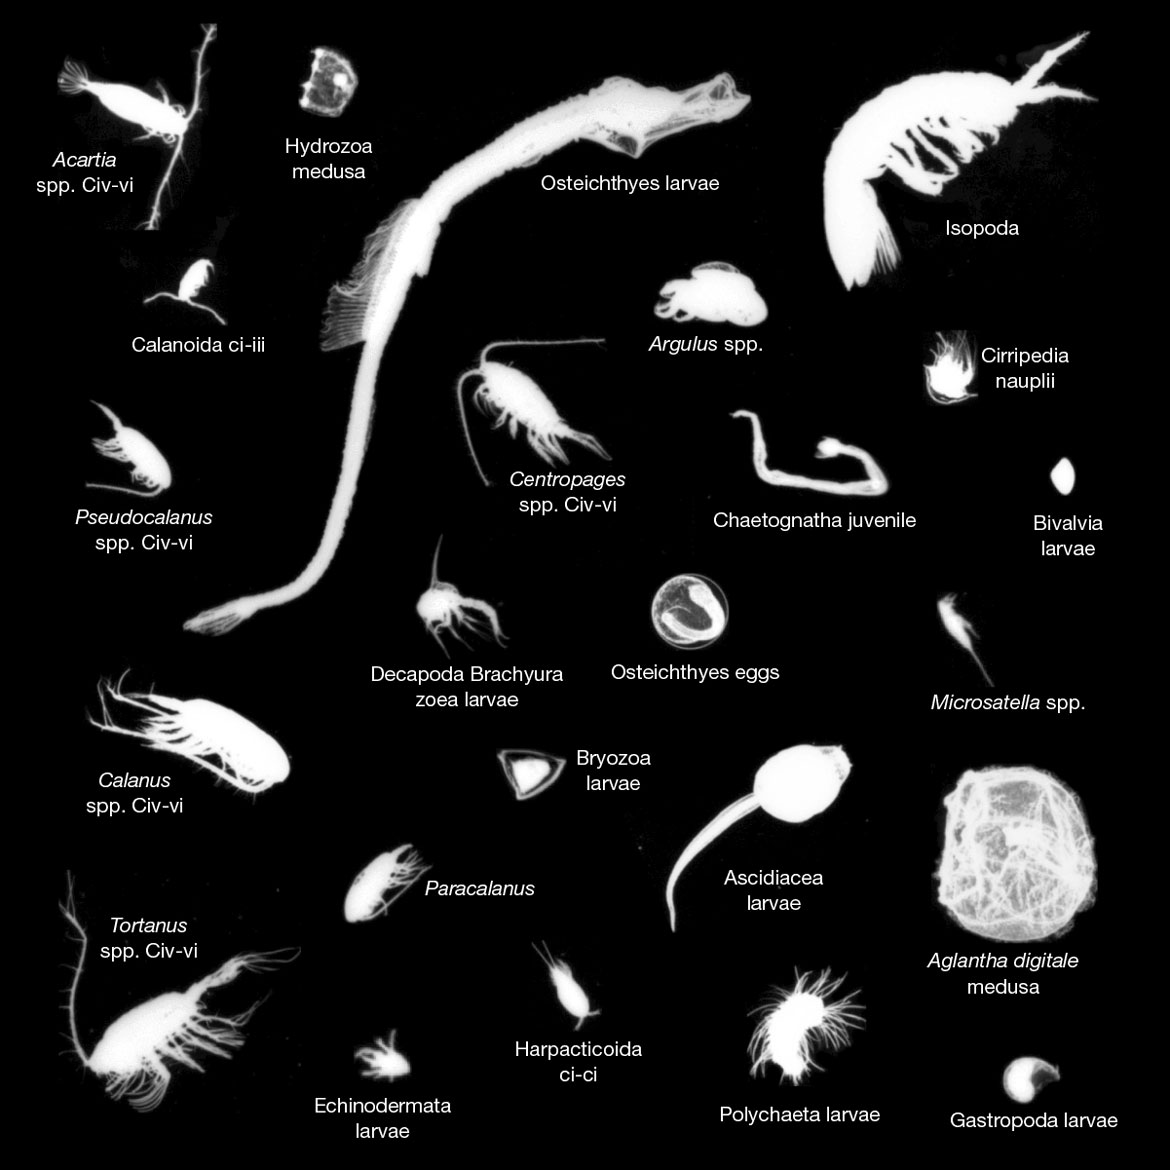
Coastal zooplankton species identified using FlowCam® images in the Gulf of St. Lawrence in 2020.
Text version
- Acartia spp. Civ-vi
- Hydrozoa medusa
- Osteichthys larvae
- Isopoda
- Calanoida ci-iii
- Argulus spp.
- Cirripedia nauplii
- Pseudocalanus spp. Civ-vi
- Centropages spp Civ-vi
- Chaetognatha juvenile
- Bivalvia larvae
- Decapoda Brachyura zoae larvae
- Osteichthys eggs
- Calanus spp. Civ-vi
- Bryozoa larvae
- Microsatella spp.
- Tortanus spp. Civ-vi
- Paracalanus
- Ascidiacea larvae
- Aglantha digitale medusa
- Echinodermata larvae
- Harpacticoida ci-ci
- Polychaeta larvae
- Gastropoda
Life in the Atlantic: Kelp and Eelgrass
Kelp and Eelgrass face a number of challenges and are not equally healthy in all areas.
| Component | Status and/or trend | Bioregion |
|---|---|---|
| Kelp spp. | No recent data | GSL, NLS |
| Declined 85–99% over the last 4 to 6 decades; some replacement by turf algae | SS | |
| Eelgrass | > 50% beds decreasing, others stable or increasing | GSL |
| 50% beds stable or increasing, 50% decreasing | SS | |
| Most stable or expanding, fewer decreasing | NLS |
Kelp and Eelgrass that grow near Atlantic Canada's shores contribute greatly to the physical, chemical, and biological functioning of coastal ecosystems. They produce oxygen, take up and store carbon in their structure, and provide nursery habitats for juvenile fish and invertebrates. Eelgrass also buffers the shoreline and provides a stable habitat for invertebrates to colonize on sandy bottoms.
There are five dominant kelp species in Atlantic Canada that are found together and are considered here as a group. Kelp forests along the Atlantic coast of Nova Scotia have declined in abundance by 85 to 99% since the 1950s. In the Gulf of St. Lawrence, they have been stable at low abundance since the 1980s. The historical trajectory of kelp in all other parts of Atlantic Canada is not well known. Kelp loss in Nova Scotia has been linked to warming temperatures, invasive species, and competition with other seaweeds. Sea urchin grazing is also having a major impact on kelp in Newfoundland and the Gulf of St. Lawrence, although the current extent of the impact is unknown.
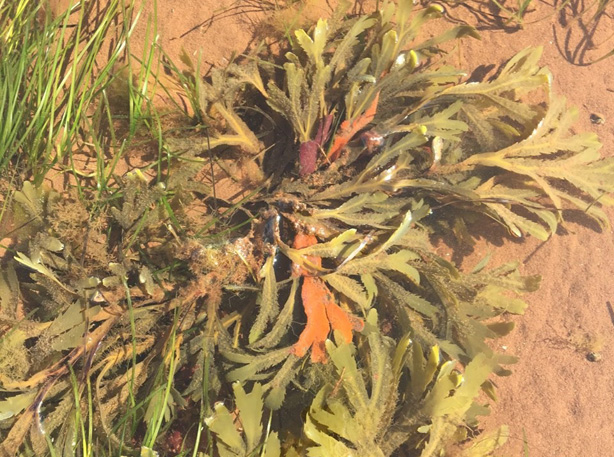
Spotlight: Impact of invasive species on kelp and Eelgrass
Multiple species invasions have affected kelp and Eelgrass along the Atlantic coast of Canada. The invasive Coffin Box Bryozoan, a colonial invertebrate, settles and grows on kelp blades. This decreases the strength of the blades, increasing their breakage during storms. Once the kelp is broken, it can be more easily replaced by other invasive species, such as the Oyster Thief green algae or Toothed Wrack Seaweed. Once these competitors become established, it is very difficult to reverse the changes, which leads to a reduction or loss of kelp's ecosystem services, including oxygen production, carbon sequestration, and habitat for other marine animals.
Invasive tunicates, like the Violet Tunicate, can cover Eelgrass blades, reducing shoot growth, photosynthesis, and shoot survival, thereby destroying Eelgrass beds as they spread. Invasive European Green Crabs have also been shown to reduce the survival of Eelgrass shoots through feeding and by disturbing the sediment.

Close-up of Coffin Box bryozoan (Membranipora membranacea) on Sugar Kelp (Saccharina latissima) and Sea Lettuce (Ulva spp.), seen through a microscope lens. E. Watson. DFO.
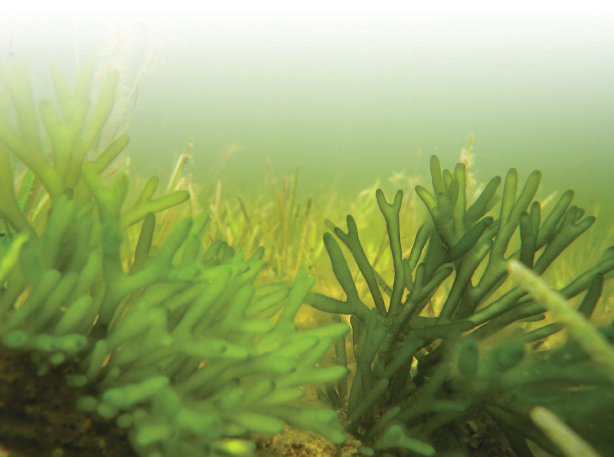
Invasive Oyster Thief (Codium fragile fragile) amongst Eelgrass beds. C. McKindsey. DFO.
Invasive Violet Tunicate (Botrylloides violaceus) smothering Toothed Wrack Seaweed (Fucus serratus) growing amongst Eelgrass beds. C. Mills. DFO.

Invasive colony of Violet Tunicate (Botrylloides violaceus) smothering blades of Eelgrass. E. Kitchen. DFO.
The dominant species of seagrass in Atlantic Canada is Eelgrass and only a small number of Eelgrass beds in the Atlantic bioregions have been assessed in the last decade. Although the majority (69%) of Eelgrass beds were stable or increasing in size and plant density, most of these were on the Newfoundland and Labrador Shelves. Most of the declining Eelgrass beds were on the Atlantic coast of Nova Scotia and in the Gulf of St. Lawrence. Eelgrass loss in the Gulf of St. Lawrence has been linked to increased nitrate in the water, but many other stressors create an unfavourable environment for Eelgrass, such as coastal construction, invasive species, land runoff, warming, and more frequent storms. The cumulative effect of these stressors can be an even bigger problem: 26% of studied Eelgrass beds on the Scotian Shelf and in the southern Gulf of St. Lawrence were at a higher risk of being degraded because of multiple human activities.

Life in the Atlantic: Large Invertebrates
American Lobster has become highly abundant throughout Atlantic Canada.
| - | Component | Status and/or trend | Bioregion |
|---|---|---|---|
| Crustaceans | American Lobster | Total landings at record highs | GSL, SS, NLS |
| Snow Crab | Survey index is variable and close to average | sGSL | |
| Survey index increasing to near average | NLS | ||
| Northern Shrimp | Survey index at or below historical lows | nGSL, NLS | |
| Eastern stock was healthier in 2020 than 2021 | SS | ||
| Molluscs | Scallop | Landings stable but below average | GSL |
| Stock indices indicate all stocks are healthy; Landings stable and near average | SS | ||
| Northern Shortfin Squid | Incidental catch in survey increasing since 2017 | nGSL |
An extremely broad range of marine species belong to the invertebrates group—from corals and sponges to crustaceans, molluscs, and echinoderms—and they occupy an equally broad range of environments. All invertebrates are ecologically important and many are fished, either throughout Atlantic waters or in small areas within a bioregion.
Reading the report: Research surveys and commercial fishery data
The overall status of large invertebrate and fish species are reported as abundance, biomass, or indices developed from research surveys or fishery catches. Graphs of long-term trends are used in this report to illustrate general patterns in the populations or the fisheries at the bioregion level.
Research surveys use quantitative methods (employing standard equipment over consistent areas at regular intervals) to collect information on fish and large invertebrate abundances and environmental conditions.
Landings are the amount of a fished species that is caught and brought to shore. Landings can change because of external factors, like fisheries closures, market conditions, and changing management measures.
Spotlight: Identifying sponges in the southern Gulf of St. Lawrence
Sponges are an ancient group of relatively simple animals that can create complex underwater structures. Unlike other animals that can be easily identified by size or shape, sponges often grow to take advantage of currents and have unpredictable patterns of body symmetry, which makes it difficult to identify different species based on visual characteristics alone. For hard-to-identify specimens, using DNA and microscopic analysis of individual sponge spicules—the skeletal components of a sponge—has improved our knowledge of the number of sponge species present in the Atlantic and has led to the discovery of new species. These discoveries will help identify key habitats requiring protection from bottom-contact activities and increase our understanding of biodiversity in the Gulf of St. Lawrence.
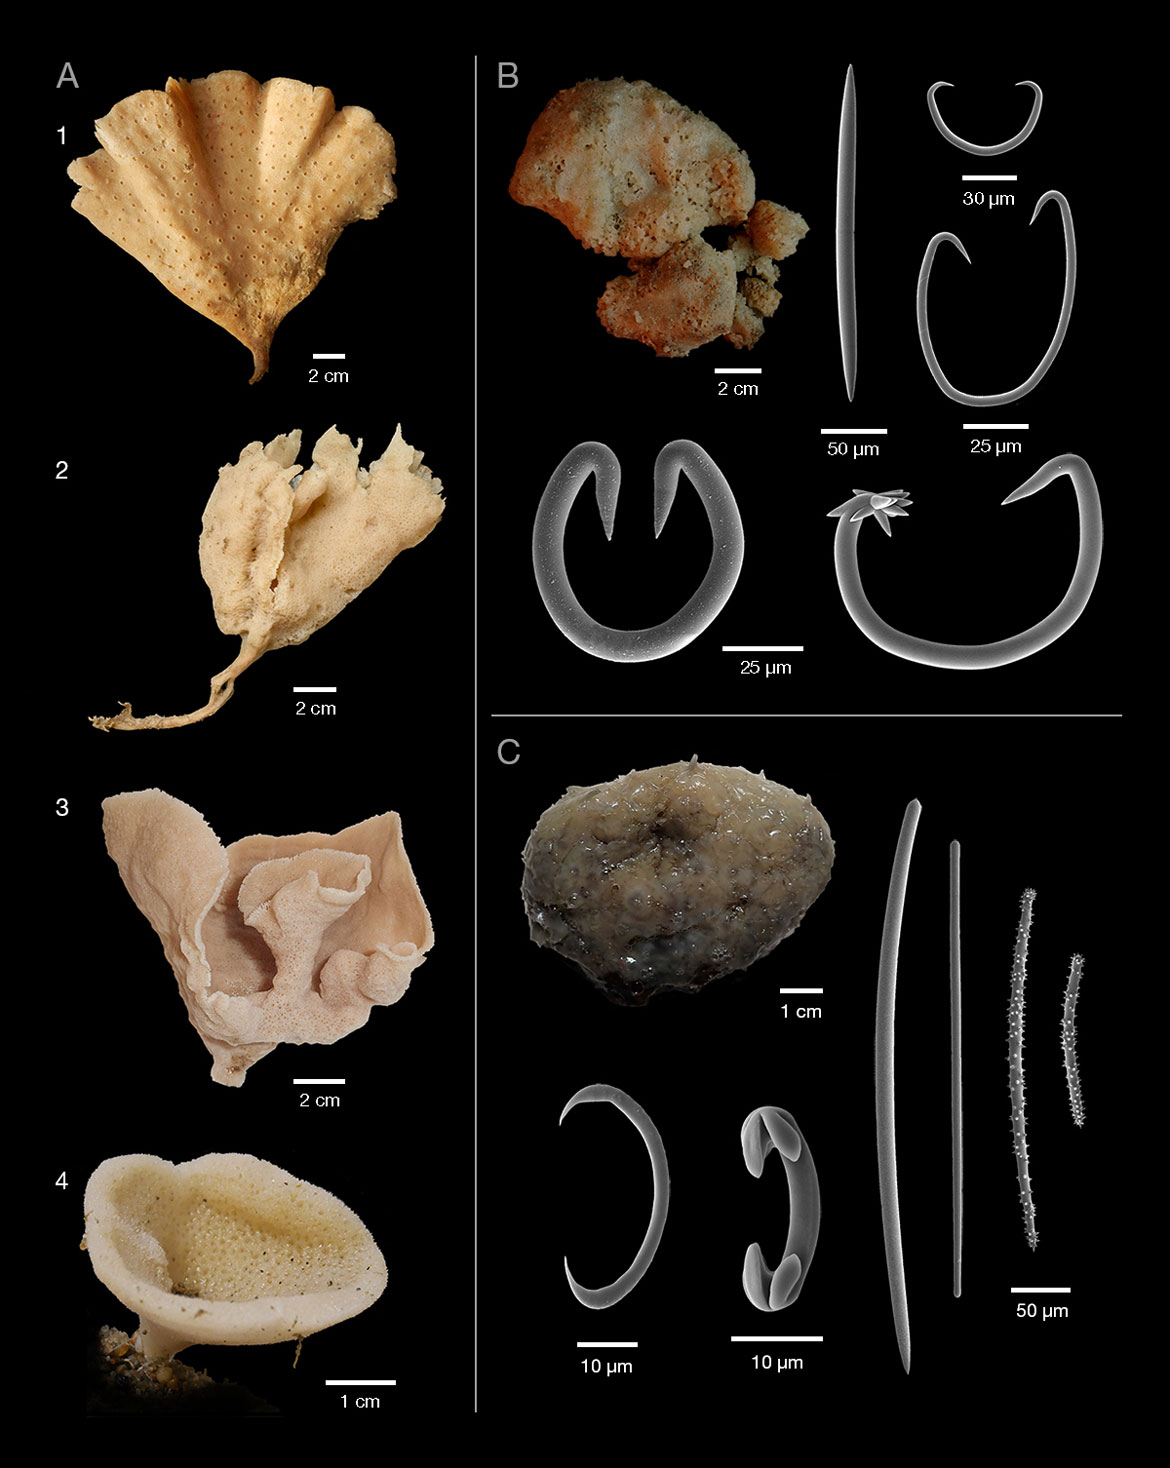
Some sponge species identified from the Atlantic.
- Four fan-shaped sponges from eastern Canada which look similar but represent species that are not related to one anotherFootnote 1
- Cladocroce spatula
- Semisuberites cribrosa
- Plicatellopsis bowerbanki
- Axinella arctica
- New species Haliclona (Flagellia) xenomorpha specimen and spiculesFootnote 2
- New species Crella (Pytheas) cutis specimen and spiculesFootnote 3
In recent decades, crustacean fisheries have been the most valuable of all fisheries in Atlantic Canada. Lobster landings were at record highs from 2017 to 2020 across all bioregions, and American Lobster is considered a healthy stock in the southern Gulf of St. Lawrence and on the Scotian Shelf.
Annual research surveys are conducted in each of the Snow Crab stocks, in the southern Gulf of St. Lawrence and on the Newfoundland and Labrador Shelves, annual research surveys have shown the stocks to be about average. Snow Crab landings across Atlantic Canada have been declining since 2016. They reached very low levels in the northern Gulf of St. Lawrence in 2020 as well as on the Scotian Shelf and Newfoundland and Labrador Shelves in 2017 and 2018, where they remain below average. However, most other crab species had low or declining landings from 2017 to 2020.

Snow Crab survey index anomalies for southern Gulf of St. Lawrence and the Newfoundland and Labrador Shelves.
Text version
On the y-axis is the standardized anomaly with below average (0 and below) and above average (0 and above). The dark blue line represents the survey index anomaly is above average in the 1990s but then decreases to below average for most of the 2000s. It increased to just above average in 2018. Survey indices for the southern Gulf of St Lawrence and the Newfoundland and Labrador Shelves are closer to average in 2020.
| Year | Standardized Survey Index Anomaly (sGSL, NLS) |
|---|---|
| 1990 | 3.6 |
| 1991 | 1.2 |
| 1992 | 0.0 |
| 1993 | -0.1 |
| 1994 | 0.8 |
| 1995 | 0.4 |
| 1996 | 1.5 |
| 1997 | 0.7 |
| 1998 | 2.0 |
| 1999 | 0.5 |
| 2000 | -0.4 |
| 2001 | -0.5 |
| 2002 | -1.0 |
| 2003 | -0.9 |
| 2004 | -0.8 |
| 2005 | -0.4 |
| 2006 | -0.9 |
| 2007 | -1.3 |
| 2008 | -0.8 |
| 2009 | -0.7 |
| 2010 | -0.8 |
| 2011 | -0.6 |
| 2012 | -1.0 |
| 2013 | 0.8 |
| 2014 | -0.4 |
| 2015 | -1.0 |
| 2016 | 0.1 |
| 2017 | -1.1 |
| 2018 | -0.5 |
| 2019 | 1.0 |
| 2020 | 0.3 |
Spotlight: Climate change has positive and negative effects on American Lobster
Warmer waters are thought to be responsible, at least in part, for the higher production of American Lobster in Atlantic Canada. However, in areas that are particularly warm, the health of lobster is negatively affected. Impacts on larvae can lead to smaller sizes of mature adults, and these adults may be more susceptible to diseases. In combination with warming, ocean acidification could also negatively affect larvae, juveniles, and adults, with consequences for their overall abundance.

American Lobster standardized landings anomaly
Text version
On the y-axis is standardized landings anomaly with below average (0 and below) and above average (0 and above). The blue line representing the standardized landings anomaly increases over time from mostly below average and then continuously increasing and above average since the early 2010s to 2020. Approaching 2020, landings are at record highs.
| Year | Standardized Landings Anomaly |
|---|---|
| 1990 | 0.6 |
| 1991 | 1.1 |
| 1992 | 1.0 |
| 1993 | -0.8 |
| 1994 | -1.8 |
| 1995 | -1.5 |
| 1996 | -2.0 |
| 1997 | -3.4 |
| 1998 | -3.2 |
| 1999 | -3.4 |
| 2000 | -3.2 |
| 2001 | -1.8 |
| 2002 | -2.7 |
| 2003 | -2.1 |
| 2004 | -3.0 |
| 2005 | -1.3 |
| 2006 | -0.5 |
| 2007 | -1.2 |
| 2008 | 1.0 |
| 2009 | 0.2 |
| 2010 | 2.1 |
| 2011 | -0.4 |
| 2012 | 1.9 |
| 2013 | 3.1 |
| 2014 | 5.8 |
| 2015 | 8.2 |
| 2016 | 7.1 |
| 2017 | 11.9 |
| 2018 | 14.2 |
| 2019 | 19.6 |
Recently, Northern Shrimp survey indices have been at or below historical lows in the northern Gulf of St. Lawrence and the Newfoundland and Labrador Shelves. The status of the eastern Scotian Shelf stock was healthier in 2020 than 2021.
Sea Scallops are the primary mollusc species targeted by fisheries in Atlantic Canada and are the fourth most important fishery in terms of value; Iceland Scallops are also fished in the northern Gulf of St. Lawrence. From 2017 to 2020, combined landings of Sea Scallop and Iceland Scallop were stable in the Gulf of St. Lawrence but still below average. On the Scotian Shelf, Sea Scallop populations are considered healthy and landings have been relatively stable.
Northern Shortfin Squid is caught incidentally during research surveys and not targeted directly. Northern Shortfin Squid is a short-lived, fast-growing species that uses the Gulf Stream to migrate over long distances, reaching Atlantic Canadian waters in the early autumn. In the northern Gulf of St. Lawrence, catches of Northern Shortfin Squid have been increasing in number since 2017 and reached a record-high abundance in 2020 that was eight times greater than the long-term average.
Increases and decreases in invertebrate populations have important consequences for marine communities and their food webs. Many invertebrates are key prey species for fish and marine mammals and can impact their predators' health and survival. Together, invertebrates and fish are linked through their predator–prey relationships to form an interconnected ecological community that responds to changes in the environment.
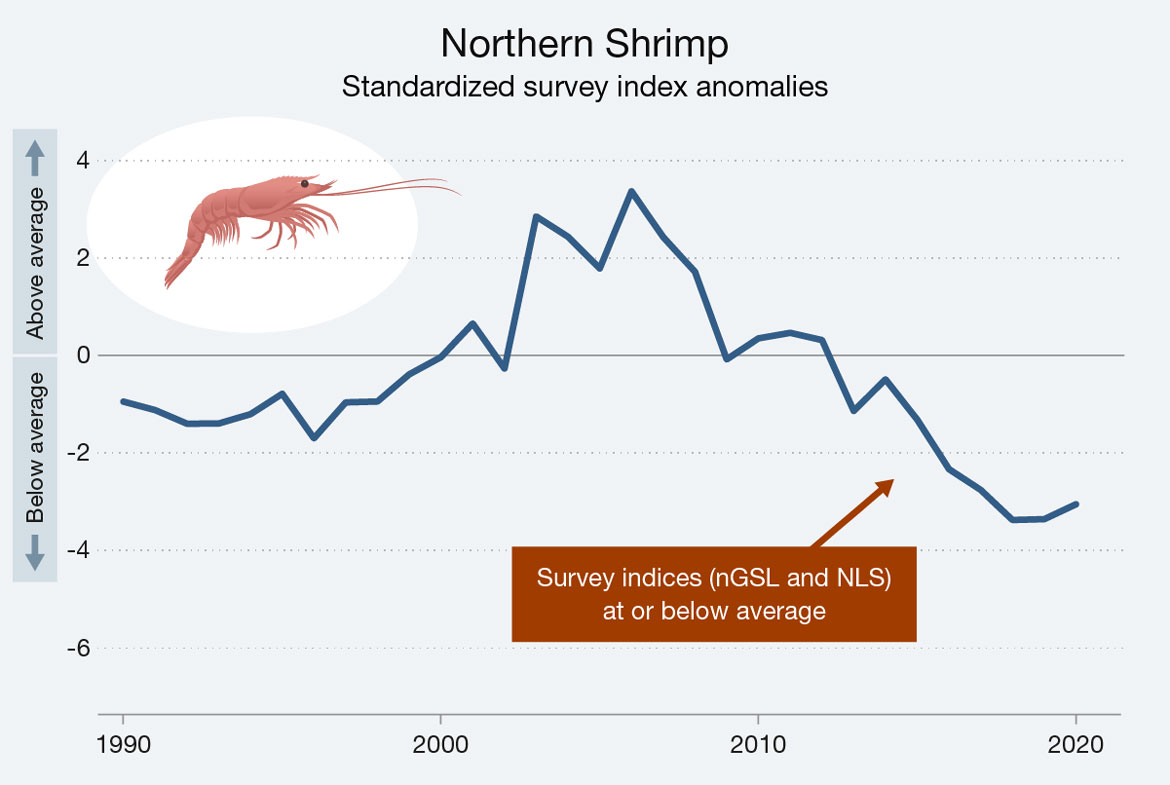
Northern Shrimp standardized survey index anomalies
Text version
On the y-axis is the standardized landings anomaly with below average (0 and below) and above average (0 and above). The blue line representing the survey index anomalies increases over time to the 2000s and then decreases starting in the mid-2000s. Between 2010 and 2020, the graph indicates that the survey indices are at or below average.
| Year | Standardized Survey Index Anomalies (nGSL, NLS) |
|---|---|
| 1990 | -0.9 |
| 1991 | -1.1 |
| 1992 | -1.4 |
| 1993 | -1.4 |
| 1994 | -1.2 |
| 1995 | -0.8 |
| 1996 | -1.7 |
| 1997 | -1.0 |
| 1998 | -0.9 |
| 1999 | -0.4 |
| 2000 | 0.0 |
| 2001 | 0.7 |
| 2002 | -0.3 |
| 2003 | 2.9 |
| 2004 | 2.4 |
| 2005 | 1.8 |
| 2006 | 3.4 |
| 2007 | 2.4 |
| 2008 | 1.7 |
| 2009 | -0.1 |
| 2010 | 0.4 |
| 2011 | 0.5 |
| 2012 | 0.3 |
| 2013 | -1.1 |
| 2014 | -0.5 |
| 2015 | -1.3 |
| 2016 | -2.3 |
| 2017 | -2.8 |
| 2018 | -3.4 |
| 2019 | -3.4 |
| 2020 | -3.1 |

Life in the Atlantic: Fish
Fish in Atlantic Canada's waters are diverse. They occupy various habitats, fulfilling different roles in the ecosystem—both predator and prey—that can change over their lives. Historically, many fish were overharvested in Atlantic Canada—from pelagic fish to demersal fish, diadramous fish, and even sharks. Many of these ecologically and economically important species remain at low levels today. This, along with changes in populations of invertebrates, has altered the structure of demersal communities in many areas.
Demersal fish live on or near the ocean floor—the demersal zone.
Pelagic fish inhabit the middle and upper parts of the water column.
Diadromous fish spend part of their lives in rivers and part in the ocean.

Pelagic Fish
Small forage fish stocks have continued to decline or remain stable at low levels.
| - | Component | Status and/or trend | Bioregion |
|---|---|---|---|
| Small pelagics | Atlantic Herring | Low biomass | GSL |
| Historically low abundance on the eastern SS | SS | ||
| Atlantic Mackerel | Low spawning stock biomass | GSL, SS, NLS | |
| Lowest ever landings observed in 2020 | nGSL | ||
| Very low landings | SS | ||
| Capelin | Fishery performance index above average | nGSL | |
| Low biomass | sGSL | ||
| Much lower biomass than historical levels | NLS | ||
| Large pelagics | Porbeagle Shark | Signs of population increase | GSL, SS, NLS |
| Endangered (COSEWIC) | GSL, SS, NLS | ||
| White Shark | Signs of population increase | GSL, SS, NLS | |
| Endangered (COSEWIC) | GSL, SS, NLS | ||
| Blue Shark | Not at risk | GSL, SS, NLS | |
| Shortfin Mako Shark | Endangered (COSEWIC) | GSL, SS, NLS |
Small pelagic fish transfer energy from zooplankton to higher trophic levels, which include larger pelagic and demersal fish, seabirds, seals, and some whales. Overfishing in the 1970s and 1980s decreased the abundance of many species to very low levels across the Atlantic bioregions. Although the return to near-average levels of Calanus finmarchicus in 2020 means more potential energy for the small pelagic fish that feed on them, most stocks of Atlantic Herring and Capelin as well as the Atlantic Mackerel stock, remain at low levels or continue to decline. The continued low abundance of small pelagic fish echoes throughout the ecosystem.
Spotlight: Lack of Capelin limits recovery of demersal fish on the Newfoundland and Labrador Shelves
Historically, demersal fish—particularly Atlantic Cod—dominated the waters of the Newfoundland and Labrador Shelves, thriving on Capelin, their key prey. However, both demersal fish and Capelin declined to very low levels in the early 1990s and have remained low. The collapse was caused by the compounding effect of less favourable environmental conditions and overfishing. Due to the lack of Capelin, the diet of demersal fish shifted to lower-energy prey, such as Snow Crab and Northern Shrimp, which have not been able to sustain a recovery to previous levels.
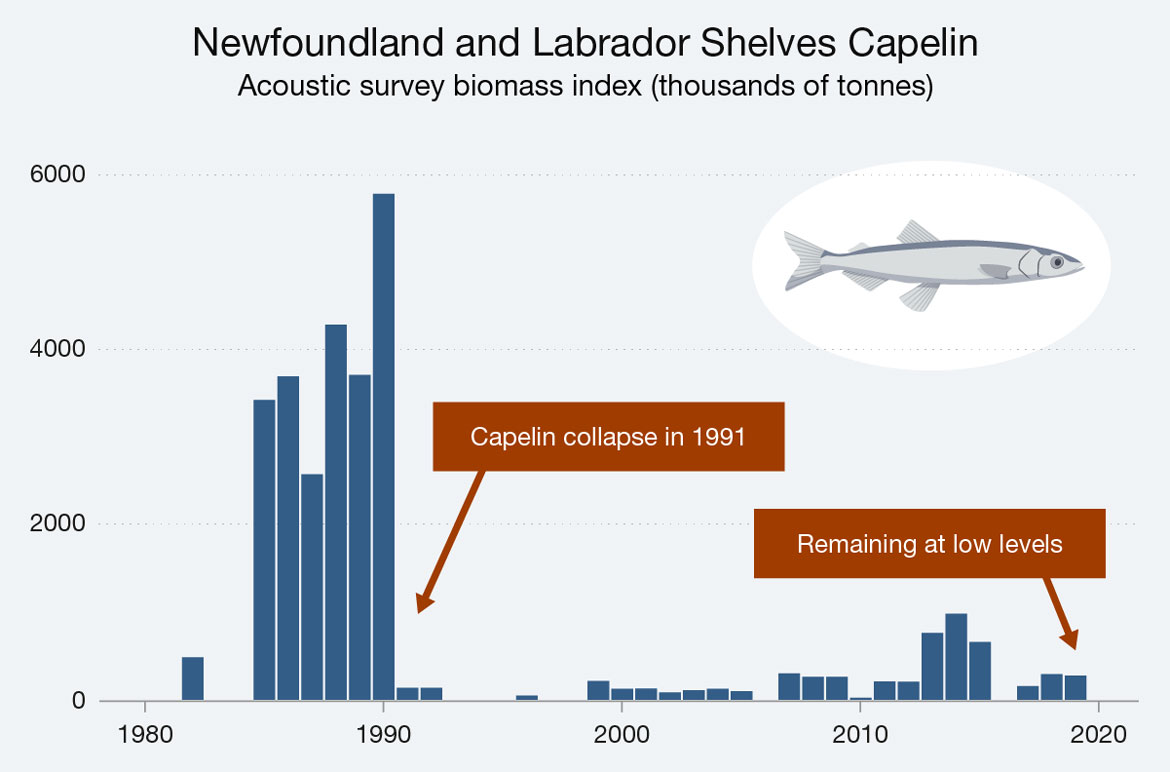
Biomass index (in thousands of tonnes) for Capelin from the spring acoustic survey off the eastern coast of Newfoundland (NAFO Division 3L) from 1980 to 2019.
Text version
On the y-axis is the biomass index in thousands of tonnes with a range of 0 to 6000. The blue bars on the graph representing the biomass index are higher in the 1980s peaking in 1990 near 6,000,000 tonnes. The bars then decrease to low values which increase slightly in the 2010s. For some of these years, data is not available. There was a collapse of capelin in 1991 and capelin remain at low levels in recent years.
| Year | Acoustic Survey Biomass Index (thousands of tonnes) |
|---|---|
| 1980 | NA |
| 1981 | NA |
| 1982 | 486 |
| 1983 | NA |
| 1984 | NA |
| 1985 | 3426 |
| 1986 | 3697 |
| 1987 | 2576 |
| 1988 | 4285 |
| 1989 | 3712 |
| 1990 | 5783 |
| 1991 | 138 |
| 1992 | 138 |
| 1993 | NA |
| 1994 | NA |
| 1995 | NA |
| 1996 | 47 |
| 1997 | NA |
| 1998 | NA |
| 1999 | 216 |
| 2000 | 125 |
| 2001 | 129 |
| 2002 | 84 |
| 2003 | 108 |
| 2004 | 125 |
| 2005 | 98 |
| 2006 | NA |
| 2007 | 300 |
| 2008 | 263 |
| 2009 | 262 |
| 2010 | 23 |
| 2011 | 210 |
| 2012 | 206 |
| 2013 | 763 |
| 2014 | 983 |
| 2015 | 661 |
| 2016 | NA |
| 2017 | 157 |
| 2018 | 293 |
| 2019 | 277 |
| 2020 | NA |
A diverse number of pelagic shark species occur throughout Atlantic Canadian waters. Some sharks reside year-round, while others are seasonal or occasional visitors, which makes it difficult to accurately assess their population size. Most data on pelagic sharks come from reports of bycatch discarded at sea from commercial fisheries. Blue Sharks tend to be the most commonly captured species, while Shortfin Mako Shark, Common Thresher Shark, and Porbeagle Shark are caught periodically. Status and trends for most species are currently unknown, although there is evidence of a recent population increase for two species at risk: the Porbeagle Shark and White Shark.
Demersal Fish
Redfish has become more prominent, while most other species remain low or have not recovered to historical levels.
| Component | Status and/or trend | Bioregion |
|---|---|---|
| Redfish | High biomass and increasing | GSL |
| Stable or declining | SS | |
| High biomass but lower on Grand Banks | NLS | |
| Atlantic Halibut | Above-average biomass | GSL, SS, NLS |
| American Plaice | Little recovery | sGSL |
| Biomass indices below historical levels, but form a high proportion of demersal fish biomass in NAFO Division 2J3KL | NLS | |
| Greenland Halibut | Slight increase and stabilized after earlier declines | nGSL |
| Silver Hake | Low but large proportion of demersal biomass | SS |
| Becoming more prominent | NLS | |
| Atlantic Cod | Abundance below historical levels in most areas | GSL, SS, NLS |
| Low but increasing biomass | nGSL | |
| Low/very low abundance | SS | |
| Stable/increasing in areas but low biomass | NLS | |
| Thorny Skate | Stable but low biomass in areas | GSL |
| Very low and declining biomass | SS | |
| High biomass and increasing in areas | NLS | |
| Smooth Skate | Low abundance | GSL, SS |
| Higher than average in areas with some decline | NLS | |
| Spiny Dogfish | Virtually absent | sGSL |
| Below average and variable biomass | SS | |
| Peaked in late 2010s, now very low biomass | NLS | |
| Black Dogfish | Increasing with record-high catches | nGSL |
| Virtually absent | sGSL | |
| Highly variable and well below average in areas | NLS |
Demersal fish have long been the basis for important commercial fisheries in Atlantic Canada but also play an important role as predators. A collapse of many demersal fish populations occurred by the 1990s—including important commercial species such as Atlantic Cod—due to a combination of overfishing and changing environmental conditions.
The total biomass of demersal fish remains lower overall than in the past across Atlantic Canada. Across all bioregions, the most abundant component of the demersal fish community in recent years has been redfish. This is a significant change from low levels in the 1990s. Because of high recruitment in 2011, 2012, and 2013 in the northern Gulf of St. Lawrence, high Deepwater Redfish biomass led to the highest levels of demersal fish biomass ever observed between 2016 and 2021.
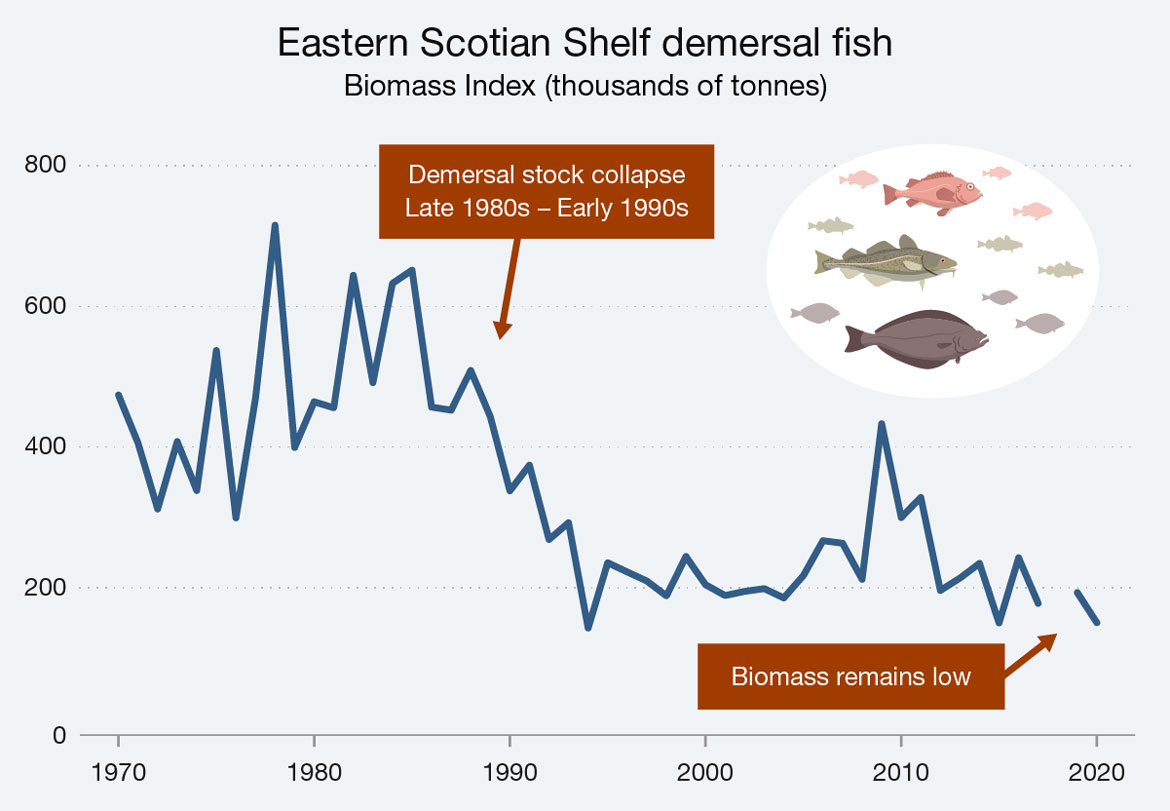
Total biomass of demersal fish caught in research surveys on the eastern Scotian Shelf (NAFO Divisions 4VW) since 1970. No data were collected in 2018.
Text version
On the y-axis is the biomass index in thousands of tonnes ranging from 0 to 800. The blue line representing the biomass index fluctuates over time with increased values in the 1970s and 1980s. In the late 1980s it begins to decrease and remains low with a slight increase around 2010. There is a gap in the line where no data was collected in 2018. There was a demersal stock collapse in the late 1980s to early 1990s, and biomass remains low.
| Year | Biomass Index (tonnes) |
|---|---|
| 1970 | 473,873 |
| 1971 | 405,303 |
| 1972 | 311,682 |
| 1973 | 407,633 |
| 1974 | 338,012 |
| 1975 | 537,266 |
| 1976 | 299,037 |
| 1977 | 469,469 |
| 1978 | 715,582 |
| 1979 | 399,267 |
| 1980 | 464,242 |
| 1981 | 455,753 |
| 1982 | 644,312 |
| 1983 | 491,549 |
| 1984 | 632,743 |
| 1985 | 651,686 |
| 1986 | 456,750 |
| 1987 | 452,347 |
| 1988 | 508,873 |
| 1989 | 443,175 |
| 1990 | 337,641 |
| 1991 | 374,133 |
| 1992 | 268,293 |
| 1993 | 292,242 |
| 1994 | 142,211 |
| 1995 | 235,299 |
| 1996 | 222,075 |
| 1997 | 209,201 |
| 1998 | 188,027 |
| 1999 | 244,152 |
| 2000 | 203,871 |
| 2001 | 188,568 |
| 2002 | 194,407 |
| 2003 | 198,327 |
| 2004 | 185,104 |
| 2005 | 216,849 |
| 2006 | 266,590 |
| 2007 | 262,984 |
| 2008 | 211,560 |
| 2009 | 433,050 |
| 2010 | 299,553 |
| 2011 | 328,133 |
| 2012 | 195,687 |
| 2013 | 213,324 |
| 2014 | 234,332 |
| 2015 | 149,509 |
| 2016 | 242,268 |
| 2017 | 177,350 |
| 2018 | No data |
| 2019 | 192,741 |
| 2020 | 149,792 |
Spotlight: Golden, Deepwater, and Acadian Redfish
Redfish is the general name used for three different but closely related species: Deepwater Redfish, Acadian Redfish, and Golden Redfish. These species are virtually impossible to differentiate visually and therefore some are assessed together. Only two species are common in the northern Gulf of St. Lawrence: Deepwater and Acadian redfish. Scientists took a closer look at the fish caught during the research survey, and determined that the large increase in recent years was due to Deepwater Redfish.

Weight of redfish (Deepwater and Acadian Redfish) as kilograms per tow caught in surveys in the northern Gulf of St. Lawrence from 1990 to 2021. The blue line is the weight of redfish caught and the grey bars are the total weight of fish caught in kilograms per tow.
Text version
On the y-axis is the average survey catch weight in kilograms/tow with a scale of 0 to 1000. Greyish-blue bars represent the total survey demersal fish catch and a blue line represents the survey catch for redfish. The greyish-blue bars fluctuate at lower values until the early 2010s when they start to rise, peaking in 2019. The blue line mirrors the bars but the values since the early-2010s are a high proportion of the bar values. Approaching 2019, redfish is a large proportion of total demersal biomass, and the highest biomass was recorded in 2019.
| Year | Total survey catch weight of demersal fish (kg/tow) | Survey catch weight of redfish (kg/tow) |
|---|---|---|
| 1990 | 228 | 163 |
| 1991 | 245 | 127 |
| 1992 | 140 | 97 |
| 1993 | 76 | 55 |
| 1994 | 136 | 75 |
| 1995 | 81 | 31 |
| 1996 | 91 | 28 |
| 1997 | 116 | 41 |
| 1998 | 128 | 58 |
| 1999 | 108 | 23 |
| 2000 | 143 | 29 |
| 2001 | 129 | 30 |
| 2002 | 130 | 65 |
| 2003 | 211 | 70 |
| 2004 | 99 | 14 |
| 2005 | 104 | 24 |
| 2006 | 117 | 34 |
| 2007 | 114 | 35 |
| 2008 | 108 | 34 |
| 2009 | 69 | 11 |
| 2010 | 88 | 16 |
| 2011 | 80 | 13 |
| 2012 | 89 | 16 |
| 2013 | 110 | 43 |
| 2014 | 153 | 65 |
| 2015 | 203 | 120 |
| 2016 | 399 | 313 |
| 2017 | 470 | 401 |
| 2018 | 648 | 571 |
| 2019 | 851 | 786 |
| 2020 | 618 | 536 |
| 2021 | 741 | 614 |
Atlantic Halibut remains at higher-than-average levels throughout Atlantic Canadian waters. In the Gulf of St. Lawrence, Atlantic Halibut biomass increased relatively steadily from 2000 to 2021. On the Scotian Shelf and southern Grand Banks, biomass has stabilized or declined slightly after sustained increases from the 1990s to 2020. In 2019, landings were the largest in the last 60 years in the northern Gulf of St. Lawrence, on the Scotian Shelf, and on the southern Grand Banks.
Atlantic Cod remain at historically low levels across the Atlantic, but recent trends vary among bioregions. In 2020, biomass was at its highest level in the past decade on the eastern Scotian Shelf but was at a record low in 2019 on the western Scotian Shelf. In the northern Gulf of St. Lawrence in 2020 and 2021,there was an upward trend in biomass. In one area of the Newfoundland and Labrador Shelves—the Newfoundland Shelf—the increase in Atlantic Cod biomass after 2010 appears to have stalled. However, levels remain generally higher than observed from 1990 to 2010. On the Grand Banks, biomass has increased since 2017.
Spotlight: What does it mean to be a species at risk?
The Committee on the Status of Endangered Wildlife in Canada (COSEWIC) assesses wildlife species at risk of extinction using terms such as Endangered (facing imminent local or total extinction), Threatened (likely to become Endangered if nothing is done to prevent it), or of Special Concern (may become Threatened or Endangered due to a combination of threats and biological characteristics). Species with widespread distributions, where only portions of the population exist in Atlantic Canada, such as some sea turtles, seabirds, and pelagic sharks, may be at risk internationally but not in Canada. In these cases, international conservation organizations, like the IUCN (International Union for the Conservation of Nature), may assess their status using different criteria.
Many species of sharks and skates also live near the seafloor but comprise a smaller proportion of the whole demersal fish community. In Atlantic Canada, Spiny Dogfish is the most abundant shark near the ocean bottom, but its population is not the same in all areas and its abundance varies significantly from year to year. On the western Scotian Shelf, Spiny Dogfish have dominated catches since the 1980s but were below average in 2019 and 2020. They reached peak levels in different parts of the Newfoundland and Labrador Shelves in the last four years and then returned to low levels. In the northern Gulf of St. Lawrence, another shark species—Black Dogfish—reached a record high in 2021 after increasing since 2012. However, both dogfish species have been virtually absent in the southern Gulf of St. Lawrence in the last four years.
Thorny Skate is the most abundant of the skate species in most bioregions, but its abundance was much higher in the 1970s than currently. On the Newfoundland and Labrador Shelves, Thorny Skate abundance continues to increase. In the Gulf of St. Lawrence, abundance has been stable, but it continues to decrease on the Scotian Shelf.

Diadromous Fish
Striped Bass in the southern Gulf of St. Lawrence has increased significantly since the 1990s. Atlantic Salmon continue to experience historically low abundance.
| - | Component | Status and/or trend | Bioregion |
|---|---|---|---|
| Improved | Striped Bass | Abundance increased from low levels in late 1990s | sGSL |
| Low abundance | Atlantic Salmon | Abundance of large and small salmon declined since the late 1990s and is below the long-term average | sGSL |
| Cape Breton-Atlantic: Egg deposition stable in 3 index rivers; marked declines in other rivers Mainland Nova Scotia-Atlantic: Egg deposition and return rates lowest on record Outer Bay of Fundy: Historically low egg deposition and return rates Inner Bay of Fundy: Low egg deposition and return rates |
SS | ||
| Abundance of large salmon below average on 61% of monitored rivers; total returns lower in most rivers | NLS | ||
| Gaspereau | Biomass declined since 1980s and remains low | sGSL |
Diadromous fish move between marine and freshwater environments and play an important role in the transport and exchange of nutrients between the two environments. Like other fish, many diadromous fish populations were depleted or started to decline due to overfishing and other stressors, and only a few have recovered.
Striped Bass in the southern Gulf of St. Lawrence reached low abundance in the late 1990s and have since increased above recovery objectives—the population size in 2019 was significantly larger than that of the late 1990s. However, Atlantic Salmon continue to experience historically low abundance due to factors decreasing their survival at sea.
Spotlight: Striped Bass rebounding in the southern Gulf of St. Lawrence
In the late 1990s, scientists estimated there were fewer than 5,000 spawning Striped Bass in the Miramichi River, but by 2017, adult abundance had surpassed 900,000 fish. Their increase is due to a concerted response across multiple sectors and the closure of all fisheries as well as favourable environmental conditions over the past two decades. The population continues to be above recovery targets and is once again widely distributed throughout estuaries and coastal waters of the southern Gulf of St. Lawrence.
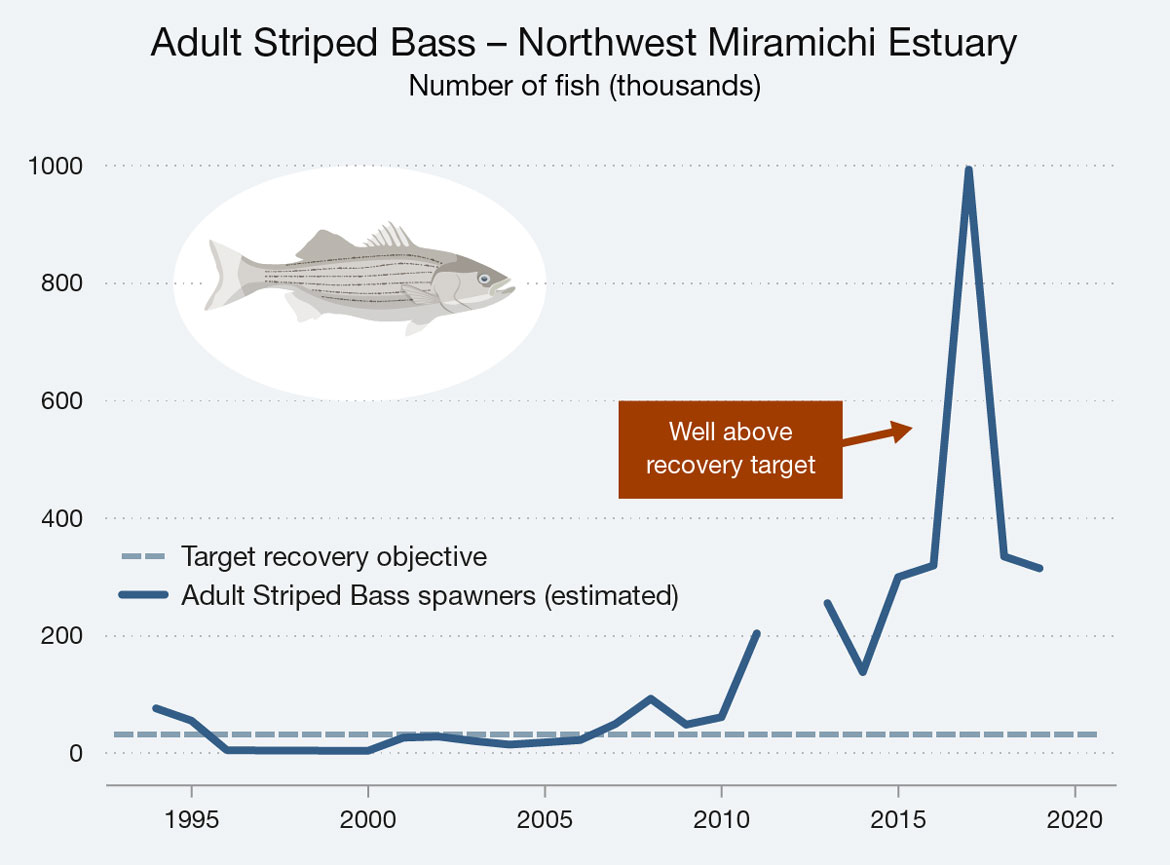
Estimated number of adult Striped Bass spawners in the northwest Miramichi estuary from 1994 to 2019. The dashed horizontal line shows the target recovery objective. No data were collected in 2012.
Text version
On the y-axis is the number of fish reported in thousands scaled from 0 to 1000. There are two lines on the graph. A greyish-blue dashed horizontal line represents the target recovery objective which is set at approximately 31 thousand. A blue line represents the estimated number of adult Striped Bass spawners. The blue line fluctuates near zero over time until it begins to increase around 2010. There is a gap in the data in 2012, but then it continues to increase to a large peak in 2017 when the number is near 1000. It then drops off the next year but remains higher (>300) than in earlier years. After 2015, fish numbers are well above the recovery target.
| Year | Number of Fish |
|---|---|
| 1994 | 76020 |
| 1995 | 55020 |
| 1996 | 5072 |
| 1997 | 4545 |
| 1998 | 4447 |
| 1999 | 4128 |
| 2000 | 4163 |
| 2001 | 26400 |
| 2002 | 28150 |
| 2003 | 20600 |
| 2004 | 14570 |
| 2005 | 18310 |
| 2006 | 22260 |
| 2007 | 49530 |
| 2008 | 92320 |
| 2009 | 48320 |
| 2010 | 61090 |
| 2011 | 203200 |
| 2012 | NA |
| 2013 | 254500 |
| 2014 | 137600 |
| 2015 | 298600 |
| 2016 | 318400 |
| 2017 | 990200 |
| 2018 | 333800 |
| 2019 | 313600 |
For many wild Atlantic Salmon stocks across Atlantic Canada, populations have not recovered. In parts of Cape Breton, populations have been stable, but populations in monitored rivers in the rest of Nova Scotia and New Brunswick were all very low in recent years. In the southern Gulf of St. Lawrence, the abundance of salmon decreased by 27% for large salmon and by 63% for small salmon from 2007 to 2019. In 2019, some populations in eastern and western Newfoundland and Labrador were stable or had increasing trends, but salmon returns to most monitored rivers were lower than for the previous generation.
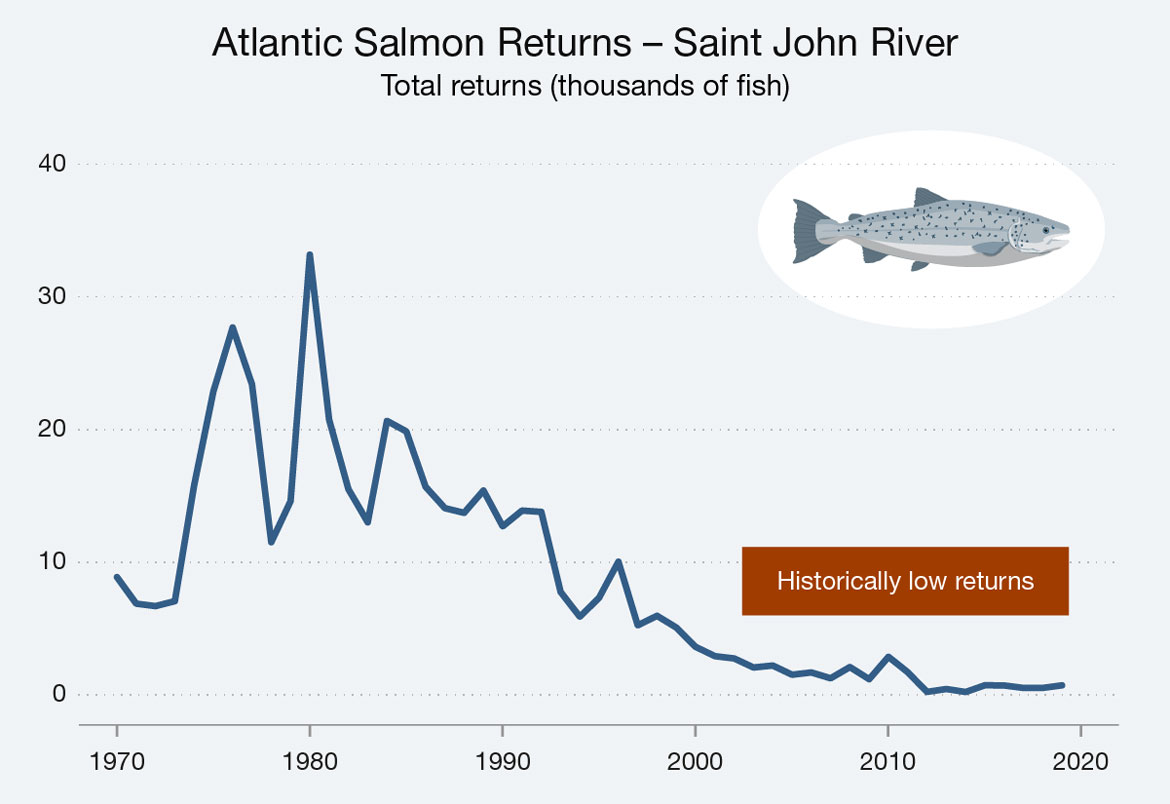
Returning adult Atlantic Salmon on the Saint John River above the Mactaquac Dam.
Text version
On the y-axis is the total returns reported in thousands of fish scaled from 0 to 40. The number of returns fluctuates over time but is generally higher in the 1970s to 1990s with a gradual decline starting around the mid-1980s to 2020. There are historically low returns in recent years.
| Year | Total Returns (number of fish) |
|---|---|
| 1970 | 8869 |
| 1971 | 6866 |
| 1972 | 6684 |
| 1973 | 7058 |
| 1974 | 15783 |
| 1975 | 22883 |
| 1976 | 27700 |
| 1977 | 23406 |
| 1978 | 11501 |
| 1979 | 14597 |
| 1980 | 33191 |
| 1981 | 20735 |
| 1982 | 15509 |
| 1983 | 13006 |
| 1984 | 20656 |
| 1985 | 19855 |
| 1986 | 15691 |
| 1987 | 14069 |
| 1988 | 13717 |
| 1989 | 15402 |
| 1990 | 12700 |
| 1991 | 13886 |
| 1992 | 13788 |
| 1993 | 7752 |
| 1994 | 5881 |
| 1995 | 7328 |
| 1996 | 10031 |
| 1997 | 5226 |
| 1998 | 5949 |
| 1999 | 5061 |
| 2000 | 3612 |
| 2001 | 2906 |
| 2002 | 2734 |
| 2003 | 2053 |
| 2004 | 2199 |
| 2005 | 1509 |
| 2006 | 1680 |
| 2007 | 1239 |
| 2008 | 2082 |
| 2009 | 1171 |
| 2010 | 2854 |
| 2011 | 1697 |
| 2012 | 213 |
| 2013 | 430 |
| 2014 | 204 |
| 2015 | 714 |
| 2016 | 698 |
| 2017 | 510 |
| 2018 | 514 |
| 2019 | 709 |

Life in the Atlantic: Sea turtles
All four sea turtle species that seasonally occur in Atlantic Canadian waters are at risk either in Canada or globally.
| Component | Status and/or trend |
|---|---|
| Leatherback Sea Turtle | Endangered (COSEWIC) |
| Declining northwest Atlantic subpopulation | |
| Loggerhead Sea Turtle | Endangered (COSEWIC) |
| Least Concern (IUCN) | |
| Increasing northwest Atlantic subpopulation | |
| Green Sea Turtle | Endangered globally (IUCN) |
| Kemp's Ridley Sea Turtle | Critically Endangered globally (IUCN) |
Sea turtles often have very large ranges and can migrate thousands of kilometres each year from tropical and subtropical areas, where they nest, to distant foraging areas, including Atlantic Canada. The most regularly observed species in Atlantic Canada is the Leatherback Sea Turtle, which is mostly present in the summer and fall, both coastally and offshore, feeding on gelatinous zooplankton, like jellyfish. Changes in ocean temperature may be influencing the prey species of all sea turtles and, consequently, where and when they occur in Atlantic Canada.
The Northwest Atlantic subpopulation of Leatherback Sea Turtles is at risk throughout its range and has been in decline since the 1990s. Loggerhead Sea Turtles also forage in Canada and are also at risk. Recent long-term studies have reported an increase in Northwest Atlantic Loggerhead Sea Turtle numbers over the past three generations as a result of long-term conservation efforts. However, there have been steep declines observed at monitored nesting beaches in Florida in the past.
Threats to sea turtles in Atlantic Canadian waters
The largest threat to sea turtles in Atlantic Canada is being incidentally hooked or entangled in fishing gear. Sea turtles also face threats from marine pollution like floating plastics, underwater noise, ghost fishing gear, and contaminants.
Life in the Atlantic: Seabirds
Populations of many seabird species have increased by more than 100% since 1970, but many others have declined by more than 50% over the same timespan.
| - | Species | Trends |
|---|---|---|
| Increasing | Razorbill | Large increase (462%) |
| Northern Gannet | Large increase (219%) | |
| Double-crested Cormorant | Large increase (157%) | |
| Atlantic Puffin | Large increase (118%) | |
| Common Tern | Moderate increase (81%) | |
| Common Murre | Moderate increase (67%) | |
| Decreasing | Great Black-backed Gull | Large decrease (-52%) |
| Herring Gull | Large decrease (-67%) | |
| Arctic Tern | Large decrease (-69%) | |
| Northern Fulmar | Large decrease (-78%) |
Canadian seabirds include species that nest in Canada and species that nest elsewhere but rely on our waters to feed. Most seabirds that nest or feed in Canadian waters are of global conservation concern. Several of the seabird nesting colonies found in Atlantic Canada are of national and international importance. Scientists have monitored 16 seabird species since the 1970s, but because these species live, feed, and nest in different ways, they have fared differently over the last 50 years. Currently, 62% of Canadian seabirds have unknown trends, as they nest outside Canada or in remote areas of the Arctic.
Razorbills, Atlantic Puffins, Double-crested Cormorants and Northern Gannets have increased by more than 100% since 1970. Increases in Razorbills and Atlantic Puffins may be due to fewer gillnets in inshore waters since the closure of the groundfish fishery in 1992, which were formerly responsible for high levels of seabird mortality. Since 2010, Northern Gannet populations have stabilized or started showing signs of decline due to lower numbers of small pelagic fish. In 2022, large numbers of Northern Gannets, along with Common Murres and Common Eiders, died from the highly pathogenic avian influenza virus infecting colonies throughout Atlantic Canada.
Species that feed at the sea surface—Herring Gulls, Great Black-backed Gulls, Arctic Terns, and Northern Fulmars—have declined by more than 50% since 1970 and by more than 25% since the early 1990s due to fewer prey fish, changes in oceanographic conditions, and fewer fish discards from the groundfish fishery. Leach's Storm-Petrels have also declined since the mid-1980s, including at the world's largest colony on Baccalieu Island, Newfoundland and Labrador. They face threats in their breeding area, including predation by large gulls and mammals, colliding or stranding at onshore and offshore industrial sites due to light attraction, and other threats while at sea, such as plastic pollution, and changes in ocean conditions because of climate change, in both Canadian and international waters.
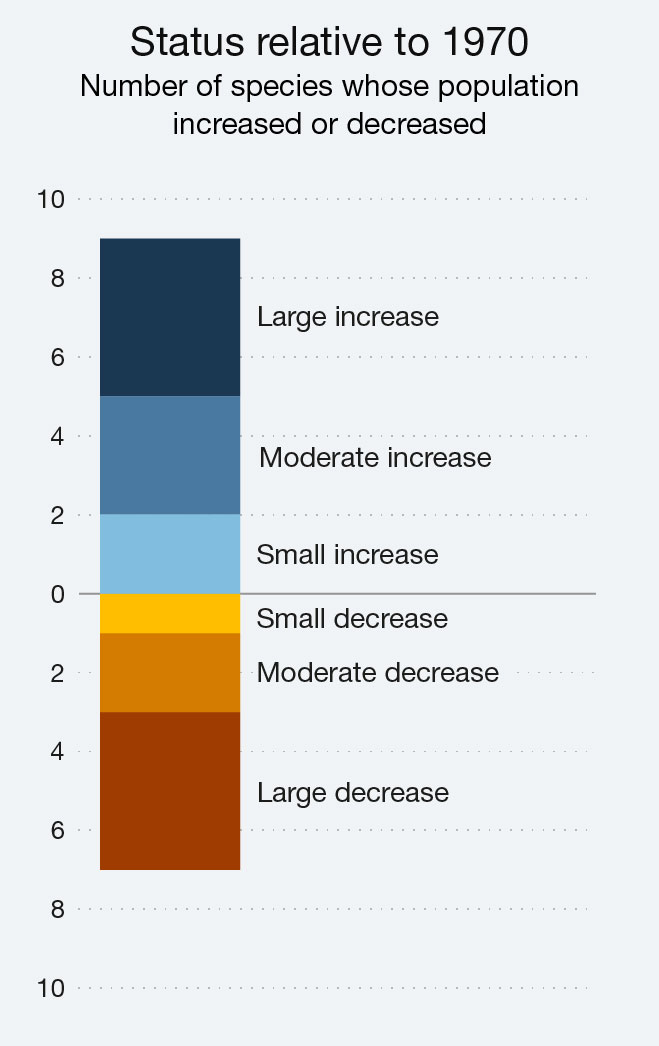
The number of seabird species that have experienced large (>100%), moderate (33–100%), or small (0–25%) increases or large (>50%), moderate (25–50%), or small (0–25%) decreases in population size in Atlantic Canada since 1970.
Text version
| Change in population size relative to 1970 | Number of species |
|---|---|
| Large increase (>100%) | 4 |
| Moderate increase (33 - 100%) | 3 |
| Small increase (0 - 33%) | 2 |
| Small decrease (0 - 25%) | 1 |
| Moderate decrease (25 – 50%) | 2 |
| Large Decrease (>50%) | 4 |
Spotlight: Seabirds switching to lower quality prey in the Bay of Fundy
Seabirds can be used as indicators of the general health of the ocean environment by looking at their overall health and diet. Seabirds on Machias Seal Island in the Bay of Fundy have shifted their diets to lower-quality prey to feed their young due to declines in Atlantic Herring stocks. Juvenile Sand Lance, euphausiid crustaceans, and other larval fish now make up the majority of their diet, which has led to lower breeding success and fewer birds returning to the colony over time. The decline in Atlantic Herring has also been linked to the lower survival of adult Atlantic Puffins throughout the Gulf of Maine.
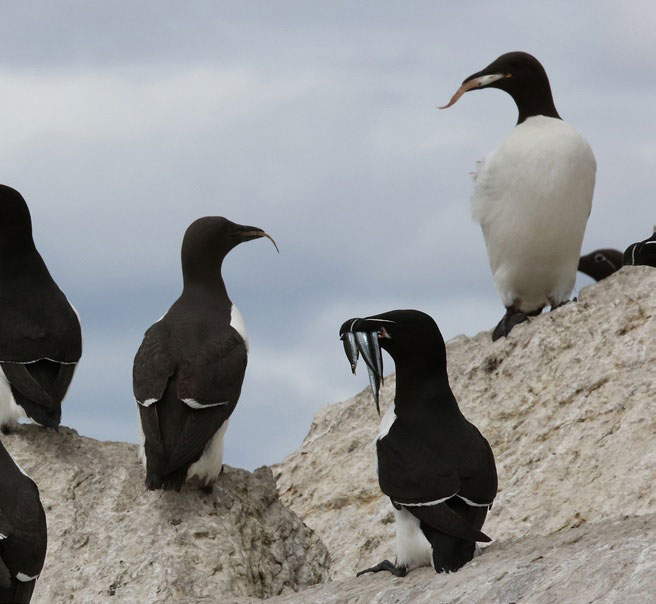
Forage fish are the primary source of food for many seabirds such as Razorbills and Thick-billed Murres. C. Petalas. ECCC.
Life in the Atlantic: Marine Mammals
Climate change has been impacting marine mammals directly through changes in their habitat and indirectly through changes in the abundance and distribution of their prey.
| - | Component | Status and/or trend | Bioregion |
|---|---|---|---|
| Cetaceans | Blue Whale | Stable or decreasing trend (2009) | - |
| Endangered (COSEWIC) | - | ||
| Humpback Whale | Increasing trend (2007) | - | |
| Sowerby's Beaked Whale | Special Concern (COSEWIC) | - | |
| North Atlantic Right Whale | Decreasing trend (2019) | - | |
| Endangered (COSEWIC) | - | ||
| Beluga Whale | Decreasing trend (2015) | GSL | |
| Bowhead Whale | Increasing trend (2013) | - | |
| Northern Bottlenose Whale | Increasing 2010–2019 (2019) | SS | |
| Endangered (COSEWIC) | SS | ||
| Pinnipeds | Grey Seal | Increasing trend but slowing (2021) | - |
| Harp Seal | Increasing trend (2017) | GSL, NLS | |
| Hooded Seal | Increasing (2005) | NLS | |
| Unknown (2005) | GSL |
Marine mammals throughout Atlantic Canada are important predators due to either large populations or large body size. Changes in their abundance, distribution, and diet can signal changes occurring in the ecosystem that may be more difficult to detect otherwise. However, acquiring up-to-date information on such wide-ranging species is challenging.
There are 28 marine mammals inhabiting the waters of Atlantic Canada. For cetaceans (whales, dolphins, and porpoises), estimates of population trends or abundance are available for only 8 of 21 species. For pinnipeds (seals and walrus), estimates are available for 3 of 7 species.
Whales
Recent efforts using multiple research methods (satellite tagging, passive acoustic monitoring, photographic identification, vessel and aerial surveys, spatial models) have identified important habitats for the Northern Bottlenose Whale and some large baleen whales—Blue, Minke, Fin, Humpback, and North Atlantic Right whales—and provided insight into their occurrence and foraging activities in Atlantic Canadian waters.
The overall population of North Atlantic Right Whales has continued to decline in recent years. The total estimated population was only 356 in 2019, and they are one of the most at risk of all large whales. North Atlantic Right Whales have also changed where they feed. The majority of North Atlantic Right Whales in Atlantic Canadian waters are now observed in the Gulf of St. Lawrence during the summer months. Another at-risk whale species—Northern Bottlenose Whales—increased to around 180 individuals on the Scotian Shelf in 2019, which reverses a long-term declining trend between 1990 and 2004.
Spotlight: Whales in a changing environment
Canada's Atlantic waters are undergoing a period of rapid change in circulation, temperature, acidity, sea ice cover, and relative sea level. These changes impact whales directly through changes in their habitats and indirectly through changes in the abundance or distribution of their prey. Some species may benefit from these changes and others may not. A warmer, more ice-free ocean with higher productivity could benefit Blue Whales, but warmer waters may reduce the relative abundance of prey in important whale foraging grounds, as with North Atlantic Right Whales.
Whales also face a variety of additional stressors and threats. Human-induced stressors that generate excess noise and create disturbances—shipping, oil and gas exploration, military activities, and tourism—can disrupt socializing, foraging, mating, or migratory behaviours. The overlap of whale habitat with vessels, whether for shipping, transportation, fishing, tourism, or recreation, creates an increased risk of mortality and injury from vessel strikes. Entanglement in fishing gear can also lead to serious injury and death for many whales, and this hinders the recovery of small or at-risk populations.

Seals
Population trends have also been recently updated for Harp Seals and Grey Seals. In 2017, the estimated number of Harp Seal pups born was the lowest since 1994, after 30 years of stability. Grey Seals have continued to increase in recent years—a continuation of an increase that started in the 1960s. However, the rate of increase is slowing. A survey in 2021 showed a decrease in the estimated number of Grey Seal pups born on Sable Island for the first time in 60 years. The Grey Seal breeding colony on Sable Island is the largest in the world and accounts for 78% of the total pup production in Canadian waters.
Spotlight: Shifting seals and sea ice
Seal species in Atlantic Canada are reacting differently to recent changes in ice conditions. Some Harp Seals may have shifted where they give birth, moving from the Gulf of St. Lawrence to the ice off southern Labrador and northeast Newfoundland. Declines in ice cover in the Gulf of St. Lawrence have also shifted where Grey Seals give birth in the Gulf, but there have been no negative long-term impacts. For Hooded Seals and Ringed Seals, the decline in stable ice is expected to have a negative impact on both the survival of pups and the abundance and distribution of their prey. In contrast, declining ice cover may benefit Harbour Seals, which do not depend on sea ice to breed, by opening up new habitat for them further north.
Human Impact on the Atlantic Ocean
Recent changes in temperature, sea ice, acidity, and oxygen in Atlantic Canadian waters have had wide-ranging consequences on the marine environment, pressuring species to adapt.
Warming of ocean waters at the bottom and at the surface has shifted ocean circulation, driving further changes in the amount of nutrients, phytoplankton, and zooplankton in Atlantic Canadian waters. Changes to nutrients and lower trophic levels ripple up the food chain, ultimately affecting the abundance and distribution of invertebrates, fish, seabirds, sea turtles, and marine mammals.
While Atlantic Canada has seen an increased productivity and biomass of American Lobster and redfish in recent years, other species, like kelp, Atlantic Salmon, Snow Crab, and Northern Shrimp, have declined in some areas. Even marine mammals are impacted by ocean warming—the Endangered North Atlantic Right Whales are facing new challenges finding their preferred prey, while changes in sea ice have shifted where Harp and Grey Seals give birth to their pups.
Other stressors also impact Atlantic marine ecosystems. Some invasive species have damaged or displaced kelp and Eelgrass, while others prey on young Atlantic Salmon. Commercial overharvesting of fish and invertebrate species has affected their abundance and distribution with cascading effects on the rest of the food web, from other fish species to marine mammals and seabirds. Fishing has also impacted sea turtles, pelagic sharks, whales, and seals which can either be caught as bycatch or become entangled in gear. Pollution of all types—noise, light, and chemical contaminants—have broad impacts on the habitats and species of the marine ecosystem.

Scientific research and monitoring that increase our knowledge of where, when, and how these stressors are occurring can help us understand, prevent, and mitigate their impacts. Management and conservation efforts based on this knowledge can contribute to the recovery of species at risk— Striped Bass, Porbeagle and White sharks, and Northern Bottlenose Whales have all shown recent signs of improvement. Together these efforts are helping to protect marine biodiversity in Canadian waters and to make more sustainable decisions for future ocean uses.
- Date modified: