
Canada’s Oceans Now: Pacific Ecosystems, 2021 - Sea surface temperature change
Description: Canada’s Oceans Now: Pacific Ecosystems, 2021 - Sea surface temperature change
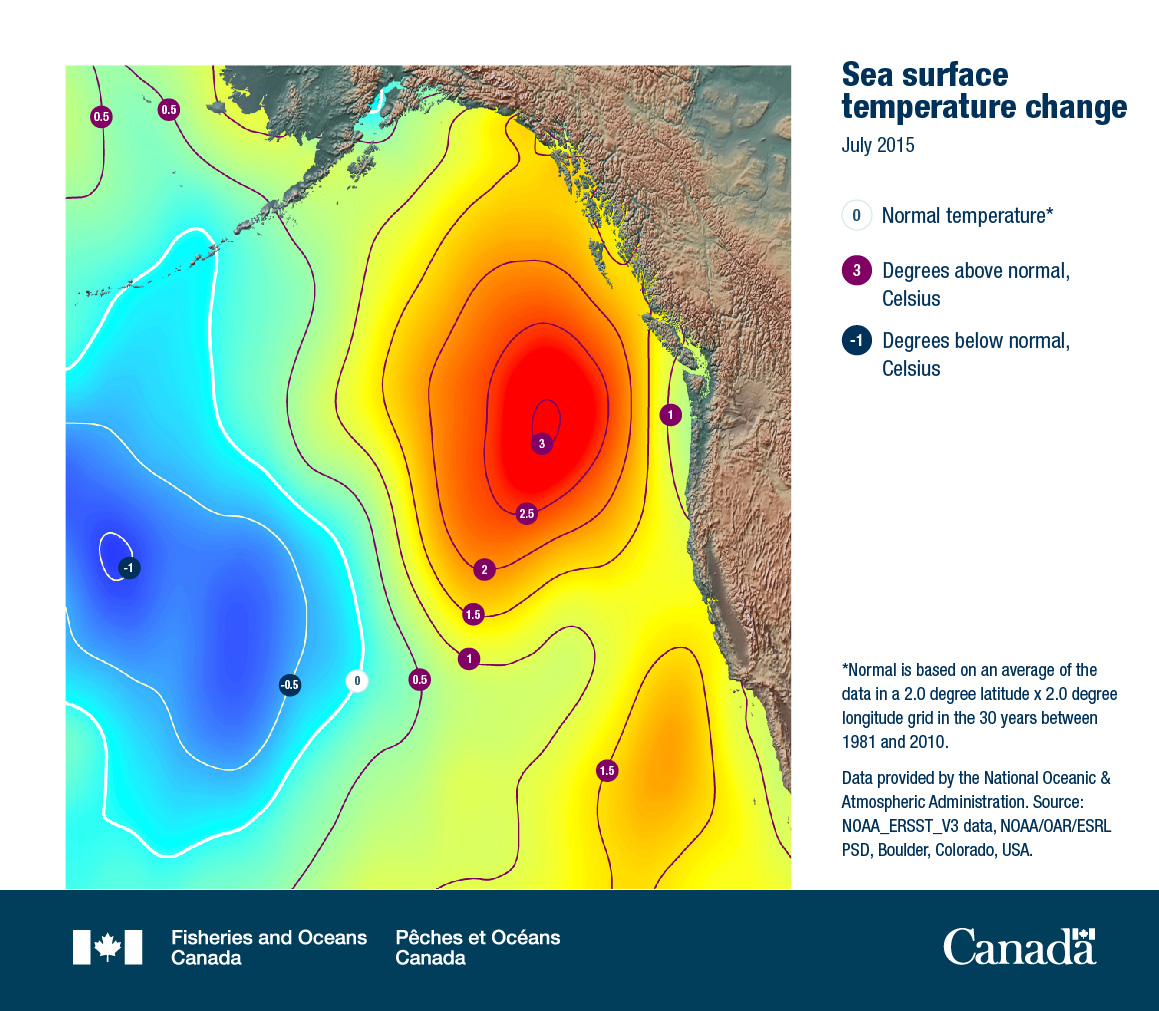
A heat map of the Pacific Ocean off North America shows sea surface temperature changes in July 2015. Ovals of colour indicate sea surface temperatures off the coast of British Columbia at this time. There is a red oval in Canada's Pacific Ocean which gradually turns orange, yellow and blue as it radiates out into the greater Pacific Ocean and south towards the US coast. Red colours indicate higher sea surface temperature, blue indicates cooler temperatures. Lines within and around the coloured ovals indicate the degree (Celsius) of sea surface change. The middle of the red oval is 3 degrees above normal. Numbers decrease as the red oval turns to yellow and then green and blue. The entire west coast of Canada's Pacific Ocean is deep red and orange. Far west in the open Pacific the ocean is blue and light green. The map shows evidence of “the blob” which was a massive ocean heat wave off the B.C. coast in 2015.
Sea surface temperature change
July 2015
- Normal temperatureFootnote *
- Degrees above normal, Celsius
- Degrees below normal, Celsius
Data provided by the National Oceanic & Atmospheric Administration. Source: SOAA_ERSST_V3 data, NOAA/OAR/ESRL PSD, Boulder, Colorado, USA
Related links
- Date modified: