
Final evaluation report
Evaluation of Science Funding
Final Report
Project Number 96139
March 4, 2019
NOTE: The Evaluation of Science Funding has an alternative report format that uses graphics and visuals, and which is available in PDF format PDF version.
Table of Contents
- 1.0 Purpose of the Evaluation
- 2.0 Profile and Context
- 3.0 Evaluation Approach and Scope
- 4.0 Evaluation Methodology
- 5.0 Evaluation Findings
- 5.1 Efficiency of the research funding cycle
- 5.2 How to improve efficiency
- 5.3 Alternative approaches
- 5.4 Availability of research to end-users
- 5.5 Engagement of end-users
- 5.6 Level of effort associated with funding allocation processes
- 5.7 The success rate of applicants based on sex
- 5.8 Gender-related barriers to accessing the funding programs
- 5.9 Other barriers to accessing the funding programs
- 5.10 Communication barriers
- 5.11 Best practices that support equity and diversity
- 6.0 Conclusions and Recommendations
- 7.0 Management Action Plan
- ANNEX 1 - Sampling Strategy for the Gender-Based Analysis Plus
- ANNEX 2 – Methodology: Value of Researcher’s time
1.0 Purpose of the Evaluation
The evaluation assessed the efficiency of 16 O&M science funding programs, and whether the application, selection and/or administration processes support equity and diversity.
1.1 Overview
This report presents the results of the Evaluation of Science Funding. The 16 funding programs (see Table 1) assessed in the evaluation are managed in the Ecosystems and Oceans Science Sector (EOS).
The evaluation was conducted in accordance with the Treasury Board’s Policy on Results (2016), which requires departments to measure and evaluate performance and use the resulting information to manage and improve programs, policies and services.
Fisheries and Oceans Canada’s (DFO’s) Evaluation Division conducted the evaluation between April 2018 and January 2019, as per DFO’s Departmental Evaluation Plan.
| Ecosystem Science | Arctic Science Program (AS) |
|---|---|
| Ecosystem Stressors Program (ES) | |
| Strategic Program for Ecosystem-based Research and Advice (SPERA) | |
| Fisheries Science Collaborative Program (FSCP) | |
| International Governance Strategy Science Program (IGS) | |
| Fisheries Science and Ecosystem Research Program (FSERP) | |
| National Monitoring Fund Program (NMF) | |
| Aquatic Invasive Species Program (AIS) | |
| Aquatic Climate Change Adaptation Services Program (ACCASP) | |
| Center of Expertise in Marine Mammalogy Program (CEMAM) | |
| Strategic and Regulatory Science | Program for Aquaculture Regulatory Research Program (PARR) |
| Aquaculture Collaborative Research and Development Program (ACRDP) | |
| Genomics Research and Development Initiative Program (GRDI) | |
| Centre for Aquatic Animal Health Research and Diagnostics Program (CAAHRD) | |
| Aquaculture Ecosystem Interactions Program (AEIP) | |
| Canadian Regulatory Science for Biotechnology Program (CRSB) |
2.0 Profile and Context
The programs included in the evaluation fund a variety of research and support a mixture of Ecosystem Science and Strategic and Regulatory Science objectives. The funds exist alongside other EOS research programs, however, unlike the core science programs, the budgets for these 16 funding programs are distributed through a variety of competitive, targeted competitive or directed solicitation processes aimed at principal investigators and their project teams.
The research produced contributes to DFO’s core responsibilities for Fisheries and Aquatic Ecosystems. The research programs also support the priorities of various end-users both internal and external to the department. For example, internal DFO clients include the aquaculture management, ecosystems management, oceans management and fisheries resource management programs. External clients include the Canadian Food Inspection Agency, Health Canada and Environment and Climate Change Canada. The Canadian Food Inspection Agency, as an example, is the primary client of research conducted under the Centre for Aquatic Animal Health Research and Diagnostics Program.
Fifteen of the 16 programs are accessible only to DFO employees with the majority of applicants being research scientists and biologists. Staff from physical sciences, chemistry, veterinary medicine and scientific support can also apply. The only program where the funds are accessed externally is the Fisheries Science Collaborative Program. This program is collaborative between the Atlantic fishing industry and DFO scientists. Industry collects the data while DFO uses it to enhance core stock assessment activities.
Funding programs are managed by national fund managers located in national headquarters in collaboration with regional fund coordinators, using procedures and processes that are developed and agreed to collectively.
The funding programs can be grouped into three types of solicitation processes as follows:
- Competitive: an open call available to all eligible scientists
- Arctic Science Program
- Strategic Program for Ecosystem-based Research and Advice
- International Governance Strategy Science Program
- Aquatic Climate Change Adaptation Services Program
- Ecosystem Stressors Program
- Aquaculture Collaborative Research and Development Program
- Genomics Research and Development Initiative Program
- Targeted Competitive: a competitive call distributed to a targeted group of scientists
- Aquatic Invasive Species Program
- Center of Expertise in Marine Mammalogy Program
- Centre for Aquatic Animal Health Research and Diagnostics Program
- National Monitoring Fund Program
- Fisheries Science Collaborative Program
- Directed: a specific group of scientists is approached to submit proposals
- Fisheries Science and Ecosystem Research Program
- Program for Aquaculture Regulatory Research Program
- Aquaculture Ecosystem Interactions Program
- Canadian Regulatory Science for Biotechnology Program
2.1 Financial Profile
Total actual estimated O&M expenditures for all 16 funding programs are shown below in Figure 1. The overall value of the O&M funding available to support the 16 research programs has increased over the last five years. The more recent investments have benefited the funding programs under the Ecosystem Science Directorate. The increase can be explained by the creation of new funding programs as part of Budget 2016 (e.g. Arctic Science, Ecosystem Stressors).
Figure 1:Total actual/estimated O&M expenditures for all 16 funding programs (Fiscal year 2013-14 to 2017-18)
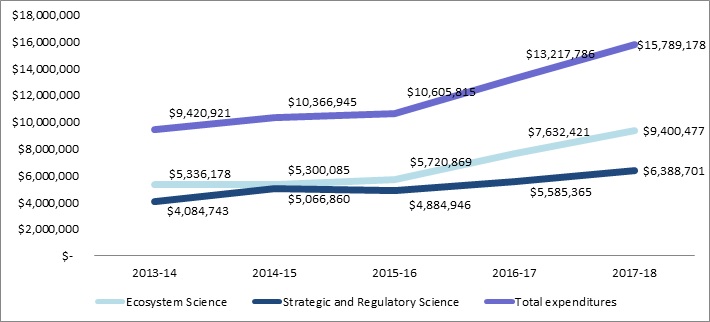
Description
Figure 1 shows the total actual/estimated O&M expenditures in dollars for all 16 funding programs for fiscal years 2013-14 to 2017-18. For the Ecosystem Science Directorate it was $5,336,178 in 2013-14; $5,300,085 in 2014-15; $5,720,869 in 2015-16; $7,632,421 in 2016-17; and $9,400,477 in 2017-18. For the Strategic and Regulatory Science Directorate it was $4,084,743 in 2013-14; $5,066,860 in 2014-15; $4,884,946 in 2015-16; $5,585,365 in 2016-17; and $6,388,701in 2017-18. Totals for the Ecosystem and Oceans Science Sector were $9,420,921 in 2013-14; $10,366,945 in 2014-15; $10,605,815 in 2015-16; $13,217,786 in 2016-17; and $15,789,178 in 2017-18
The evaluation encountered a limitation regarding the tracking of actual expenditures. More specifically, there are regional differences in the manners with which expenditures are coded. For example, specific funding dedicated for research activities was rolled up into the general regional science O&M envelope for some programs. Estimates or revised actual expenditure figures provided by regions were used when significant coding errors were suspected.
3.0 Evaluation Approach and Scope
The approach and scope for the evaluation were established during a planning phase, which included consultation with EOS and client representatives.
3.1 Scope
The evaluation examined 16 internal research programs where DFO scientists apply for O&M funds to conduct research. This did not include any of the core science research conducted by EOS nor any of EOS’ other research programs financed through either capital budgets or grants and contributions budgets.
The efficiency of the 16 funding programs was assessed in order to identify possible improvements. Gender-Based Analysis Plus (GBA+) was used to examine whether there are any groups that are under-represented across these programs, paying particular attention to the number of female scientists applying for and/or receiving funding. Additional identity factors (e.g. official language) were also explored to see if there were any related barriers or challenges for certain groups of scientists.
3.2 Evaluation Questions
Data was gathered and analysed to answer the following questions:
- To what extent are the various stages of the O&M research funding cycle efficient (e.g. priority setting, proposals, review and approvals, delivery of research outputs)?
- Are there alternative approaches that would be more efficient at funding the research?
- To what extent is the research available to end-users?
- To what extent are EOS structures (e.g. governance, decision-making structures, planning) appropriate to support program efficiencies?
- Are the application and approval processes for the O&M research funding programs equitable to all potential applicants?
4.0 Evaluation Methodology
The evaluation used multiple lines of evidence, both qualitative and quantitative:
Interviews: Scoping and key informant interviews were conducted with 46 individuals representing DFO senior management, program staff in national headquarters as well as all DFO regions, and internal and external clients of the programs.
Process mapping: The interviews held with national program managers were used to gain an in-depth understanding of how each program is structured, administered and delivered nationally and across the regions. Information gathered was used to populate a standardised template and create a process map for each program identifying the steps followed to administer the program and to document how priorities are set, proposals are solicited, and applications are reviewed, recommended and approved. Both the templates and the process maps were validated with the managers following the interviews, and helped in the assessment of best practices and where efficiencies and inefficiencies existed.
Document review: Program documents (e.g. tools and templates, application guides, calls for proposals, steering committee minutes) were reviewed to examine good practices and consistency across the 16 programs. The document review also included an examination of practices in other government departments, previous studies, reviews, evaluations and audits. The "Review of DFO Science Competitive Funding Process" recently completed in the regions was a key document that was leveraged to inform the evaluation as well as to structure data collection so as not to duplicate regional efforts.
Administrative data analysis:
Gender-Based Analysis Plus: Human resources data was obtained and manipulated to create a database that would allow the evaluation team to match successful applicants (principal investigators) with their self-identified biological sex so as to assess the success rate of female scientists. Further details on the Gender-Based Analysis Plus sampling strategy can be found in Annex 1.
Review of Deliverables: Lists of funded projects were requested and used to create a random sample of completed projects. The sample of 34 projects from a possible 251 (14% sample size) was used to assess whether research was completed as originally planned and whether it was produced according to the intended schedule.
Literature review: A review of relevant documents and websites was completed in order to identify the most feasible and relevant approach for conducting the GBA+ for the evaluation. The review also served to identify comparable processes and best practices to address GBA+ related barriers in application, solicitation and review processes.
Surveys:
Applicants Survey – This survey was sent to researchers in the following job classification groups: SERES, SEREM, BI, PC, CH, VM, EG[1]. Respondents were asked to assess the efficiency of the current funding allocation model and to identify potential solutions to address known inefficiencies. The survey built on the results of the “Review of DFO Science Competitive Funding Process” (May 2018) to ensure synergies between the evaluation and this internal process. Ecosystem and Oceans Science researchers were also asked to identify potential barriers to accessing funds based on various identity factors. There was a response rate of 29%, with 310 out of the possible 1073 people responding. A third of the respondents were SERES (n=104) and almost half were BI (n=140).
Review Committee Survey – All internal DFO reviewers who are sitting on committees received the survey. They were asked the same questions as those included in the survey of applicants, with some additional questions specific to the review process. There was a response rate of 55%, with 60 out of the possible 109 people responding.
End-users Survey – The survey was distributed to 736 DFO program contacts for the Evaluation of the Canadian Science Advisory Secretariat. Four questions related to the science funding programs were included in the survey; 149 people responded to the questions representing a response rate of 20%. DFO end-users were asked to provide feedback on the extent to which the funded projects aligned with their priorities and needs. They were also asked to provide their level of satisfaction with the way in which they are consulted in the priority-setting process and in which results are communicated to them.
Financial Profile and Level of Effort Analysis: Financial data and the survey results were analyzed together in order to estimate the level of effort associated with the allocation/management of funds for fiscal year 2017-18. In the applicant survey, respondents were asked to estimate the total number of working days spent contributing to priorities, developing proposals, reviewing proposals, providing status updates on research and writing final reports. The estimates of working days were combined with salary costs (2017-18 dollars) to estimate value of efforts in researcher salary dollars.
4.1 Gender-Based Analysis Plus
On the request of the ADM Ecosystem and Oceans Science, and as per the Treasury Board Directive on Results (2016), the evaluation included an analysis of Gender-Based Analysis Plus (GBA+) factors.
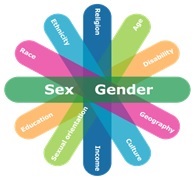
Description
This picture represents Gender-Based Analysis Plus which is a process which considers how diverse groups of Canadians are affected by the policies, programs and initiatives of the federal government. The picture shows that the following identity factors intersect with sex and gender: religion, ethnicity, race, education, sexual orientation, income, culture, geography, disability and age.
What is GBA+?
GBA+ is an analytical tool, process, or product used to assess the potential impacts of policies, programs, services, and other initiatives on diverse groups of women and men, taking into account gender and other identity factors.
Biological sex and gender serve as the entry point to analysis. The “+" in the name highlights that gender-based analysis goes beyond sex and gender, and includes the examination of a range of other intersecting identity factors (such as age, education, language, geography, culture, and income).
How did the Evaluation of Science Funding conduct GBA+?
- Used administrative data, disaggregated by biological sex (i.e. female and male), to calculate the success rate of applicants for a sample of funding programs.
- Used interviews and the surveys of applicants and of review committee members to examine whether any identity factors (e.g. gender, career status, language) led applicants to experience barriers or challenges to their participation in the funding programs.
- Collected opinions, through interviews and surveys, regarding the extent to which all eligible applicants have access to O&M research funding.
- Compared EOS processes to best practices identified in the literature and used by other government departments who administer research funding, such as the Natural Sciences and Engineering Research Council.
4.2 Limitations and mitigation strategies
To mitigate limitations as much as possible, data from multiple lines of evidence were triangulated. This approach was taken in order to demonstrate the reliability and validity of the findings and to ensure that conclusions and recommendations were based on objective and documented evidence. Other mitigation strategies are described in the table below and, as relevant, at various other points in this report.
| Limitation | Mitigation |
| Complexity of programs - The evaluation team faced challenges with the scope of this evaluation due to the variety and complexity of the individual contexts for each of the 16 programs. For example, they range in value from $250K to over $2 million. Some have been in existence for 20 years and others for only two years. Each program focuses on unique priorities, and is meant to meet the needs of a unique group of end-users, most of which are internal to DFO but some of whom are external. Moreover, these programs use a mixture of competitive and directed approaches to solicit proposals. The 16 programs also exist in a larger science universe with other types of research programs which were not the focus this evaluation, such as core, capital and G&Cs funding. | To mitigate the challenges related to overall complexity, sampling strategies were developed for various evaluation methods including the GBA+, financial analysis, and the review of project deliverables. When results were generalized, limitations with regards to the sample used were clearly outlined in the report. |
| Data availability for Gender-Based Analysis Plus - For the Gender-Based Analysis Plus, the only identity factors with available data were biological sex and first official language. Information related to other identity factors such as gender, age and Aboriginal status was not available as it was not recorded in the application process for any of the funding programs nor is it currently made available as part of any EOS or DFO statistics on employee demographics. | To examine a broader range of identity factors, the evaluation team asked questions in interviews and both surveys about barriers related to gender, age, official language, ethnicity, and geographic location. |
| Determining eligible applicants - It was challenging to clearly define which EOS employees were eligible applicants to each of the 16 funding programs. This created an issue in terms of developing the list of survey participants. As a result, it was difficult to determine with a strong level of confidence the extent to which the sample represented the target population for the survey of applicants. This challenge was not experienced as part of the survey of reviewers since all internal DFO reviewers were surveyed. | To alleviate this challenge, the evaluation team used the list of all EOS employees as of May 2018 and administered the survey of applicants to seven job classifications* that were deemed to have the potential to apply to these funds. Filter questions were added to exclude participants who had not accessed any of the funds over the last five years. * Members of the EG classification group working in hydrographic services were not eligible for the programs and were excluded from the survey population. |
| Lack of policy to judge GBA+ findings - In the absence of a formal equity and diversity framework or policy related to the funding allocation processes, the evaluation team was not able to provide a judgment on the results stemming from the Gender-Based Analysis Plus. | The evaluation provides the results of the GBA+ without providing any judgment on what has been observed. The meaning and impacts of these results will be determined during the presentations to EOS Senior Management. |
| No comparable funding model The evaluation team was not able to find another federal agency or department that uses a similar internal funding allocation model for research. This limited the extent to which we could compare all aspects of EOS practices for the delivery and administration of its funding programs. |
The evaluation relied on literature, including relevant practices for administering grants and contributions, and on the practices of the Natural Research and Engineering Research Council, which allocates external research funding, as a comparable department. |
5.0 Evaluation Findings
5.1 Efficiency of the research funding cycle
Finding: There is clear evidence of good practices existing within each of the funding programs. However, collectively the programs are not implemented in a standardized or consistent manner leading to overall inefficiencies.
Efficiency was defined in the surveys as being achieved by coordinating and streamlining funding allocation processes and by managing the level of effort in relation to achieving desired goals (e.g. quality proposals, reviews and research). Further efficiencies are gained by avoiding duplication at any stage of the funding allocation or review processes.
All 16 programs are using some good practices to administer their funds, many of which are employed to create efficiencies. However, practices are not consistent across the programs. Below are examples of good practices in use at different stages.[2]
Administration of Programs
- Most programs (n=14) allow for multi-year funding, cited in literature as a practice that brings efficiency to the allocation of funds.
- Many (n=9) have Terms of Reference making roles and responsibilities clear for the program and/or for the operation of oversight and review committees.
Call for Proposals
- Many calls (n=11) provide templates for the proposal writing.
- Close to half of the programs use a letter of intent, which helps avoid the review of full proposals by filtering out ones that may not be relevant or eligible.
- A few programs (n=3) run their call for proposals with other programs (and their review process as well) cutting down on the duplication of administration.
Applications
- Many applications (n=10) have a maximum length of between 2 to 8 pages.
- Many proposals (n=9) must identify the specific priority being addressed.
- Only a few must identify the intended end-user of the research
Review of Proposals
- Two thirds of the programs have rating criteria related to external leveraging provided in the project.
- A few (n=4) have clients involved in the review.
Reporting
- Some have interim or progress reporting requirements.
5.2 How to improve efficiency
Respondents to the surveys of applicants and review committee members were asked to rank the top three activities that would help improve the efficiency of various aspects of the funding allocation process. The evaluation leveraged the recently completed Regional Review of Competitive Programs (DFO, 2018) by asking survey respondents to rank ideas that were a direct result of the review.
The top three ranked activities which would most improve the efficiency of the application process (n=261) were:
68% said “Create a common calendar for call for proposals and review committee shared across each of the funding programs.”
65% said “Develop standardized application tools and templates across the O&M funding programs.
43% said “Integrate funding envelopes.
As ranked by respondents to the survey of review committee members only, the top three activities which would most improve the efficiency of the review process (n=52)[3] were:
75% said “Develop consistent approach to review proposals across the funding programs for the committees.”
56% said “Develop standardized scoring approach used by regional and national review committees.”
40% said “Incorporate additional scientific/technical experts as part of a technical review process.”
The top three ranked activities which would most improve the efficiency of the communication process (n=254) were:
74% said “Create an annual call for research proposals that is circulated to all DFO science staff.”
69% said “Develop a template for fund information, including information on the processes, fund description, overall objectives/goals.”
47% said “Develop a consistent approach across the funding programs to notify both successful and unsuccessful applicants.”
The top three ranked activities which would most improve the efficiency of the oversight and administration (n=251) were:
71% said “Establish clearer criteria for the type of funding approach being used to distribute the O&M research budgets (e.g. competitive versus directed).”
63% said “Develop a mechanism to rank the priorities across programs.
57% said “Streamline the separate processes currently used for setting funding priorities.
Other activities that would improve the efficiency (n=261) were:
40% said Develop linkages (where possible) with other EOS priority-setting exercises.”
39% said “Establish joint calls for proposals.”
36% said “Provide mentoring or additional assistance to help staff navigate the application process.”
Despite the assumption that there is a wide-spread practice of applicants submitting the same proposal to multiple programs, only 15 percent (n=28) of applicants surveyed indicated doing so.
5.3 Alternative approaches
Finding: There are opportunities for EOS to increase efficiencies in the funding programs. Efficiencies could be achieved through improved coordination and overarching oversight and strategic planning.
The evaluation was not able to identify a comparable federal department that uses a similar model to the EOS sector for funding internal research, however many key informants supportboth competitive and directed funding models. Eligible applicants, however, want more communication about the rationale for when the different models are used.
We asked program representatives (n=16) if the existing EOS’ structure provides the direction, support and oversight needed for the efficient operation of the funding programs.
- Sixty-four percent of respondents commented that they work in silos and more coordination and oversight are needed.
- Some interviewees (n=5) said they need a mechanism for collective discussion to share information, lessons learned and best practices. Some interviewees suggested a community of practice could support these objectives.
Although individual programs have priority setting exercises, and some have oversight committees, there is no overarching science strategy or plan guiding EOS’ research activities over the short, medium and long term. A few interviewees reported this creates challenges when it comes to supporting clients’ priorities, especially as they pertain to medium and long term or emerging research issues.
The Natural Sciences and Engineering Research Council of Canada (NSERC), that allocates science funding to external individuals and organizations, has recently made efforts to increase efficiency:
- NSERC is developing an overarching research plan with a mechanism to collect emerging and long-term priorities.
- NSERC is reducing the number of separate programs and aligning research under themes or priorities.
Figure 2 below represents elements of the approach used at NSERC to manage the research programs they administer.
Figure 2 – Natural Sciences and Engineering Research Council programs practices
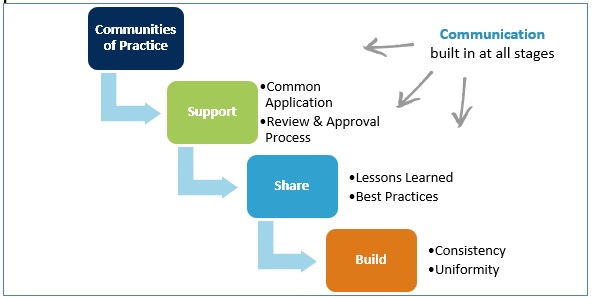
Description
Figure 2 shows the four elements of NSERC’s approach as: Communities of practice, support, share and build. There is support for a common application as well as for the review and application processes. Lessons learned and best practices are shared. They are building consistency and uniformity into their processes. Communication is built in at all stages
5.4 Availability of research to end-users
Finding: For a sample of projects analysed, the majority of the research deliverables were completed or in progress. Completion rates are higher for more recent end dates.
Results of the review of project deliverables
- Thirty-four projects from eight of the funding programs were reviewed; they were reported to be complete as early as 2013-14 and as late as 2017-18.
- A review of the 34 approved proposals indicated that 198 deliverables were committed to across the projects. At the time of review, an average of 63% (n=125) of the deliverables were reported to be complete. Twenty-four percent (n=48) were in progress (Figure 3).
- The highest completion rate for a program was 84% and the lowest completion rate was 47%.
Figure 3 – Status of deliverables for funded projects
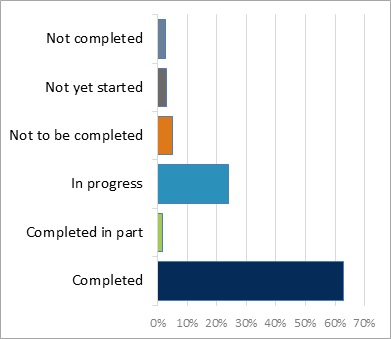
Description
Figure 3 shows the status of deliverables for the 34 funded projects: Of 198 deliverables, 63% were completed, 24% were in progress, 5% were not to be completed, 3% were not yet started, 2.5 % were not completed, 2% were completed in part
Year project completed |
% deliverables completed |
|---|---|
| 2014 | 100% (n=2 of 2) |
| 2015 | 57% (n=28 of 49) |
| 2016 | 59% (n=26 of 44) |
| 2017 | 67% ( n=46 of 69) |
| 2018 | 68% (n=23 of 34) |
| TOTAL | 63% average |
Seventeen of the 34 projects (50%) delivered all of the final outputs (e.g. Canadian Science Advisory Secretariat (CSAS) report, final report, scientific publication, presentation or transfer of knowledge to a stakeholder) that were committed to in the proposal. Many of the reasons given for delays were unanticipated: Weather or equipment issues, delayed staffing processes; delays in obtaining necessary permits; Shared Services Canada delays; changes in sampling procedure.
Finding: Clients expressed low levels of satisfaction related to how they are consulted in priority-setting exercises and how results are communicated to them.
We surveyed internal end-users of the science produced through the 16 funding programs. There were 149 respondents to the survey from ten DFO program areas (Figure 4).
Figure 4 – Respondents to the end-user survey by DFO program area
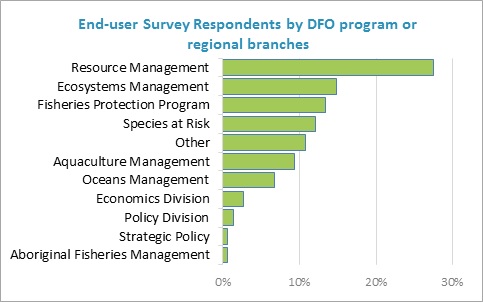
Description
Figure 4 shows the percent of respondents from each of the following DFO program areas: 28% were from resource management; 15% were from ecosystems management; 13% were from fisheries management; 12% were from species at risk; 9% were from aquaculture management; 7% were from oceans management; 3% were from the economics division; 1% were from the policy division; 1% were from strategic policy; 1% were from aboriginal fisheries management; 11% were from other program areas
The survey yielded the following results:
48% are not satisfied/partly satisfied with the degree to which they are consulted in the priority setting exercises directing science research topics within DFO compared to 6% who are more than/very satisfied.
43% are not satisfied /partly satisfied with the way in which research results are communicated to them compared to 11% who are more than/very satisfied.
64% do not know whether research is completed as planned; 49% do not know if it is meeting their needs in terms of providing science to inform decision-making. 57% do not know if research is produced according to schedule.
We need better communication of how management objectives are translated into specific research projects. Priorities of all branches need to be taken into account and current commitments of government.
5.5 Engagement of end-users
Finding: End-users are most involved in priority-setting exercises; however, they report that their priorities are not reflected in what is funded or what is communicated to them. There are opportunities for EOS to further engage with end-users at other stages in the funding cycle.
Figure 5 shows the different stages of the funding cycle for the 16 programs. Many clients are asked to contribute to the priority-setting exercises. However, many clients that were interviewed or surveyed reported that even when they are involved in the priority-setting, they don’t see their priorities in funded projects. More engagement when proposals are reviewed and approved could help address this issue. A few programs (n=4) involve clients in the review process.
Figure 5 – EOS Funding Cycle
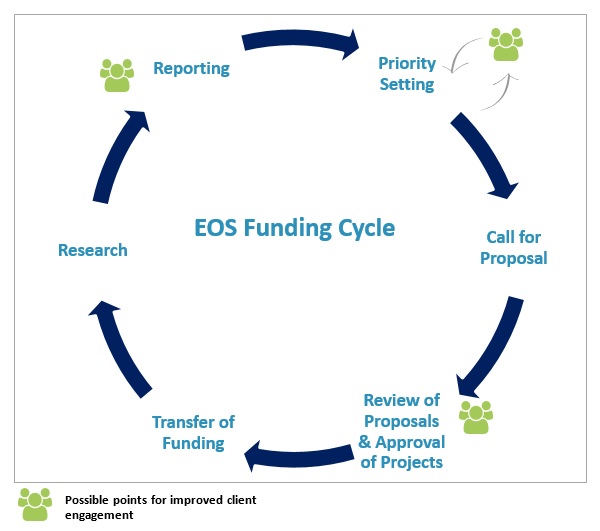
Description
This figure is a diagram of the Ecosystem and Oceans Science funding cycle. The process flows through the following stages: priority-setting, call for proposals, the review of proposals and approval of projects, the transfer of funding, research, and finally reporting. This figure also shows that there are opportunities to improve client engagement when setting priorities, reviewing proposals and approving projects, and at the reporting stage.
Many end-users consulted are not satisfied with the communication of results and some said they often do not get results back. Document review and process mapping showed that how research is communicated varies greatly from one program to the next.
Some programs use best practices for communicating results such as websites, post-research workshops and factsheets translating complex findings into layperson language.
5.6 Level of effort associated with funding allocation processes
Finding: Researchers (BI, SE-RES, PC)* who participated in the applicant survey reported that in 2017-18, they dedicated a total of 4,374 days to administration, developing proposals and to reporting for the funding programs. In terms of researcher salaries, this represents a value that is estimated to range between $1.4M and $1.9M.
The evaluation tried to measure the value of time invested by applicants in the funding allocation process.
One hundred and seventy-three respondents to the applicants survey reported a total of 4,374 days in 2017-18 dedicated to administration, developing proposals and reporting for the funding programs.
Researchers reported dedicating the following number of working days to the funding allocation process in 2017-18:
- Biologists (BI) reported an average of 18 working days (or a little less than 4 weeks);
- Research scientists (SE-RES) reported an average of 29 working days (or approximately 6 weeks); and,
- Physical scientists (PC) reported a median of 32 days working days (or a little more than 6 weeks).
Value of researcher’s time measured in salary dollars
When the total number of days reported by survey participants is converted to salary dollars, the value of researchers’ time is estimated to range between $1.4M to $1.9M.
This means that for the 2017-18 fiscal year, where the expenditures amount to $15.8M, the level of effort measured in researcher salary dollars ranged between 0.14 cents to 0.18 cents in researcher salary dollars to allocate/manage one O&M dollar.
Note: These numbers are based on a survey sample and do not reflect the whole EOS research workforce. Annex 2 explains the detailed methodology used to estimate this value.
Finding: The evidence suggests that when all efforts and inefficiencies are considered, the current funding model appears to present significant opportunities for improvement.
Other levels of effort to consider
Respondents to the survey of review committee members (n=53), on average, reported a total of 10 working days in 2017-18 for a total of 518 days in 2017-18 dedicated to assessing letters of intent, applications or other aspects of the funding programs. It is assumed that most of the survey participants are either directors, managers or senior scientists suggesting additional significant value in terms of salary investments.
Limitations of the survey of review committee members results include:
- Participants were not asked to report their classification and level as part of the survey.
- One outlier who reported a total of “260” days was removed from the analysis.
- A total of 15 respondents reported “0” working days, which raises an issue about either the clarity of the question or whether these individuals should have been filtered out of the survey.
There were other efforts associated with the allocation of funds identified as part of the evaluation:
- Coordination efforts and review processes also occur at the regional level:Evidence shows that some regions use their own review process before proposals are shared with the national committees. We asked members of review committees if they conduct a review of letters of intent or a review of applications prior to submitting them to the national process: 76% of respondents indicated “yes”.
- Financial transactions: 43% of successful applicants are negatively impacted by the timing for the release of funds.
- Conversion of O&M: Qualitative comments in the applicant survey also provided anecdotal evidence that the conversion of O&M dollars to salary dollars is creating inefficiencies (i.e., cost of benefits). It was not possible to assess the scale of this phenomenon and, thus its impacts on the efficiency of the program.
5.7 The success rate of applicants based on sex
Finding: Although more males applied to the funding programs, the proportion of women that applied and the proportion that were successful are equal. For the sample reviewed, male applicants received more money than female applicants.
The evaluation analysed a sample of funded and unfunded research proposals.The proportion of women applicants was lower than the general female population for the overall EOS sector which is 49%.
How many male and female scientists applied for funding?
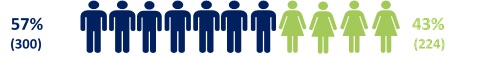
Description
This pictogram shows that 57%(n=300) of the applicants were male and 43% (n=224) were female
Male and female scientists applied for and were approved for funding in the same proportions
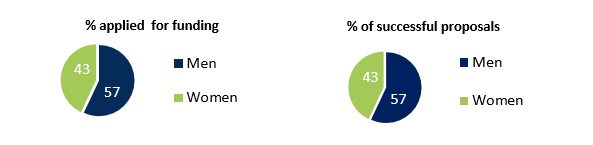
Description
These pie charts shows that 57% of the applicants were men and 57% of the successful proposals were awarded to men. Forty-three percent of the applicants were female and 43% of the successful proposals were awarded to women
By proportion of who applied, women’s success rate was higher for five funding programs in the sample and lower for seven.
In terms of the amount of funding allocated to successful applicants based on sex, the following were observed:
- In total, male scientists received $43, 081,519 and female applicants received $27,092,847.
- By proportion, the percent of total funding dollars distributed to successful male applicants (61%) exceeds the percent of successful proposals awarded to female participants (57%).
- When the average value for each sex is compared, successful female applicants received 85 cents for every research dollar received by their male counterparts.
Note: The evaluation could not explain the factors that account for these differences.
Finding: Female scientists received more funding under models with a competitive component than under a directed funding model. For some programs administered in a fully competitive way, female scientists were more successful than male scientists.
The success rate for female scientists under funding models with a competitive component was 45% compared to 22% under the directed approach. This result suggests that where specific applicants are approached to develop and submit proposals, more men are invited than women.
For the sample, a higher proportion of men applied to the directed programs (n=34) than women (n=11). Limited by the lack of data about who was eligible to apply and who was invited to apply, the evaluation is not able to draw conclusions about the equity of the process to select applicants for these two models of funding and whether there are any barriers or biases present.
| Funding Model | Program | Successful Female | Successful Male | Total (n) |
|---|---|---|---|---|
| Competitive & Targeted Competitive | Arctic Science | 67% (6) | 33% (3) | 9 (4%) |
| SPERA | 56% (32) | 44% (25) | 57 (22%) | |
| IGS | 26% (9) | 74% (26) | 35 (13%) | |
| ACCASP | 40% (22) | 60% (33) | 55 (21%) | |
| ACRDP | 20% (4) | 80% (16) | 20 (8%) | |
| GRDI | 43% (3) | 57% (4) | 7 (3%) | |
| AIS | 70% (16) | 30% (7) | 23 (9%) | |
| CEMAM | 41% (9) | 59% (13) | 22 (8%) | |
| CAAHRD | 55% (11) | 45% (9) | 20 (8%) | |
| NMF | 50% (6) | 50% (6) | 12 (5%) | |
| Average | 45% (12) | 55% (14) | 26 | |
Directed |
FSERP | 33% (2) | 67% (4) | 6 (5%) |
| PARR | 20% (6) | 80% (24) | 30 (10%) | |
| Average | 22% (4) | 78% (14) | 18 |
Description
...5.8 Gender-related barriers to accessing the funding programs
Finding: The perception of barriers related to gender is limited, however there are perceptions that eligible applicants do not have equitable access to funds available through these programs.
When surveyed, most applicants and reviewers indicated there were no barriers to accessing any of the funding programs based on gender (Figure 6).
Figure 6 – Perception of barriers related to gender
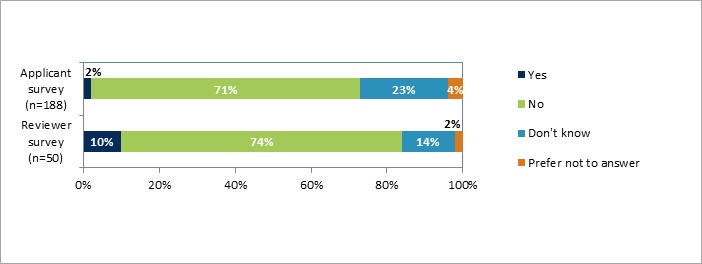
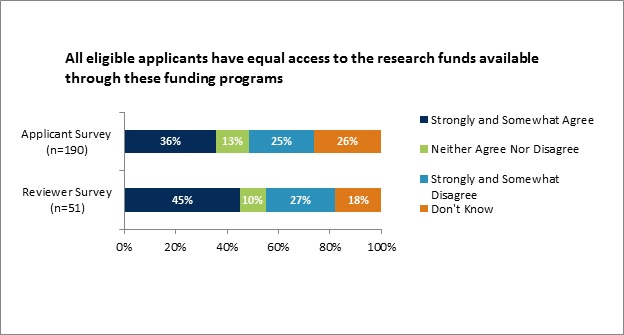
Most EOS personnel interviewed or surveyed for the evaluation said that quality science is the main criterion upon which funding is awarded. Reviews are neutral by design. However, when applicants and members of review committees were asked if eligible applicants have equal access to the funds available through these programs, they were split in their responses. See Figure 7.
Figure 7 – Perceptions of equitable access to funding programs
5.9 Other barriers to accessing the funding programs
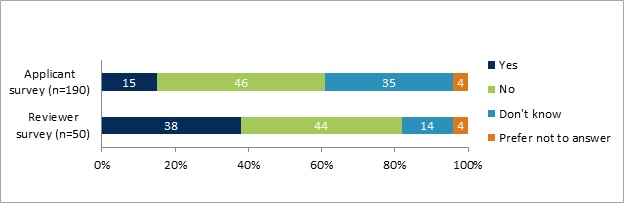
Finding: There is a perception that career status can be a barrier to accessing funds. Survey results show the perception is higher among the reviewers than the applicants.
Survey results show there is a perception of some barriers attributed to career status. Thirty-eight percent of respondents to the reviewers’ survey and 15% of respondents to the applicant survey said that eligible scientists experience barriers related to career status (see figure 8). Some interviewees supported this perception.
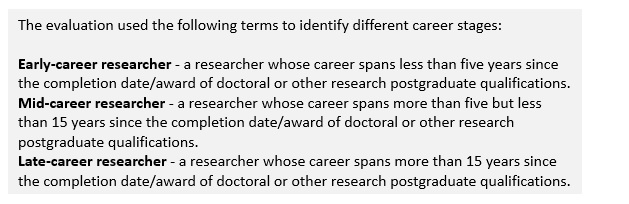
These findings are consistent with the results of the literature review that was conducted to help the evaluation team identify factors to be examined in the GBA+ approach. The literature review showed that female researchers and early career researchers (ECRs) have been found to be less successful in research funding competitions and awarded less research funding than male applicants and seasoned researchers, respectfully.
Figure 8 - Perception of barriers related to career status
Of all the review committee members that indicated there were barriers in general to scientists accessing funding, 58% commented that the issues related to career status could be addressed by mentoring, and by introducing new criteria for the call and for the review.
Finding: Survey and interview data support the finding that there are few perceived barriers related to official language, ethnicity, age and geographic location.
Program applicants and members of review committees were asked whether there are barriers to accessing funding based on official language, ethnicity, age, geographic location and other. As shown in Table 5, the majority of applicants and members of review committees who responded to the surveys did not perceive barriers related to age, ethnicity or official language. There was a perception of some barriers related to geographic location. Interestingly, the regions that noted geographic location as a barrier are the regions that received most of the funding.
| Responses | Yes | No | Don’t know | Prefer not to answer | ||||
|---|---|---|---|---|---|---|---|---|
| Identity factor | Reviewers | Applicants | Reviewers | Applicants | Reviewers | Applicants | Reviewers | Applicants |
| Official language | 12% | 3% | 66% | 81% | 20% | 14% | 2% | 2% |
| Ethnicity | 4% | 1% | 72% | 83% | 22% | 15% | 2% | 1% |
| Age | 6% | 2% | 70% | 71% | 22% | 25% | 2% | 2% |
| Geographic location | 22% | 20% | 61% | 48% | 14% | 31% | 4% | 1% |
| Other | 16% | 18% | 60% | 48% | 24% | 31% | 3% | |
Description
...Note: Response rate for the survey of applicants varied between 186 and 190 respondents. 50 reviewers answered all of these questions.
Those who indicated there were barriers based on one or more identity factors were asked to explain their answer. Seventy percent of the comments received (n=86 for both surveys) were related to feelings of exclusion at the application stage, perceptions of favouritism or bias in the review stage and barriers related to language.
Interestingly, when review committee members were asked about practices that might add “efficiencies” to the review process, 30% of the responses were related to addressing conflict of interest at the review stage (i.e., when reviewers sitting on the panels have to review proposals they helped develop) and lack or fairness.
Some reviewers suggested that biases could be addressed by adjusting the composition of committees to allow for example an increased representation of technical expertise including external experts.
5.10 Communication barriers
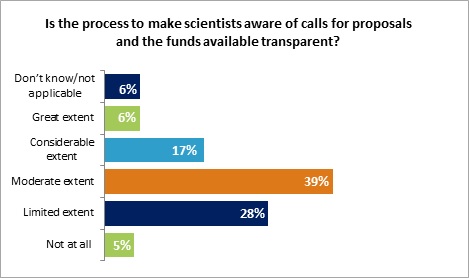
Finding: Ineffective communication at various points in the funding process, especially how and when eligible applicants are notified, limits equitable access to the funding programs. Inconsistent communication leads to a perceived lack of transparency.
The piecemeal approach to communicating about funding opportunities could represent the greatest barrier to equitable access to the 16 funding programs. Many commented that communication is random and is inconsistent from year to year and from program to program. Methods used to notify scientists range from all regions receiving notification to individual scientists learning about an opportunity from someone in another region.Information is shared through non-official channels and not to all eligible scientists and not at the same time. Last minute, absent or delayed sharing of information leads to unequal access.
Further, national fund managers interviewed for the evaluation had little knowledge about how people were notified of upcoming opportunities once the calls were sent to the regions, suggesting a disconnect with regional process.
One third of respondents to the applicant survey indicated that the process to make them aware of calls for proposals and funds available is not transparent (33% not at all or to limited extent). See Figure 9.
Figure 9 – Perceived transparency of funding allocation process

Key limitation in the Gender-Based Analysis Plus: Evidence about the weaknesses in the communication of funding opportunities combined with the lack of data about who is eligible and who was invited, indicates the evaluation is missing part of the story.
Suggestions put forward by reviewers and applicants to improve communication in the funding programs included:
- Broadcast calls to all scientists.
- Make the amount of funding available known with the call.
- Move from the practice of sending emails to a centralised, automatic notification process.
- Be transparent about targeted processes. Not making all scientists aware of all opportunities can lead to perceived or real biases in process.
Best practices with regards to handling conflict of interest when funding proposals:
With the exception of the National Research Council who recently received funding as part of Budget 2018, DFO appears to be the only federal department or agency that has a large number of internal funding envelopes where internal scientists apply for O&M research funds. However, external research granting agencies such as the Natural Sciences and Engineering Research Council (NSERC) have integrated best practices into their processes and the literature review identified practices that can support equity and transparency in funding research. For example, one best practice is to have guidelines that ask reviewers who know applicants to declare their conflicts of interest and remove themselves from the review processes. The evaluation found some evidence that where DFO scientists are involved in technical reviews of proposals, they will remove themselves from the discussion where there could be a perceived conflict. However, removing other members of committees is likely not possible in the current DFO review committee model given that applicants to the 16 funding programs work in the same department and potentially the same regions or even buildings as reviewers. The likelihood of knowing applicants is high.
Mandatory Unconscious-Bias training has been adopted by research granting agencies (e.g. NSERC, Canadian Institutes for Health Research, Social Science and Humanities Research Council) to help peer reviewers understand and adjust their implicit-bias tendencies when reviewing applications.
5.11 Best practices that support equity and diversity
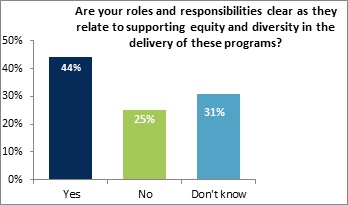
Finding: To help reduce any perceived barriers, best practices could be implemented and staff roles and responsibilities could be clarified as they pertain to supporting equity and diversity.
When internal key informants were asked if they followed any practices in the application or selection stages to support equity and diversity, only a couple practices were mentioned (e.g. removing full names from applications before review). As shown in Figure 10 below, 25% of respondents to the reviewer survey said their roles and responsibilities are not clear as related to supporting equity and diversity in the delivery of the funding programs. In the absence of a clear policy, those involved in reviewing proposals are not sure how they can contribute to this goal. They commented that clear criteria for the evaluation of proposals is needed to clarify what they are trying to achieve and any guidance would be welcomed.
Figure 10: Clarity of review committee members roles and responsibilities regarding equity and diversity
Description
This bar graph shows that 44% of review committee members feel their roles and responsibilities related to supporting equity and diversity in the delivery of the funding programs are clear. 25% feel that their roles and responsibilities are not clear. 31% do not know.
BEST PRACTICES in the funding of science research were identified through a literature review and through an interview with the Natural Sciences and Engineering Research Council.
Program design
- Establish a framework on equity and diversity.
- Target underrepresented groups to increase the number of potential applicants.
Call for proposals
- Modify application requirements to include more members of the target population.
- Remove gendered language from policies and proposals.
- Ensure program policies are inclusive and do not present barriers to underrepresented groups.
- Ask self-identification questions on applications.
- Ask how sex and gender are considered in the design of research.
Application assessment
- Challenge assumptions of ‘success’ in scientific research.
- Focus on the project, not the person.
- Review the process for selecting peer reviewers.
- Ensure diverse boards for decision-making.
- Require unconscious-bias training for reviewers.
6.0 Conclusions and Recommendations
6.1 Efficiency
Conclusions
While the evaluation found that each individual funding program is using some best practices observed in other organizations or identified in the literature, the overall impact of multiple processes that will likely increase as new funding is approved, and the lack of coordination among them creates inefficiencies. Evidence suggests that the current model results in significant efforts for the organization and that considerable change would be needed in order to reduce the transaction costs. An examination of practices at the Natural Science and Engineering Research Council (NSERC) indicated recent changes have been made to reduce the number of unique programs being separately administered and to align research activities under an overarching research plan. These practices could be given consideration for making improvements to the delivery of science funding in the EOS sector. There is widespread support across the Ecosystems and Oceans Science sector for changes that would improve th efficiency of how the programs are delivered.
Internal DFO clients are not satisfied with how their priorities are reflected in funded research and how research results are communicated back to them. This indicates that some of the research funded may not be relevant and/or is not being adequately transferred to end-users. These two issues could limit the ability of DFO clients to use research information to support evidence-based decision making, which is a priority of the department.
There is support for both competitive and directed funding models; however, more communication to staff is needed to explain the rationale for which model is being applied and when.
Recommendations
It is recommended that the ADM, Ecosystem and Oceans Science:
- Transform the overall research funding allocation process. Consideration should be given to streamlining and developing a model aimed at increasing overall efficiencies across EOS’ research universe.
- Adjust the funding allocation and research processes to increase client engagement at key touchpoints. Improved engagement with end-users should help better align research projects with their needs. It will also allow for information and research progress to be communicated to clients at key points in the process, including at the end when research results are available.
6.2 Gender-Based Analysis Plus
Conclusions
The success rate of women is equal to the proportions of those who apply. There are some gaps in the success of female applicants based on the type of funding model used to solicit proposals. Further, there is a gap in the amount of funding awarded to male versus female researchers. Survey and interview results suggest that perceived biases related to gender or sex are minor in regards to accessing funding. There is, however, a perception among reviewers of proposals of barriers related to career status.
There is strong evidence that how scientists are informed about funding opportunities is ineffective especially at the notification stage when issuing calls for proposals. Inconsistent communication practices lead to real or perceived inequitable access to the funds across the scientist population.
There are limited practices in place or guidance available for reviewers to support equity and diversity in the delivery and administration of these funding programs. With no policy or framework in place to measure against, the evaluation is not able to draw conclusions about whether the success rates of female applicants, the level of perceived barriers and other GBA+ findings are a concern.
Recommendation
It is recommended that the ADM, Ecosystem and Oceans Science:
- Standardize communication about funding opportunities in the sector across the funding programs to reduce real and/or perceived inequities in how eligible scientists receive information. While there is wide support for the use of both directed and competitive solicitation of research proposals, better communication about the rationale of choosing one funding model over the other, including inviting a particular group of scientists over others, would improve overall transparency.
7.0 Management Action Plan
Recommendation 1
Recommendation 1: It is recommended that the Assistant Deputy Minister, Ecosystem and Oceans Science transform the overall research funding allocation process. Consideration should be given to streamlining and developing a model aimed at increasing overall efficiencies across EOS’ research universe.
Rationale: While the evaluation found that each individual funding program is using some best practices observed in other organizations or identified in the literature, the overall impact of multiple processes that will likely increase as new funding is approved, and the lack of coordination among them creates inefficiencies. Evidence suggests that the current model results in significant efforts for the organization and that considerable change would be needed in order to reduce the transaction costs. An examination of practices at the Natural Science and Engineering Research Council (NSERC) indicated recent changes have been made to reduce the number of unique programs being separately administered and to align research activities under an overarching research plan. These practices could be given consideration for making improvements to the delivery of science funding in the EOS sector.
Strategy
The Assistant Deputy Minister, working with the Science Executive Committee members, will use this evaluation and other feedback received to transform the funding allocation system for priority-based research. This system will include client-sector priority setting, opportunities for external review, and clearer and unified communication to all staff.
| Management Actions | Due Date (by end of month) | Status Update: Completed / On Target / Reason for Change in Due Date | Output |
|---|---|---|---|
| Launch of new model for science funding. | January 2020 | ||
| Full implementation of the new funding system (e.g. allocation decisions made) | January 2021 |
Recommendation 2
Recommendation 2: It is recommended that the Assistant Deputy Minister, Ecosystem and Oceans Science adjust the funding allocation and research processes to increase client engagement at key touchpoints. Improved engagement with end-users should help better align research projects with their needs. It will also allow for information and research progress to be communicated to clients at key points in the process, including at the end when research results are available.
Rationale: Internal DFO clients are not satisfied with how their priorities are reflected in funded research and how research results are communicated back to them. This indicates that some of the research funded may not be relevant and/or is not being adequately transferred to end-users. These two issues could limit the ability of DFO clients to use research information to support evidence-based decision making, which is a priority of the department.
Strategy
In the transformed funding allocation system, identification of clients and need for on-going client engagement will be formalized. This transition will also require more formal priority setting mechanism within key client-sectors. The Assistant Deputy Minister, Ecosystems and Oceans Science will include these considerations in the new process.
| Management Actions | Due Date (by end of month) | Status Update: Completed / On Target / Reason for Change in Due Date | Output |
|---|---|---|---|
| Formal-call letter to client sectors to identify their priorities and responsible officers/contacts for each priority. | October 2019 | ||
| Inclusion of expectations for on-going engagement in launch of new model. | January 2020 | ||
| First formal report on funded priorities provided to client sectors in new funding system. | March 2021 |
Recommendation 3
Recommendation 3: It is recommended that the Associated Deputy Minister, Ecosystem and Oceans Science standardize communication about funding opportunities in the sector across the funding programs to reduce real and/or perceived inequities in how eligible scientists receive information. While there is wide support for the use of both directed and competitive solicitation of research proposals, better communication about the rationale of choosing one funding model over the other, including inviting a particular group of scientists over others, would improve overall transparency.
Rationale: The success rate of women is equal to the proportions of those who apply. There are some gaps in the success of female applicants based on the type of funding model used to solicit proposals. Further, there is a gap in the amount of funding awarded to male versus female researchers. Survey and interview results suggest that perceived biases related to gender or sex are minor in regards to accessing funding. There is, however, a perception among reviewers of proposals of barriers related to career status. There is strong evidence that how scientists are informed about funding opportunities is ineffective especially at the notification stage when issuing calls for proposals. Inconsistent communication practices lead to real or perceived inequitable access to the funds across the scientist population.
Strategy
The Assistant Deputy Minister, working with the Science Executive Committee members, will use this evaluation and other feedback received to transform the funding allocation system for priority-based research activities. This system will include client-sector priority setting, opportunities for external review, and clearer and unified communication to all staff. Best practices will be incorporated as possible.
| Management Actions | Due Date (by end of month) | Status Update: Completed / On Target / Reason for Change in Due Date | Output |
|---|---|---|---|
| Unified communications approach to all staff regarding funding system will be in place in advance of launch. | January 2020 |
ANNEX 1 - Sampling Strategy for the Gender-Based Analysis Plus
Quantitative data analysis
The scope of the GBA+ based on quantitative administrative EOS data review included 12 of the 16 funding programs. Information for funded and unfunded proposals was requested including: project/proposal name, name of principal investigator, region, and value of project ($). Up to three fiscal years of data was provided by each program and included in the analysis. Fiscal years included ranged from 2016-2017 through 2019-2020.
Only principal investigators in indeterminate positions were included in the data analysis. For projects with more than one principal investigator, up to two were included. Names provided were matched with available DFO employee human resources data from April 2018 that included:
- Position Title
- Classification and Level*
- Region
- Self-Identified Biological Sex
- Self-Identified First Official Language
- Employment Status
*Classification group e.g. BI, RES plus level or step on salary grid
The review of administrative data conducted as part of the GBA+ did not include information about gender or visible minorities as this data was unavailable.
Prior to analysis, personal identifiers (i.e. names, locations) were removed from the dataset. Also, a total of 10 projects were excluded (four funded, six unfunded) from the analysis due to unavailable Human resources (HR) data (e.g. principal investigators outside of EOS or DFO, visiting scientists, volunteers).
Qualitative data analysis
The qualitative data analysis assessed the success rate of scientists based on the following identity factors, with the primary focus on sex:

Description
This diagram shows some of the identity factors considered in the Gender-Based Analysis Plus including sex, first official language, employment classification and level, and region.
The above identity factors as well as additional ones (E.g. age, ethnicity) were examined using qualitative methods to understand other perceived barriers and to triangulate the results with those from the review of administrative EOS data.
- Applicant Survey/Reviewer Survey
- Key Informant Interviews
- Literature Review
- Document Review
GBA+ specific limitations
- No data was available for the population of researchers eligible for or invited to participate in science funding.
- Not all programs were included (12 of 16).
- Programs provided funded/unfunded project data for varying fiscal years.
- We were reliant on accuracy and completeness of administrative data provided.
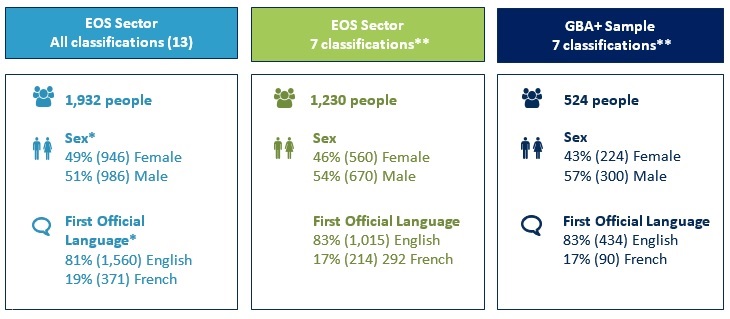
To conduct the GBA+, demographic data, as of April 2018, was received for the all employees in the EOS sector. The evaluation team removed some job classifications and retained those aligned with the scientist population. The box on the right in Figure 11 contains information on the final sample that was used in the analysis.
Figure 11: Sampling Strategy for Gender-Based Analysis Plus
Description
The three tables on this page show the demographics of the Ecosystem and Oceans Science Sector based on the administrative data received and analysed for the Gender-Based Analysis Plus component of the evaluation.
The first table shows that as of April 2018, for all employment classifications there were 1,932 employees. 49% (n=946) were female and 51% (n=986) were male. 81% (n=1560) identified English as their first official language. 19% (371) identified French as their first official language.
The second table shows that for the 7 classifications that align with the scientist population, there were 1,230 people. 46% (n=560) were female and 54% (n=670) were male. 83% (n=1,015) identified English as their first official language. 17% (214) identified French as their first official language.
The third table shows that for the 7 classifications in the sample analysed, there were 524 principal investigators. 43% (n=224) were female and 57% (n=300) were male. 83% (n=434) identified English as their first official language. 17% (90) identified French as their first official language.
* As noted earlier, sex refers to biological sex. Both sex and first official language are self-identified. One piece of data was missing for first official language.
** Includes classification groups that align with scientists working in the department: BI, SERES, SEREM, CH, PC, VM, EG (non-hydrographic services). Population eligible for funds is not available.
ANNEX 2 – Methodology: Value of Researcher’s time
Level of effort analysis – Key steps
Step 1: Collect survey responses regarding total reported working days for each job classification and level.
Step 2: Calculate daily rates for each job classification and level depending on three scenarios based on potential salary steps.
Step 3: Multiply the number of working days with the daily rates for each scenario for each job classification and level.
Step 4: Add all the values for each job classification/level.
| Classification | Number of respondents / (% of total survey population) | Number of working days reported (not broken-down by level) | Scenario 1 (Lowest step) | Scenario 2 (Middle step) | Scenario 3 (Highest step) |
|---|---|---|---|---|---|
| Biologists (BI) | 75 / (17.6%) | 1,355 | $ 370,155 | $ 439,428 | $ 512,520 |
| Scientific Research (SE-RES) | 95 / (43.4%) | 2,731 | $ 875,370 | $ 1,029,377 | $ 1,218,839 |
| Physical Science (PC) | 9 / (9.6%) | 288 | $ 108,403 | $ 115,969 | $ 126,747 |
| Total: | 179 | 4,374 | $ 1,353,928 | $ 1,584,775 | $ 1,858,106 |
| Total Estimated Expenditures for Fiscal Year 2017-18 | $ 15,789,178 | ||||
| Note: 197 survey participants answered the question about working days. Three (2) outliers were removed and another (1) respondent who answered “other” as its job classification was removed. Moreover, 15 respondents from the EG and CH categories were removed to facilitate the analysis. | |||||
Description
...[1] Non-hydrographic services only.
[2] Note: These results are based on information provided to the evaluation team and includes the AEIP program that was not fully rolled out at the time of data collection.
[3] Survey of Review Committee members only.
- Date modified: