
Evaluation of the Shore-based Asset Readiness (SBAR) program
Final Report
Project Number 96263
June 26, 2020
Table of Contents
- 1.0 Evaluation context and background
- 2.0 Program profile and context
- 3.0 Evaluation findings
- 3.1 Investments in the Shore-based Asset Readiness program
- 3.2 Impact of investments on the Shore-based Asset Readiness program
- 3.3 Availability, capability, and reliability of shore-based assets
- 3.4 Client service and innovation for shore-based assets
- 3.5 Challenges ensuring that shore-based assets are available, capable and reliable
- 3.6 Application of the life cycle management approach
- 4.0 Conclusions and recommendations
- Appendix A – Shore-based Asset Readiness program evaluation matrix
- Appendix B – Evaluation methodology
- Appendix C - Case studies
- Case Study: The Four Season Buoy Project
- Case Study: The Communication Control System Equipment Replacement Project
- Case Study: The Federal Infrastructure Initiative
- Case Study: The Oceans Protection Plan – Operational Network Project
- Case Study: The Oceans Protection Plan – Radar and the Additional Radar Sites Initiative
- Appendix D: Management action plan
1.0 Evaluation context and background
1.1 Overview
This report presents the results of the Evaluation of the Shore-based Asset Readiness (SBAR) program.
The evaluation was conducted by Fisheries and Oceans Canada’s (DFO) Evaluation Division between April 2019 and December 2019 in accordance with the Treasury Board’s Policy on Results (2016).
1.2 Evaluation objectives and scope
The evaluation was designed as an outcome evaluation and examined the performance and efficiency of the program.
The scope of the evaluation covered the period 2014-15 to 2018-19 and was inclusive of National Headquarters and all Canadian Coast Guard (CCG) regionsFootnote 1.
The scope of the evaluation covered all SBAR activities, including those undertaken with special investments in the program (see Section 3.1 for more on these investments). Environmental Response (ER) program activities that were funded through the Oceans Protection Plan (OPP) were not included within the scope of the evaluation.
1.3 Evaluation methodology and evaluation questions
The evaluation used multiple lines of evidence, including interviews, case studiesFootnote 2, data analysis, observation, and document review to examine the questions presented in the table below (see Appendix A for the evaluation matrix and Appendix B for the detailed methodology).
Evaluation questions
Effectiveness
- To what extent have financial and human resources been invested in support of SBAR over the last ten years?
- To what extent has SBAR ensured that shore-based assets are available, reliable and capable to support CCG clients?
- What have been the impacts of specific investments (i.e., World Class Tanker Safety System (WCTSS) initiative, Federal Infrastructure Initiative (FII), Comprehensive Review) on SBAR’s ability to meet its objectives and expected outcomes?
- What are the factors (internal or external to CCG) that have facilitated or hindered SBAR’s ability to meet its objectives?
- To what extent is SBAR on track to achieve the milestones and key outputs of the OPP sub-initiatives under its responsibility?
Efficiency and economy
- To what extent has Integrated Technical Services (ITS) developed and implemented sound management practices, processes, systems, tools and technical solutions to ensure an efficient and economical use of its resources and assets in the delivery of SBAR?
- To what extent has ITS managed CCG’s assets at optimal life-cycle cost in the delivery of SBAR?
Gender-based Analysis Plus
- To what extent have GBA+ considerations been incorporated into the planning and the management of the SBAR program?
2.0 Program profile and context
2.1 Shore-based Asset Readiness program objectives
The SBAR programFootnote 3 ensures that CCG's non-fleet assets are available, capable and reliable to support the delivery of CCG programs. Internal to the CCG, the main clients are the Aids to Navigation (AtoN) and the Marine Communications and Traffic Services (MCTS) programs. External to the CCG, the main stakeholders are mariners and the marine industry.
Non-fleet assets include fixed and floating aids to navigation and equipment (e.g., buoys, beacons, lanterns and fog systems), towers, helipads, buildings to house equipment, power systems, and a wide variety of systems to support marine communications (e.g., radar, VHF, automatic identification system).
The program falls within the departmental core responsibility of Marine Navigation (provide information and services to facilitate navigation in Canadian waters) and supports two departmental results: mariners safely navigate Canada’s waters; and a Canadian maritime economy that is supported by navigable waters.
2.2 Responsibility for the Shore-based Asset Readiness program
Integrated Technical Services (ITS), CCG is responsible for the SBAR program. ITS is comprised of four branches, three of which have responsibility for non-fleet asset management. The branches are described below and the structure of the program is depicted in the figure that follows.
- Electronics and Informatics (E&I): responsible for the management of land electronic assets (e.g., radar systems, communication network infrastructure, radios, transponders); and for developing, maintaining and providing support for CCG-specific computer applications, operational and information systems [e.g., MAXIMO, Communication Control System (CCS)].Footnote 4
- Maritime and Civil Infrastructure (MCI): responsible for CCG shore-based infrastructure (e.g., towers, fences, buildings, electrical generating systems) and aids to navigation equipment (e.g., range lights, and markers, lanterns, buoys and moorings).
- Technical Management (TM): responsible for project management, life cycle management systems, planning and performance, and integrated logistics support.
Within E&I and MCI, engineering teams design and develop technical solutions. Production teams implement technical solutions and deliver technical support, including installation, maintenance and disposal.

Description
The organization of the Shore-based Asset Readiness program is depicted, as follows: Integrated Technical Services (ITS) is comprised of four branches: Electronics and Informatics (E&I), Maritime and Civil Infrastructure (MCI), and Marine Engineering which are underpinned by Technical Management (TM). Of these, E&I, MCI and TM are responsible for the SBAR program.
The SBAR program provides support to CCG ProgramsFootnote 5 including: Aids to Navigation (AtoN), Marine Communications and Traffic Services (MCTS), and Environmental Response (ER).
2.3 Operating context for the Shore-based Asset Readiness program
Canada’s longest inland waterway extends 3,700 km from the Gulf of St. Lawrence to Lake Superior, and is also Canada’s largest freshwater system. In addition, Canada has over two million lakes and rivers covering 755,000 km2; and a coastline that stretches close to 243,000 km.
The CCG’s AtoN program ensures safe and accessible navigation for mariners and the marine industry, and is responsible for the provision of aids to navigation systems and services.
The CCG’s MCTS program ensures that a reliable marine communication system is available on a 24/7 basis and provides services such as marine distress and radio communications, broadcasting maritime safety information, screening vessels entering Canadian waters and regulating vessel traffic.
Shore-based assets belong to the AtoN and MCTS programs, which are responsible for defining the specifications of their needs. The SBAR program is integral to the delivery of both the AtoN and MCTS programs as it is responsible for identifying and implementing solutions to meet its clients’ needs, including the LCM of the assets.
SBAR is responsible for maintaining over 17,000 aids to navigation, electronic systems for 12 MCTS Centres and 184 remote sites that include over 1,300 related assets (e.g., radars, towers, buildings).
A reliable, accurate and dependable aids to navigation system is critical to the marine transportation industry. The industry has significant economic, social, and environmental benefits.
- 20% of Canadian exports ($) are transported by ship.
- Industry contributes $3 billion to the GDP.
- Industry has an economic impact equal to $30 billion.
- Some communities rely on shipping for access to goods.
- Shipping is the least emission-intensive mode of transport.
2.4 Life cycle management approach
SBAR applies a life cycle management (LCM) approach to ensure that assets meet availability, capability and reliability requirements, while minimizing costs. There are four phases to the LCM: conception, acquisition, in-service and disposal. The figure below provides an overview of the SBAR LCM Framework.
The application of the LCM system approach is discussed in more detail, starting in Section 3.6.

Description
An overview of the SBAR Life-Cycle Management (LCM) Framework is depicted through the four phases of the LCM: conception, acquisition, in-service and disposal.
Conception consists of: defining needs and requirements; developing options analysis and identifying a preferred solution; defining maintenance concepts; preparing supporting documentation; and obtaining project approval and initiating projects.
Acquisition consists of: consulting stakeholders, refining and confirming requirements; acquisition planning and approval; acquiring, receiving and installing assets; developing maintenance plans and setting up of Maximo, developing service level agreements; and developing training for new assets.
In-Service consists of: monitoring performance and collecting maintenance data; analyzing issues and proceeding accordingly (maintenance, configuration change, replacement, or disposal); and performing maintenance (preventative and corrective).
Disposal consists of: disposal of asset; reclaiming usable components and recycling waste; disposing of /archiving information; and site decommissioning and remediation.
A number of tools have been developed to support the application of the LCM approach.
- Guidance: Theory, guidance and documentation is available on the ITS Intranet page, which provides the policy framework and guidance on the asset management system (AMS) and the application of LCM; as well as guidance and training on Maximo.Footnote 6
- Tools: The Asset Condition Assessment Program (ACAP) is in place to ensure a nationally consistent methodology to evaluate and report on the condition of the asset base on a cyclical basis. Maximo is the system used to support the life cycle management of SBAR assets.
- Support: There are AMS officers in each region to provide support and guidance on the use of Maximo. Maximo working groups have also been established for each of the asset streams (i.e., E&I and MCI). A special group has been established to provide support for inventory management in Maximo.
3.0 Evaluation findings
3.1 Investments in the Shore-based Asset Readiness program
Finding: After having little investment over at least a 5-year period, the SBAR program was facing a number of program pressures related to the management of shore-based assets.
Shore-based Asset Readiness program financial profile 2009-2010 to 2013-14
The figure below illustrates SBAR actual expenditures, special project expenditures (millions) and Full Time Equivalents (FTEs) by utilization from 2009-10 to 2013-14. Within this period, SBAR’s actual expenditures decreased by approximately $23M while special project expenditures increased by approximately $11M.
During this same time period, although there was an initial increase in 2010-11, the number of FTEs experienced a decrease from 533.9 to 447.0 - an overall decrease of 16.3%.
Expenditures for CR are included with the actual expenditures as it was not possible to isolate them.

Description
The figure represents SBAR actual expenditures, special project expenditures (in Millions) and Full Time Equivalents (FTEs) by utilization between 2009-10 and 2013-14.
In 2009-10, overall expenditures totalled $100.2M; actual expenditures were $99.8M; and special project expenditures were $0.4M. FTEs by utilization were 533.9.
In 2010-11: overall expenditures totalled $87.3M; actual expenditures were $85.8M; and special project expenditures were $1.5M. FTEs by utilization were 562.1.
In 2011-12: overall expenditures totalled $84.1M; actual expenditures were $81.8M; and special project expenditures were $2.3M. FTEs by utilization were 541.1.
In 2012-13: overall expenditures totalled $90.2M; actual expenditures were $82.1M; and special project expenditures were $8.0M. FTEs by utilization were 500.3.
In 2013-14: overall expenditures totalled $87.8M; actual expenditures were $76.8M; and special project expenditures were $11.0M. FTEs by utilization were 447.0.
During this time period, FTEs by utilization decreased by 16.3%, actual expenditures decreased by 23.1%, and special project expenditures increased by 2869.2%, when compared to 2009-10.
During this period, the CCG’s overall financial and human resources were reduced due to the Deficit Reduction Action Plan and the Strategic and Oversight Review. As a result, CCG shifted from a 5-region model to a 3-region model, 22 MCTS centres were consolidated into 12, and there was a reduction in FTEs.
NOTE: Due to inconsistencies in financial coding, the data in the financial system for the SBAR program was inaccurate. The figures presented in this report represent revised figures and therefore do not match the figures in the financial system. In addition, some assets have been coded to other CCG programs, thus these figures may not include all of SBAR’s expenditures.
Program pressures that existed
Due to limited investment and the reduction in FTEs during this time period, the SBAR program was experiencing a number of pressures.
There was limited capacity to apply a LCM approach for the management of assets and the program had to be in a reactive rather than proactive mode (i.e., priority was addressing out of service assets, rather than regularly maintaining them to prevent outages).
The condition of assets deteriorated and many were reaching end of life, which resulted in the assets being below the expected baseline.
There was an increased risk of critical asset outages, which affected the ability of AtoN and MCTS to deliver on their mandates. Outages of critical assets can put marine safety at risk.
Finding: Large investments were made in the SBAR program beginning in 2015-16, which resulted in critical improvements and upgrades, the modernization of assets, and increases in staffing—all of which could not previously be addressed within the funding envelope for the program. There were some associated challenges and unintended impacts of these investments.
Investments in the Shore-based Asset Readiness program
Beginning in 2015-16, the SBAR program received large investments to address the program pressures and bring program assets back up to baseline (i.e., assets being available, reliable and capable).
The actual expenditures totaled $406.0M over 5 years and included increases to capital, salary, operations and maintenance (O&M) and expenditures made with CR funds.
The figure below illustrates SBAR actual expenditures, special project expenditures (Millions) and FTEs by utilization from 2014-15 to 2018-19. Within this period, SBAR’s expenditures increased from $74.0M to $93.2M—an increase of 26.0%.
During the same time period, FTEs increased from 429.6 to 564.7—an increase of 31.5%.

Description
The figure represents SBAR actual expenditures, special project expenditures (in Millions) and FTEs by utilization between 2014-15 and 2018-19.
In 2014-15, overall expenditures totalled $82.4M; actual expenditures were $74.0M; and special project expenditures were $8.4M. FTEs by utilization were 429.6.
In 2015-16: overall expenditures totalled $85.6M; actual expenditures were $71.0M; and special project expenditures were $14.6M. FTEs by utilization were 460.7.
In 2016-17: overall expenditures totalled $98.9M; actual expenditures were $76.0M; and special project expenditures were $22.9M. FTEs by utilization were 487.1.
In 2017-18: overall expenditures totalled $130.2M; actual expenditures were $91.8M; and special project expenditures were $38.4M. FTEs by utilization were 519.4.
In 2018-19: overall expenditures totalled $124.1M; actual expenditures were $93.2M; and special project expenditures were $30.9M. FTEs by utilization were 564.7.
During this time period, FTEs by utilization increased by 31.5%, actual expenditures increased by 26.0%, and special project expenditures increased by 269.7%, when compared to 2014-15.
The program’s expenditures for special projects increased from $8.4M to $30.9M over 2014-15 to 2018-19. The special projects include the expenditures detailed below.
Significant investments were received by the program for special projects, which were aimed at improving SBAR assets, and included salary for 160.8 FTEs during the 2014-15 to 2018-19 period.
| Comprehensive Review (funding) | Communications Control System* (expenditures) | Federal Infrastructure Initiative (expenditures) | Oceans Protection Plan (expenditures) | World-Class Tanker Safety System* (expenditures) | Four-Season Buoy Project (expenditures) |
|---|---|---|---|---|---|
| On-going $38.5M to date | Completed $48.3M | Completed $45.1M | In-progress $32.3M to date | Completed $7.5M | In-progress $5.1M |
*Some funding for special projects was received prior to the 2014-15 to 2018-19 period.
3.2 Impact of investments on the Shore-based Asset Readiness program
Impacts of investments on the Shore-based Asset Readiness program
SBAR program representatives indicated that the special investments in the SBAR program had significant impacts, including:
- Improvements to infrastructure and assets;
- Implementation of new or innovative technologies;
- An increase in FTEs; and
- The completion of gap analyses and studies.
The table below illustrates the types of investment made in the SBAR program.
| Infrastructure improvements | Equipment modernization | Human resources | Gap analyses and studies | |
|---|---|---|---|---|
| Comprehensive Review (CR) | - | - | X | - |
| Communications Control System (CCS) * | - | X | - | - |
| Federal Infrastructure Initiative (FII) * | X | - | - | - |
| Operational Network (OPP-OpNet) * | - | X | - | - |
| OPP Radar and the Additional Radar Sites Initiative * | X | - | - | - |
| World-Class Tanker Safety System (WCTSS) | X | - | - | X |
| Four-Season Buoy Project (4SB) * | - | X | - | - |
The next section provides examples of the types of activities undertaken through these special investments. Additional detail on some of these investments (*) is provided in Appendix C.
Listed below are examples of activities undertaken through the special investments.
| Infrastructure improvements | FII |
|
|---|---|---|
| OPP-Radar |
|
|
| WCTSS |
|
|
| Human resources | CR |
|
| Equipment modernization | CCS |
|
| OPP-OpNet |
|
|
| 4SB |
|
|
| Gap analyses and studies | WCTSS |
|
Breakdown of investments by capital, salary and O&M
As noted, SBAR’s actual expenditures totaled $406.0M over a five-year period, and included expenditures made with CR funds.
The figure below illustrates SBAR actual expenditures (Millions), by salary, O&M and capital from 2014-15 to 2018-19. As a proportion of the total investment, the majority went to salary, not capital or O&M. Salary spending increased from $33.6M in 2014-15 to $46.1M in 2018-19.
Although the SBAR program’s capital expenditures decreased significantly in 2015-16 – a decrease of $11.8M, capital expenditures had increased by 2018-19.

Description
The figure represents SBAR actual expenditures (Millions) by salary, Operation & Maintenance (O&M) and capital between 2014-15 and 2018-19.
In 2014-15: overall actual expenditures totalled $74.0M. Salary expenditures were $33.6M, O&M expenditures were $17.8M and capital expenditures were $22.6M.
In 2015-16: overall actual expenditures totalled $71.0M. Salary expenditures were $38.6M, O&M expenditures were $21.6M, and capital expenditures were $10.8M.
In 2016-17: overall actual expenditures totalled $76.0M. Salary expenditures were $39.0M, O&M expenditures were $23.9M and capital expenditures were $13.1M.
In 2017-18: overall actual expenditures totalled $91.8M. Salary expenditures were $46.6M, O&M expenditures were $23.1M and capital expenditures were $22.2M.
In 2018-19: overall actual expenditures totalled $93.2M. Salary expenditures were $46.1M, O&M expenditures were 25.9M and capital expenditures were $21.1M.
During this time period, salary expenditures increased by $12.5M, O&M expenditures increased by $8.1M and capital expenditures decreased by $1.4M, when compared to 2014-15.
Challenges and unintended impacts
Special projects were not part of the planning process, were unexpected and included short timelines, putting pressure on the program to deliver on significant short-term projects while keeping up regular program business.
Delivering the special projects increased workload for staff making it difficult to plan and prioritize maintenance of existing assets.
Completing special projects created an additional pressure given the level of planning required for the reality of the program’s working environment (i.e., procurement timeframes, the requirement to hire specially trained staff and reliance on vessel and helicopter time for access to remote assets).
There was not enough capacity to deliver both on CR and FII funding, thus CR funding was deferred until FII was completed.
The announcement of the MCTS Centre consolidation 2 years into the CCS project resulted in the need to completely revise the scope and requirements for the system.
The OPP-Radar project was impacted by the already initiated radar modernization project and the scope and timeframe of the procurement of radars changed significantly, resulting in delays for the OPP-Radar project.
3.3 Availability, capability, and reliability of shore-based assets
Finding: Program representatives reported that the investments in the SBAR program have resulted in significant improvements to the condition of assets and that overall, they are available, capable and reliable.
Availability, capability and reliability of the shore-based assets
The SBAR program measures the performance of assets based on three criteria:
- Available: The percentage of time that an asset is serviceable and capable of performing its required function over the total time allotted for actual operation, maintenance, and support of that asset.
- Capable: The probability that an item can perform its intended function for a specified interval under stated conditions.
- Reliable: The asset satisfies the operational requirement.
Most program representatives indicated that the condition of SBAR assets has improved over the past few years, which is primarily due to the investments made to the program (as summarized in Section 3.2).
As illustrated below, program representatives rated the extent to which assets are available, capable and reliable fairly high, although MCTS assets were rated slightly higher than AtoN assets.

Description
The figure depicts the program representatives’ ratings of the extent to which MCTS and AtoN assets are available, capable and reliable from Not at all to A great extent. The capability for both MCTS and AtoN assets scored highest, closely followed by the availability and then by the reliability. Both MCTS and AtoN assets rated highly across the three categories, although MCTS assets were rated slightly higher than AtoN assets.
There were few differences in the ratings across regions, although AtoN assets in Western Region were rated slightly higher than those in the Atlantic and Central & Arctic Regions.
Finding: The condition of the assets and the percentage of service availability (i.e., outages) are two ways in which SBAR measures whether assets are available, capable, and reliable. There are limitations with the asset condition ratings and outage data, making it difficult to use the data to accurately measure the condition of the assets.
Asset Condition Assessment program
The management of tens of thousands of assets across remote locations in Canada requires long-term planning. To help monitor asset conditions, prioritize its work schedule and complete financial planning, SBAR developed the ACAP.
Regional data is compiled through asset condition assessment reports, which is done through a mix of paper reports, spreadsheet data, and consultant reports. This data feeds into national ACAP reports, which inform prioritization of asset LCM and nationally-led asset renewal projects.
ACAP challenges and reliability issues
ACAP reports prior to 2017-18 were either based on the last visual inspection of the assets, or on a mix of extrapolated data and best estimates based on the condition of the asset at its last visual inspection, thus may not reflect the actual condition of the asset.
Program representatives also noted that the ACAP is not standardized across regions and that it can be subjective.
ACAP ratings for AtoN assets
The ACAP ratings for AtoN assets for the period 2014-15 to 2018-19 are depicted in the figure below. The ACAP ratings include assets that are managed by MCI (e.g., short-range AtoN equipment, towers, power systems, floating aids, helipads and buildings).
During the 2014-15 to 2018-19 period, at least 60% of AtoN assets were reported to be in good or satisfactory condition.
The proportion of AtoN assets reported to need overall replacement remained largely the same throughout the five years, ranging from 17% to 21%.
The proportion of AtoN assets reported to be in the good to satisfactory category decreased by 10 percent points between 2014-15 and 2018-19.

Description
The figure illustrates asset condition assessment program (ACAP) ratings for AtoN Assets from 2014-15 to 2018-19. Assets are shown in percentages by ACAP category per fiscal year. There are four ACAP categories which range from good (new) to overall replacement (end of life).
In 2014-15, 44,692 assets were rated in the following categories: 74% were rated as either good (new) or satisfactory (normal aging) (60% and 14% respectively), while 26% of assets were rated as either asset required refurbishment work (advanced age) or overall replacement (end of life) (9% and 17% respectively).
In 2015-16, 32,244 assets were rated in the following categories: 70% were rated as either good (new) or satisfactory (normal aging) (54% and 16%, respectively), while 30% rated them as either asset required refurbishment work (advanced age) or overall replacement (end of life) (10% and 20%, respectively).
In 2016-17, 32,349 assets were rated in the following categories: 72% were rated as either good (new) or satisfactory (normal aging) (56% and 16%, respectively), while 28% were rated as either asset required refurbishment work (advanced age) or overall replacement (end of life) (10% and 18%, respectively).
In 2017-18, 31,432 assets were rated in the following categories: 60% were rated as either good (new) or satisfactory (normal aging) (39% and 21%, respectively), while 40% rated them as either asset required refurbishment work (advanced age) or overall replacement (end of life) (19% and 21%, respectively).
In 2018-19, 32,128 assets were rated in the following categories: 64% were rated as either good (new) or satisfactory (normal aging) (25% and 39%, respectively), while 36% rated them as either asset required refurbishment work (advanced age) or overall replacement (end of life) (18% and 18%, respectively).
ACAP ratings for MCTS assets
The ACAP rating for MCTS assets for 2014-15 and 2016-17 to 2018-19 are depicted in the figure below. The ACAP ratings include assets that are managed by E&I (e.g., microwave link systems, INNAV, surveillance systems and communications systems); and AtoN assets that are managed by E&I (e.g., the differential global positioning system (DGPS), lighthouse radios).
During the 2014-15 to 2018-19 period, at least 58% of MCTS assets were reported to be in good or satisfactory condition.
The proportion of MCTS assets reported to require refurbishment work or overall replacement increased by 6 percent points throughout the five years, from 36% in 2014-15 to 42% in 2018-19.
4% of MCTS assets were reported to have become out of service by 2018-19.

Description
The figure illustrates asset condition assessment program (ACAP) ratings for MCTS Assets from 2014-15 and 2016-17 to 2018-19. No ACAP data was available for 2015-16. Assets are shown in percentages by ACAP category per fiscal year. There are five ACAP categories which range from good (new) to out of service.
In 2014-15, 1,309 assets were rated in the following categories: 64% were rated as either good (new) or satisfactory (normal aging) (39% and 25%, respectively), while 36% were rated as either asset required refurbishment work (advanced age) or overall replacement (end of life) (15% and 21%, respectively).
In 2016-17, 1,275 assets were rated in the following categories: 64% were rated as either good (new) or satisfactory (normal aging) (39% and 25%, respectively), while 36% were rated as either asset required refurbishment work (advanced age) or overall replacement (end of life) (15% and 20%, respectively).
In 2017-18, 1,316 assets were rated in the following categories: 62% were rated as either good (new) or satisfactory (normal aging) (39% and 23%, respectively), while 38% were rated as either asset required refurbishment work (advanced age), overall replacement (end of life) or out of service (22%, 13%, and 3% respectively).
In 2018-19, 1,335 assets were rated in the following categories: 58% were rated as either good (new) or satisfactory (normal aging) (35% and 22%, respectively), while 42% were rated as either asset required refurbishment work (advanced age), overall replacement (end of life) or out of service (22%, 16% and 4%, respectively).
Out of service assets presented in the figure above include: the message and data system (MDS), lighthouse radios, very high frequency direction finding (VHF-DF) service, and high frequency and medium frequency (HF-MF) communications.
SBAR equipment outages
Program representatives reported that outages of SBAR assets do occur, but that there are mitigation strategies in place to minimize the impact of outages.
For MCTS, this includes having redundancy built into the systems (e.g., radar sites have 2 of all pieces of equipment, except for the antenna). For AtoN, this includes issuing NAVWARNSFootnote 7 to mariners and installing a temporary asset (e.g., different type of light) until the outage can be repaired.
AtoN asset outages
AtoN outage data is captured in the Aids Program Information System (SIPA) and is used by the AtoN program to track information related to the operation and maintenance of aids to navigation.
AtoN outages are measured against International Association of Marine Aids to Navigation and Lighthouse Authorities (IALA) directives which stipulate:
- the allowable downtime of aids to navigation over a 3-year period, and
- the failure response times for the program to initiate repairs based on the category of the aid.
Data against IALA targets are only available for the period 2015-16 to 2017-18 (IALA targets are measured over a 3 year period) and represent an aggregate of annual and seasonal aid reliability at the national level.
During this time, SIPA data shows that the program surpassed IALA targets for category 2 and 3 aids, and was less than 0.81% short of meeting the target for category 1 aids.
The table below compares AtoN asset reliability against IALA targets from 2015-16 to 2017-18.
| IALA target per aid category | AtoN asset reliability |
|---|---|
| Category 1 aids mitigate a composite threat that was rated of overriding importance, and must be reliable 99.8% of the time over a 3 year period. | 98.99% |
| Category 2 aids mitigate a composite threat that was rated highly significant, and must be reliable 99.0% of the time over a 3 year period. | 99.10% |
| Category 3 aids mitigate a composite threat that was rated as significant, and must be reliable 97.0% of the time over a 3 year period. | 99.61% |
Source: AtoN National
AtoN data reliability
Asset reliability data may be affected by the fact that the program may be unaware of asset outages until such time as visual inspections take place during scheduled maintenance, or as other CCG programs/mariners report outage.
AtoN program representatives indicated that an outage is measured as of when report of a non-performing aid is received. The outage lasts until ITS confirms that the service provided by the aid is restored in full, and the NAVWARN is cancelled.
Number and value of lost buoys
AtoN equipment outages are also measured by the number and value of lost buoys—data that is collected and compiled by MCI. The number and value of lost buoys from 2014-15 to 2018-19 are illustrated in the figure below.
Accuracy of data on lost buoys depends on receiving timely input either from the program or from other CCG programs or mariners. Lost buoys or their anchors can sometimes be retrieved using buoy tending vessels. In these cases, the buoys are not lost and their value can be recuperated, however they must be reported as lost to reflect current asset availability.

Description
The figure depicts the number and value of lost buoys between 2014-15 and 2018-19:
- In 2014-15, 554 buoys were lost (a value of $5.0M);
- In 2015-16, 452 buoys were lost (a value of $4.2M);
- In 2016-17, 486 buoys were lost (a value of $5.3M);
- In 2017-18, 556 buoys were lost (a value of $2.8M); and
- In 2018-19, 327 buoys were lost (a value of $2.1M).
A reported 2,375 buoys were lost over the 2014-15 to 2018-19 period, which represented an approximate value of $20M (not including lost moorings). This is in part attributable to the availability of CCG vessel time for equipment maintenance activities (for more on this see Section 3.5).
The number of lost buoys decreased by 227 units over the 2014-15 to 2018-19 period, from 554 to 327.
The number of buoys and moorings lost annually varies from year to year due to internal and external factors. The program uses 98 different types of buoys (plastic or metal, lit or unlit, seasonal or annual), and the value of buoys used by the program ranges from $239 to $120,000 per unit (not including the cost of chain and anchor).
MCTS asset outages
There are no readily available data on national MCTS outages. Given that the Atlantic Region E&I group has been using an internally developed Service Availability Tool to track MCTS asset performance on a quarterly basis since 2016-17, that data was used to provide an overview of Atlantic MCTS sites’ performance data covering a three-year period (2016-17 to 2018-19).
The data show the average percentage of sites that meet the MCTS service performance targets—overall, and by five types of services supported by specific groups of assets: AtoN, distress, public correspondence, safety and vessel traffic services (VTS).
MCTS outage data limitations
Given the wide variance of environmental challenges across Canada and their differing impact on asset performance, no overall conclusions can be drawn from this data beyond the CCG’s Atlantic Region.
MCTS Atlantic sites’ performance data results
The table below outlines Atlantic MCTS asset performance from 2016-17 to 2018-19. Overall, the percentage of sites that meet the performance targets has been increasing over three years, reaching 87% in 2018-19 from 64% in 2016-17.
The availability of services in each of the five categories has also improved over the three years, with the distress services improving the most significantly and the VTS services remaining the least available, despite an overall improvement of 25 percent points over three years.
| Service type | Performance target | Sites that meet target (%) 2016 - 17 | Sites that meet target (%) 2017 - 18 | Sites that meet target (%) 2018 - 19 | Performance range for remaining sites |
|---|---|---|---|---|---|
| AtoN (e.g., DGPS) | ≥ 99.5% of the time | 100% | 100% | 100% | n/a |
| Distress (e.g., Channels 16 and 70, DSC 2182) | ≥ 99.7% of the time | 43% | 54% | 83% | 99.62-99.68% of the time |
| Public Correspondence (e.g., VHF, MF) | ≥ 99.0% of the time | 82% | 97% | 94% | 96.62-98.83% of the time |
| Safety (e.g., CMB (EN), CMB (FR), MF Broadcast, NAVTEX) | ≥ 99.5% of the time | 52% | 71% | 88% | 96.62-99.49% of the time |
| VTS (e.g., Working channel, radar, INNAV, AIS, Camera) | ≥ 99.7% of the time | 45% | 58% | 70% | 96.73-99.7% of the time |
| Overall | - | 64% | 76% | 87% | - |
Source: ITS – E&I Atlantic
A few sites in the Atlantic region provide AtoN DGPS services, meeting the performance targets in 100% of cases. The DGPS has an ACAP rating of “overall replacement,” and the program is working on a replacement solution.
MCTS asset outages by cause
The Atlantic E&I group also tracks MCTS outage times by cause.
The data includes the percentage of outage time by six key causes: lightning strikes, maintenance, MCTS equipment outages, power outages, third-party telecommunications outages and weather delays, over a three year period (2016-17 to 2018-19).
MCTS Atlantic asset outage results
The figure below illustrates the percentage of Atlantic MCTS outage time by cause from 2016-17 to 2018-19. The predominant cause of outage time over the three years is the failure of 3rd party telecommunication providers’ equipment. Even though the outage time due to this factor has decreased by 21 percent points over three years, it is still significant (see figure below).
The percentage of outage time due to MCTS equipment failure has increased by 9 percent points over the three years. This indicates that, despite the overall improved performance, there is still MCTS equipment that needs to be more reliable, capable and available. This is consistent with what SBAR program and client representatives reported.

Description
The figure depicts the percentage of the Atlantic region’s MCTS outage time by cause, from 2016-17 to 2018-19.
In 2016-17, 87 outages were caused as follows: 6% due to lighting strikes, 1% due to maintenance, 21% due to MCTS equipment outages, 9% due to power outages, 62% due to third-party telecom outages, and 1% due to weather delay.
In 2017-18, 87 outages were caused as follows: 1% due to lighting strikes, 8% due to maintenance, 29% due to MCTS equipment outages, 16% due to power outages, 43% due to third-party telecom outages, and 3% due to weather delay.
In 2018-19, 97 outages were caused as follows: 30% due to MCTS equipment outages, 19% due to power outages, 41% due to third-party telecom outages, and 10% due to weather delay.
MCTS outage data limitations
Note that the increased percentage of outage time may also be due to the time that is required to bring the equipment back to functionality, which may be affected by external factors such as weather conditions, power failures and availability of vessel/helicopter time.
MCTS asset outages attributable to CCS and third-party telecommunications providers
National data on MCTS outages as it relates to the CCS and third-party telecommunications equipment is available for a portion of the period 2016-17 to 2018-19, and is depicted in the figure below.

Description
The figure depicts the national MCTS asset outages that are attributable to Communication Control Systems (CCS) and Third-party telecom service providers, between June 2016 and April 2018.
Between June and September 2016, 188 asset outages occurred: 50% were due to third-party telecom service providers and 41% to CCS.
Between October and December 2016, 490 asset outages occurred: 50% were due to third-party telecom service providers and 13% to CCS.
Between January and March 2017, 483 asset outages occurred: 60% were due to third-party telecom service providers and 9% to CCS.
Between April and June 2017, 345 asset outages occurred: 70% were due to third-party telecom service providers and 14% to CCS;
Between July and September 2017, 341 asset outages occurred: 65% were due to third-party telecom service providers and 8% to CCS.
Between October and December 2017, 549 asset outages occurred: 65% were due to third-party telecom service providers and 4% to CCS.
Between January and March 2018, 461 asset outages occurred: 65% were due to third-party telecom service providers and 3% to CCS.
Finally, 368 asset outages occurred in April 2018: 60% are due to third-party telecom service providers and 3% to CCS.
Although there is no notable trend related to the total number of outages over the 2016-17 to 2018-19 period, the data suggests that:
- Initial CCS outages represented 41% of all documented outages, and outages due to CCS decreased from 41% to 3% by early 2018-19 as initial technical issues were resolved. This is in line with recorded challenges associated with the implementation phases of the CCS modernization project and the MCTS Centre consolidation.
- Outages due to third-party telecommunication providers represent 50% or more of all MCTS documented outages. This is in line with other evidence collected from interviews, site visits, and case studies.
MCTS outage data limitations
The data on MCTS outages at the national level is limited to the period from July 2016 to April 2018 only, and mainly reported over 3 month periods. This data is not regularly collected and compiled, and was only collected and analyzed in response to a request for information on the reliability of CCS. In addition to the number of outage reports, it was possible to track two causes of MCTS equipment outages: issues with CCS, and issues with third-party telecommunications providers.
3.4 Client service and innovation for shore-based assets
Finding: Service level agreements between ITS and its clients are either not in place or out of date. Despite this, clients indicated that ITS provides high quality services and meets expectations for the provision of service. In addition, ITS staff are highly skilled and knowledgeable and have identified and implemented innovative solutions to ensure the ongoing performance of assets and to find cost savings.
Service level agreements
A service level agreement (SLA) was put in place between ITS and MCTS in 2010, which was revised in 2013. The agreement outlines targets for service availability and service standards.
Both ITS staff and MCTS program representatives indicated that this SLA is not really in use and no longer relevant, as it is outdated.
There is no SLA in place between ITS and AtoN, although the AtoN Directives contain service levels for AtoN assets, which are based on standards set by the IALA.
Both ITS and client program representatives agreed that SLAs need to be put in place for the AtoN and MCTS programs.
Meeting of client expectations
The figure illustrates ratings of the extent to which expectations are met for MCTS and AtoN clients. MCTS clients rated the extent to which expectations are met for service slightly higher than AtoN clients.

Description
The diagram depicts how MCTS and AtoN clients rated the extent to which expectations are met for service, from Not at all to A great extent. Both results are high and the MCTS clients gave a slightly higher rating than AtoN clients.
As noted, there are issues with respect to the reliability of data to measure the performance of assets. In addition, there is no consistent approach in place for reporting on the extent to which service availability targets are met.
The setting and meeting of expectations for service availability appear to be largely based on the relationship between ITS and the programs, as program representatives noted that there are good working relationships between ITS and its clients.
Client program representatives rated the meeting of expectations for asset maintenance very high.
In addition, program clients noted that ITS staff have a very high level of skills and knowledge and they have a high level of satisfaction with services provided by ITS.
If expectations for service are not met, clients indicated that it is often due to factors outside of ITS’s control (e.g., availability of vessel time, weather-related issues and reliance on 3rd party providers), although some noted that sometimes service expectations are not met are due to the capacity of ITS (e.g., HR resources, financial resources, dependency on Public Services and Procurement Canada (PSPC) for procurement).
ITS program representatives are always working to find innovative solutions to ensure that assets are available, capable, and reliable and to find cost savings with respect to their life cycle management. A sample of a few of the innovative solutions are shown below.
Sample of innovative solutions implemented by ITS*
- When decommissioning old equipment and assets, parts are salvaged and kept as spares to fix older assets, for which replacement parts are difficult or impossible to obtain.
- Installation of solar power where possible to use greener technology and reduction of reliance on diesel generators, which saves on fuel costs and helicopter time for refueling and reduces the CCG’s ecological footprint.
- The construction or use of modular equipment (fixed aid towers, buildings, lighthouses), which can be pre-fabricated and then erected on-site, reducing labour and travel costs.
- The design of a four-season buoy for use in the St. Lawrence River will provide lighted buoys on a year-round basis, optimize the summer navigation season and reduce the amount of vessel time needed to maintain buoys.
- Prioritization of asset replacement or maintenance is done based on an area, rather than a site. This allows for work to be done on multiple assets at the same time, across different neighbouring sites, which results in cost savings (i.e., coordination of vessel support and technicians, bulk purchasing).
- Standardization of equipment (in particular for electronics equipment) across sites, which results in cost savings for acquiring and maintaining the assets (e.g., all staff are trained on the same assets, all know how to fix regardless of location, bulk purchasing).
- Implementation of remote monitoring of MCTS sites, which can reduce travel and labour costs and signal when maintenance is required.
*Not intended to be an exhaustive list
3.5 Challenges ensuring that shore-based assets are available, capable and reliable
Finding: While the investments in the SBAR program have improved the condition of assets, there are ongoing challenges in ensuring that assets are available, capable and reliable. Some of these challenges are operational, while others are outside of the control of ITS.
Reliance on Canadian Coast Guard assets
As the majority of assets are in remote, difficult to access locations, ITS is very reliant on CCG vessels and helicopters to service SBAR assets (e.g., to transport technicians and equipment, for refueling generators, for buoy tending).
Program representatives reported that the availability of CCG vessels and helicopters is a significant constraint in managing the assets. Helicopter time is particularly an issue for Western Region as it has the most remote sites that require helicopter access.
Vessel and helicopter data limitations
The program does not track how much vessel or helicopter time it requests each year based on its needs, and Fleet Operations currently only track planned time to be provided, therefore assessing whether the program’s regional needs are met in terms of CCG assets was not entirely possible.
Vessel time data
Even when the program has secured vessel or helicopter time, the CCG may have to prioritize other fleet activities. When time is received, it may not be as planned, which requires ITS to adjust its workplan.
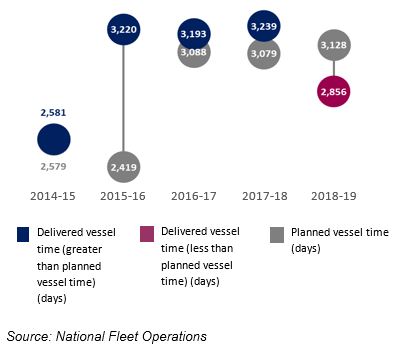
The figure below illustrates SBAR planned and delivered vessel time (days) from 2014-15 to 2018-19. National data on vessel time indicates that, overall, there have been no shortages of delivered vessel time in comparison to the planned vessel time, except in 2018-19.
The fleet renewal program, which was announced in May 2019, is expected to address challenges with respect to the availability of CCG vessels.
Description
The figure depicts SBAR planned and delivered vessel time, in days, from 2014-15 to 2018-19.
In 2014-15: 2,581 days of vessel time were delivered compared to 2,579 planned days.
In 2015-16: 3,220 days of vessel time were delivered compared to 2,419 planned days.
In 2016-17: 3,193 days of vessel time were delivered compared to 3,088 planned days.
In 2017-18: 3,239 days of vessel time were delivered compared to the 3,079 planned days.
Finally, in 2018-19, there was a shortage in delivered vessel time with 2,856 days compared to the 3,128 days planned.
However, there are indications that there have been shortages, particularly in the St. Lawrence and Great Lakes areas, as there have been instances where vessels were not available to remove the buoys before the winter season and buoys have been lost or damaged.
The four-season buoy project is intended to address this issue in the St. Lawrence area, as it will decrease the amount of CCG vessel support required.
Overall, allocated vessel time is mostly in support of AtoN assets, with up to 19% of delivered vessel time in support of MCTS assets.
Although the C&A region received less vessel time than planned in 3 of the 5 years, C&A received more vessel time than the Atlantic and Western regions combined in 4 out of 5 years.
Additional helicopter time data limitations
Planned helicopter time data is available for only four years of the five-year period. Only the delivered helicopter data on a monthly basis was available for 2015-16. This data was excluded from the analysis due to issues with data consistency.
The data source files were all in different formats, thus, there might be issues with accuracy and/or comparability of the data.
The data does not include chartered helicopter time.
Chartering in the Western Region
As unavailability or delays in planned CCG asset time can have significant impacts on project timelines, the Western Region had to charter helicopters and tug and barges to ensure project timelines were met. Charter costs totaled $4.2M for the Western Region over the 2017-18 to 2018-19 period.
| Fiscal year | Helicopter charter costs | Tug and barge charter costs |
|---|---|---|
| 2017-18 | $537,072 | $2,373,434 |
| 2018-19 | $470,995 | $822,806 |
Source: ITS – Western Region
Helicopter time data observations
The overall planned helicopter time increased, nationally, from 2014-15 to 2018-19, as illustrated in the figure below for planned helicopter time (days) by region (Atlantic, Central & Arctic and Western from 2014-15 to 2018-19).

Description
The figure depicts the SBAR planned helicopter time in days by region (Atlantic, Central & Arctic and Western) for 2014-15 and from 2016-17 to 2018-19. Planned helicopter data for 2015-16 was excluded from the analysis due to issues with data consistency.
In 2014-15, 3,103 days were planned: 28% in the Atlantic, 43% in the Central & Arctic, and 29% in the Western region.
In 2016-17, 2,828 days were planned: 34% in the Atlantic, 32% in the Central & Arctic, and 35% in the Western region.
In 2017-18, 4,077 days were planned: 20% in the Atlantic, 29% in the Central & Arctic, and 51% in the Western region.
Finally, in 2018-19, 3,894 days were planned: 28% in the Atlantic, 32% in the Central & Arctic, and 39% in the Western region.
While the planned time for the Atlantic Region is relatively steady over the five years (varying within the range 800 to 1,100 days), the planned time for the C&A and Western Regions increased from 2016-17.
The Western region received more planned helicopter time than the other regions, with the peak of the planned time in 2017-18, triple what it was in 2016-17.
Geography and weather
Some asset outages can be attributed to environmental factors. As noted, many sites are remote and are often difficult to access, so it may take time to address an outage given the logistical factors that need to be addressed (e.g., coordinating technicians, contractors, vessels or helicopters).
In addition, access to sites is also weather dependent and rain, snow, wind, and ice conditions can impact the ability to access sites and conduct maintenance. Presence of wildlife, especially endangered species, can also pose challenges in accessing sites.
Geography and weather can be particularly challenging in the Arctic and often outages and equipment issues take longer to address.
These factors add a large cost to the maintenance of assets and often getting to a site can account for a large proportion of the maintenance budget.
Reliance on third-party telecommunications providers
Marine communications, for the most part, are networked through outdated land-based telephone lines. These land lines are maintained by third-party service providers (e.g., Bell, Telus), which have themselves moved to fiber optic lines, making repairs and maintenance costly.
When the service provider experiences outage issues, it affects the marine communications network and ITS does not have any control over the restoration of service.
The objective of the OPP-OpNet project is to convert the land-based lines to fiber optic, which will modernize the network and improve its reliability. This is expected to reduce the number of outages attributable to third-party telecommunications providers as well as costs.
Condition of assets
While program representatives believe that investments in the SBAR program have improved the condition of assets, they do not feel that the program is yet at the desired baseline because the program was so significantly below the baseline prior to the investments made and because other planned work was displaced by short-term focus on the special projects (e.g., CCS project).
Program representatives noted that there are still assets that are in poor condition or at end of life, including AtoN assets, towers, power systems, buildings, transmitters, software (INNAV, Sytar), direction finders, and the differential global positioning system.
Workload and resources
As previously noted, the significant investments in the SBAR program increased the workload. Program representatives noted that because the special projects (e.g., OPP, FII) were time limited, they had to take precedence over regular program business. This made it difficult to plan and prioritize the maintenance of existing assets.
In addition, much of the investment was in the form of capital expenditures. Even with the increase in FTEs received through CR, program representatives noted that there was a shortage of FTEs to address the special projects and the regular workload.
Recently, a few business cases have been approved that will increase the number of FTEs in ITS, which will help address some of the pressures related to staffing shortages.
Space
ITS is responsible for storing equipment and consumable material for CCG vessels. There are five large warehouses that are primarily used for storing this material, although these warehouses also receive and store some equipment for the SBAR program.
In addition to the five large warehouses, ITS has a number of different storerooms, which are used to store SBAR equipment and assets.
The increase in workload and the addition of FTEs has resulted in a shortage of space both for employee offices and for equipment storage across all regions.
As a result, assets and equipment are sometimes stored in warehouse and other storage area aisles, in temporary storage containers or shelters outside on CCG property, or in rented facilities off-site. This adds to the challenges of managing asset inventory.
Electronics equipment is sometimes housed in equipment rooms that could be subjected to water discharge from a building sprinkler system in the case of a fire due to lack of alternative space (e.g., MCTS Victoria equipment room).
In addition, some of the program’s office space (e.g., CCG Victoria Base) is in need of modernization to accommodate for an increase in staff of female gender and for staff with disabilities.
3.6 Application of the life cycle management approach
Finding: A national asset management system is in place to manage the CCG’s physical assets. The system is not being used as intended, which is affecting the availability and reliability of data required to effectively manage asset inventory and the ability to plan asset purchasing. It will also affect the CCG’s ability to transition to an accrual-based budget framework. ITS has been working to improve system use; however, the implementation of a new DFO financial system raises questions as to the future use of the current system, including level of continued resource required.
Asset management system
ITS uses the asset management system (AMS) to manage its physical assets, which includes two systems: Maximo for shore-based assets and small vessels; and MAINTelligence for large vessels.
In 2014, the CCG Management Board decided that Maximo would be used for the management of all of the CCG’s physical assets and starting in April 2016, a project was initiated to transition large vessels to Maximo.
Maximo provides a single national asset management system for three aspects of SBAR asset management, each with its own application:
- Inventory application: all assets are to be entered into Maximo using a pre-defined asset breakdown structure.
- Maintenance application: all work performed on CCG assets is to be initiated, scheduled and tracked in Maximo.
- Purchasing application: all requisitions for purchasing are to be initiated in Maximo.Footnote 8
Technical Management, ITS is the functional authority for the AMS and is responsible for providing functional guidance and support to SBAR for Maximo.
Maximo challenges and limitations
The level of detail and explanation provided in guidance documents are reported to be insufficient by program representatives, and not all documentation appears to be up to date.
Program representatives report that the inventory application has not been set up correctly and it is difficult to find items in the system.
Program representatives report that it is time consuming to use the system and that there are limited resources to support the management of the system.
AMS officers do not have access to ABACUS and have not taken training, so cannot provide support on the system.
The level of change management required to ensure use of the system was underestimated and not all staff are using the system.
As a result, though the program entered some of their inventory into Maximo in late 2018Footnote 9, not all program assets have been entered in Maximo and the system is generally not being used to initiate purchasing.
Work undertaken to address challenges and limitations
Since implementing the inventory and purchasing applications, Technical Management (TM) has created additional support and made guidance documents available.
A main AMS functional group, supported by working groups with representation from all regions, maintains the system application to support the program’s ongoing needs, functionality requirements and user priorities.
AMS Officers are available both at the national and regional levels to provide system support to Maximo users.
A Supply Chain Management group is also available to provide key logistic support for all phases of the LCM system, including creating new assets in the system application.
Within the Supply Chain Management Group, a Material Identification Centre of Excellence (MICOE) was established in 2018. MICOE is responsible for building a catalogue of item masters for SBAR assets in Maximo and adding new assets to the system, as needed. The group has been working to improve consistency in the way in which assets are entered into the system.
A contract is being put in place to address issues with respect to the naming conventions and inconsistency in data currently in the system.
Additional search functions have been added to facilitate finding equipment in the system.
Maximo Mobile is being looked at as a solution to increase system accessibility for technicians while working in the field.
Transition to accrual-based budget framework
To support the development of a business case to secure funding for the department’s capital assets covering a timeframe for the next 20 years, ITS will be required to provide detailed planning and costing for the full LCM of its asset base, including estimated depreciation.
DFO-CCG will be moving to an accrual-based budget frameworkFootnote 10 to manage its capital assets and will migrate from a cash-based 5-year planning timeframe to a 20-year accrual-based framework.
This new approach will allow the department to secure long-term funding for its capital assets.
The department is planning to implement this new framework as of April 1, 2021.
To support implementation, all DFO-CCG programs will be required to articulate their needs for the next 20 years.
Implementation of a new financial system at DFO
DFO-CCG currently uses ABACUS (Oracle Financials) as its financial system and Maximo is linked to ABACUS for the purchasing of new assets and for inventory valuation purposes.
The Government of Canada is modernizing financial operations and has identified SAP as the prescribed Government of Canada standard for financial systems. The goal is to migrate all Canadian Government Financial systems and processes to SAP by 2025.
DFO-CCG will be migrating to SAP by April 1, 2021. A special project team within the Chief Financial Officer (CFO) Sector has been established to support the implementation of SAP. The team is responsible for determining how existing DFO/CCG systems, including Maximo, will be integrated with SAP.
Finding: It has been challenging for program staff to apply a life cycle management approach to SBAR assets, and although some efforts are being made to address gaps and challenges with its implementation, improvements to the life-cycle management approach are still ongoing.
Life cycle management for shore-based assets
As noted, the SBAR program uses a life cycle management approach for the management of assets (as shown on the figure depicted in Section 2.4).
As previously noted, the SBAR program experienced a period of little investment during a 5-year period, as well as a decline in FTEs. When investments were made in the program, most of it was directed to salary, not capital or O&M.
During both periods, the program prioritized its resources on the assets that were in most critical condition or to projects that had a limited timeframe for completion.
Preventive versus corrective maintenance
Due to a shortage of resources and increases in workload, program representatives indicated that, in the past, the focus has been on corrective maintenance versus preventive maintenance.
Program representatives reported that the investments have helped them start moving to a more proactive versus reactive approach.
Maintenance data limitations
Although national Maximo data exists, it’s reported to be unreliable. As the Atlantic region was an early adopter of Maximo and consistently use the system as intended, Maximo data for the Atlantic region only is presented to give an overview of one of the reporting benefits of Maximo use.
Maintenance data
Description
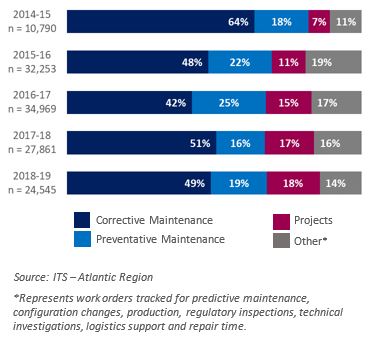
The figure depicts the volume (%) of ITS Atlantic region work orders, by corrective maintenance, preventative maintenance, projects or other activity type from 2014-15 to 2018-19. Other activity types include orders tracked for predictive maintenance, configuration changes, production, regulatory inspections, technical investigations, logistics support and repair time.
In 2014-15, 10,790 work orders were recorded: 64% for corrective maintenance, 18% for preventative maintenance, 7% for projects, and 11% other.
In 2015-16, 32,253 work orders were recorded: 48% for corrective maintenance, 22% for preventative maintenance, 11% for projects, and 19% other.
In 2016-17, 34,969 work orders were recorded: 42% for corrective maintenance, 25% for preventative maintenance, 15% for projects, and 17% other.
In 2017-18, 27,861work orders were recorded: 51% for corrective maintenance, 16% for preventative maintenance, 17% for projects, and 16% other.
In 2018-19, 24,545 work orders were recorded: 49% for corrective maintenance, 19% for preventative maintenance, 18% for projects, and 14% other.
The figure on the right depicts ITS Atlantic region work orders by activity type (%) from 2014-15 to 2018-19, including corrective maintenance, preventive maintenance, projects or other.* The volume of work orders in the Atlantic region has more than doubled since 2014-15, increasing from 10,790 to 24,545 over the five-year period.
Maximo data show that more efforts (e.g., labour time and costs, number of work orders) are still spent on corrective versus preventive maintenance in the Atlantic region.
Furthermore, Maximo data show that projects stemming from special investment have been time-intensive for the program, increasing from 7% to 18% for the Atlantic region alone over the 5-year period.
Observations with respect to life cycle management
SBAR has not been considering all aspects and costs related to the entire life cycle of the asset when making new acquisitions. Program representatives reported that more emphasis is being placed on this now and TM plays a role in reviewing project proposals to ensure that all aspects are being considered during the conception and acquisition phases (e.g., including the costs of maintenance, training and disposal in the procurement process).
There is a governance structure in place to support prioritization for the acquisition and maintenance of assets. This includes National Managers Steering Committees, Technical Executive Board (TEB), and Management Board. Priorities for preventative maintenance, corrective maintenance, and upgrades are identified and brought to the various governance committees. Ultimately, TEB is the body that makes the funding allocation decisions. Program representatives report that this governance structure is effective for decision-making with respect to SBAR assets.
Overall the prioritization process for asset management varies by region and function and is based on a number of different inputs, including ACAP. Program representatives identified limitations with the ACAP tool; primarily that ACAP is not standardized and is not used consistently across all regions. ITS is starting to review the methodology to identify improvements.
Disposal can be challenging due to certain factors: it is the lowest priority in terms of workload priorities, some end of service assets are stripped for spares rather than disposed of (i.e., to keep existing assets functioning when asset replacement is not financially possible), and finding suppliers to recycle certain assets (e.g., plastic buoys with no recycling stamp, especially those with Styrofoam components) can be difficult.
With respect to gender-based analysis plus, some program representatives indicated the SBAR program ensures that Indigenous groups are engaged, as needed. This may include consultation with groups when accessing assets that are on, or require passage through, Indigenous lands, and obtaining input on the planning of, and the level of monitoring needed for, new sites or site upgrades.
Procurement delegation limits and processes
PSPC holds the delegation for the purchase of goods for the Government of Canada and gives federal departments a $25K delegation.Footnote 11
DFO has given responsibility centre managers a $10K delegation for the purchase of goods,Footnote 12 thus SBAR managers can purchase equipment valued under $10K (including taxFootnote 13) without using DFO’s procurement hub or PSPC.
For purchases between $10-25K, the DFO procurement hub must be involved with putting a contract in place for the purchase of the goods. For purchases over $25K, PSPC must be involved with putting the contract in place, which requires a 40-business day tendering process.Footnote 14
Standing offers can be put in place for goods that are purchased on a regular basis. If the standing offer is set up by DFO, responsibility centre managers can make a call-up against the standing offer up to the stated limit. Standing offers for goods are generally put in place by PSPC.
Once in place, a responsibility centre manager can make a call-up against a standing offer without the involvement of the DFO procurement hub or PSPC.
For goods needed prior to the end of the fiscal year (March), the requirements for contracting are due by the end of November to ensure that there is sufficient time to process the requirement. The DFO procurement hub can process contracts after this deadline, however it places priority on requests received before the deadline.
DFO procurement offers a procurement 101 training course, which is available in all regions.
In March 2019, the DFO procurement hub changed its service delivery model to create sector-specific teams, including a special team for CCG goods and construction. This change was announced in October 2019 and is intended to improve relationships with clients; improve the understanding of client business; and provide support for multi-year procurement planning, prioritization and monitoring.
Challenges with the procurement process
Program representatives reported procurement as one of the biggest challenges in maintaining SBAR assets, indicating that a large amount of equipment costs between $10K-$25K, is specialized, and is often proprietary.
In addition, program representatives reported that the procurement process is very long, that the contracting deadline in November poses constraints, and that standing offers cannot be set up for certain pieces of equipment.
To address these challenges, program representatives suggested that a higher delegation limit be provided and that better processes need to be established with the DFO procurement hub.
As noted, a special procurement team has recently been established to provide support for the purchase of CCG goods. However, the team indicated that the team’s current capacity is for responding to contract requests, and there will be limited ability to support a more strategic approach to contracting (e.g., developing tools, long term-planning).
Procurement data limitations
Although procurement initiation dates and contract award dates were available through the DFO finance system, analysis on the length of time taken to process requests was not possible due to limitations with the current DFO finance system.
Procurement data analysis
The DFO procurement hub processed 120 requests for program goods with a value between $10K and $25K over the period 2014-15 to 2018-19.
As illustrated in the figure below, 38% of requests were sole source contracts and 62% were competitive contracts. Of the 62% that were awarded competitively, five instances were call-ups against standing offers, and 69 requests went to bids.

Description
Two pie charts depict SBAR procurement requests for goods by type from 2014-15 to 2018-19.
In the left pie chart, of 120 procurement requests, 38% were sole source contracts while 62% were competitive contracts. In the right pie chart, of the 62% competitive contracts, 6% were call-ups against standing offers and 94% went to bids.
4.0 Conclusions and recommendations
Investments in the Shore-based Asset Readiness program
Following a 5-year period of little investment and a decrease in FTEs, the SBAR program was facing a number of program pressures, including limited capacity to apply a life cycle management approach to assets, deteriorating condition of assets, and increased risk of critical asset outages.
Between 2014-15 and 2018-19 the program received significant investment to address program pressures with the aim to bring assets back up to the desired baseline. The investments totaled $1,928M and included increases to capital, salary and O&M, and funding for special projects.
The large investments in the program created challenges, as the special projects funded were not part of the planning process, were unexpected and included short timelines. This put pressure on the program to deliver on significant short-term projects while keeping up regular program business.
Condition of the shore-based assets
The investments in the program had significant impacts as they resulted in critical improvements to assets and equipment that were at end of life, allowed for the modernization of assets, increased the number of program FTEs, and allowed for the completion of a number of gap analyses and studies.
Program representatives reported that the condition of assets that have received investment has improved as a result of the investments, however, there are ongoing challenges in ensuring that assets remain available, capable and reliable.
These challenges include the availability of CCG vessels and helicopters, the remote location of many assets and associated weather conditions, and the reliance on third-party telecommunications providers for the marine communications network. In addition, although the investments allowed for significant improvements, the program is not yet at its desired baseline as some assets are reportedly still in poor condition or at end of life.
Measuring the performance of the shore-based assets
The SBAR program currently uses the ACAP to rate the condition of shore-based assets. The program had limited capacity to conduct visual inspections of assets prior to 2017-18 and rated conditions of assets were based on a combination of the last visual inspection and best estimates of their condition. Thus ACAP data prior to 2017-18 likely did not reflect the actual condition of assets.
There are also limitations with the ACAP methodology, including that it is not being applied consistently across the regions.
Service availability (i.e., the percentage of time assets are in service) is an indicator of asset availability and reliability. Data on service availability is not collected consistently across regions and programs and the data that are currently being collected are unreliable due to a number of factors.
Given these limitations, it is difficult to use the data to accurately measure the performance of the assets.
Recommendation #1: The CCG should put in place standard methodologies to collect data on asset conditions and service availability to support ongoing measurement of asset performance; and establish roles and responsibilities for collecting the data.
Expected targets for service availability for the shore-based assets
ITS is responsible for maintaining AtoN and MCTS assets and have mitigation measures in place to minimize outages of those assets. ITS staff have a very high level of skills and knowledge and meet expectations for service with respect to the maintenance of assets.
Service level agreements between ITS and its clients are either not in place or out of date. Therefore, there are no agreed upon expected targets for service availability of SBAR assets. In addition, there is no standardized process in place to report on the extent to which service availability targets are met.
Recommendation #2: The CCG should clarify the expected targets for service availability for SBAR assets, including the approach for prioritizing maintenance; and establish a consistent method for reporting on performance against those targets at a national level.
Life cycle management of shore-based assets
ITS uses a life cycle management approach for the management of assets to ensure that they meet reliability and availability requirements, while minimizing costs. During a period of limited investment and a decline in FTEs, the program had to prioritize addressing out of service assets rather than regularly maintaining the assets to prevent outages (i.e., reactive rather than proactive mode). In addition, when special investments in the program were made beginning in 2015-16, the priority was placed on completing those special projects, as they were time limited.
In addition to improvements to the condition of assets, program representatives reported that the investments in the program have started to allow for better application of the LCM approach (i.e., using a more proactive approach for asset maintenance).
Asset management system for shore-based assets
To support the LCM of assets, SBAR uses an asset management system (i.e., Maximo). The system is not being used as intended, in part, because program representatives find the system time consuming and difficult to use and there is a lack of business rules to guide the use of the system.
ITS has been working to provide more support and guidance to system users, however, the system currently does not contain all SBAR assets and it is largely not being used to initiate asset purchasing via DFO’s financial system (ABACUS). This is affecting the program’s ability to effectively manage asset inventory and establish its inventory valuation—information which will be important to support DFO’s move to an accrual-based budget framework.
In addition, DFO will be migrating to a new financial system (SAP) on April 1, 2021. SAP does have similar functionalities as Maximo, however, it is not yet known what impact the implementation of SAP will have on Maximo.
Recommendation #3: The CCG should identify and implement ways to improve the availability and reliability of asset inventory data in Maximo to support the life cycle management of SBAR assets.
Procurement of shore-based assets
As part of the LCM approach, SBAR is responsible for identifying requirements for equipment and assets and for completing the acquisition process. Procurement was identified as one of the biggest challenges in managing SBAR assets, particularly due to the large number of assets for which SBAR is responsible and because equipment is specialized and often proprietary.
The program’s assets (including spare parts) are not all currently being entered into Maximo, which affects the program’s ability to plan for asset purchasing. In addition, the program reported challenges with the procurement process, including that it is long and that standing offers cannot be set up for certain pieces of equipment.
A special procurement team within the DFO Procurement Hub has recently been established to support the CCG with the procurement of goods. However, the team is currently focused on responding to procurement requests and will have limited capacity to provide support for a more strategic approach to contracting.
Recommendation #4: The CFO Sector and the CCG should collaborate to review and identify where improvements could be made to the current procurement processes, tools, and support that are available for the in-service maintenance of assets.
Appendix A – SBAR evaluation matrix
| Evaluation question | Indicators |
|---|---|
| Effectiveness | |
| Q1. To what extent have financial and human resources been invested in support of SBAR over the last ten years? | 1.1 Description of financial and HR resources invested over the last ten years, including trends over time. |
| 1.2 Description of key risks/opportunities based on current financial and HR resources. | |
| Q2. To what extent has SBAR ensured that shore-based assets are available, reliable and capable to support CCG clientsFootnote 15? | Preventive maintenance analysis |
| 2.1 Existence of an asset maintenance prioritization process is in place to ensure that departmental outcomes are met. | |
| 2.2 The existence/availability of up to date Asset Management plans by region and by fiscal year over the last five years. | |
| 2.3 Proportion of and trends in expenditure for preventive maintenance activities that were completed, disaggregated by asset class, region, and fiscal year over the last five years. | |
| 2.4 Number and trends in expenditures for corrective maintenance actions carried out by asset class, region, and fiscal year over the last five years, and analysis of the conditions/causes for these actions. | |
| 2.5 Proportion of corrective maintenance actions for which a technical solution for restoring the asset reliability was recommended/implemented. | |
| 2.6 Increased mean time between failures (Source: 2012 Performance Measurement Framework). | |
| 2.7 PIP Indicator (CR): Increase in value ($) spent on preventive maintenance. (Target of $8.1M by March 2019). | |
| Asset condition analysis | |
| 2.8 PIP Indicators: Average condition rating of shore-based assets disaggregated by asset classes or ITS group, regions, and fiscal year over the last five years. (PIP targets vary by asset classes or ITS groups). | |
| 2.9 Number and proportion of assets rated as obsolete/end of life (rated 4) disaggregated by asset class, region and fiscal year over the last five years. | |
| 2.10 ITS Staff and CCG clients’ views on the availability, reliability and functional capability of the assets. | |
| SBAR ability to meet service level agreements and address client needs | |
| 2.11 The existence/availability of up to date Service Level Agreements for SBAR clients (AtoN and MCTS) by fiscal year over the last five years. | |
| 2.12 Evidence of whether targets established in Service Level Agreements have been met, by asset class, region and fiscal year over the last five years. | |
| 2.13 CCG clients’ views regarding whether SBAR staff have the technical skills to address their current and future needs. | |
| 2.14 Number and average duration of outages for MCTS critical equipment disaggregated by type of asset, region and fiscal year over the last five years. | |
| 2.15 Number and average duration of outages for AtoN critical assets disaggregated by type of asset, region and fiscal year over the last five years. | |
| 2.16 Number of accidents/incidents related to aids to navigation disaggregated by region and fiscal year over the last five years. | |
| 2.17 Number and value of lost buoys disaggregated by region and fiscal year. | |
| Q3. What have been the impacts of specific investments (i.e., World-Class Tanker Safety System Initiative, Federal Infrastructure Initiative, Comprehensive Review) on SBAR’s ability to meet its objectives and expected outcomes? | 3.1 Evidence of impacts stemming from additional sources of funding in support of SBAR’s activities. |
| Q4. What are the factors (internal or external to CCG) that have facilitated or hindered SBAR’s ability to meet its objectives? | 4.1 Stakeholders’ views regarding factors that have facilitated or hindered SBAR’s ability to meet its objectives and address CCG client needs. |
| 4.2 Budget Availability: Analysis of expenditure variations disaggregated by ITS group, type of expenditure, and region over the last five years. | |
| 4.3 Difference between financial ask by ITS for SBAR to final funding allocated by CCG. | |
| 4.4 Vessel/helicopter time availability: number of hours/days and proportion of vessel time dedicated by CCG Operations to the maintenance of shore-based assets by region and fiscal year. | |
| 4.5 Staffing/Training: Evidence of challenges associated with recruitment, retention and technical training of staff. | |
| Q5. To what extent is SBAR on track to achieve the milestones and key outputs of the OPP sub-initiatives under its responsibility? | 5.1 Assessment of project implementation and progress on meeting milestones and key outputs (as of 2018-19). |
| 5.2 Views on the extent to which CCG is positioned to achieve its milestones and key outputs. | |
| 5.3 PIP Indicator for OPP: By 2021, 90% reduction in the number of network communication outages. | |
| 5.4 Evidence of factors specific to the OPP context which may have an impact on SBAR/CCG’s ability to achieve its milestones and key outputs. | |
| Efficiency and economy | |
| Q6. To what extent has ITS developed and implemented sound management practices, processes, systems, tools and technical solutions to ensure an efficient and economical use of its resources and assets in the delivery of SBAR? | 6.1 Stakeholders’ views and evidence that policies, processes, systems, and tools are in place to support the efficient acquisition, maintenance and disposal of assets (e.g., inventory management system, technical guidelines for regional offices, client request management system). |
| 6.2 Evidence that projects are delivered on time and budget. | |
| 6.3 Number and proportion of requests approved by the Change Configuration Committee by region and fiscal year over the last five years. | |
| 6.4 Evidence of SBAR’s capacity and effort to find innovative and custom solutions for complex or unique client needs. | |
| Q7. To what extent has ITS managed CCG’s assets at optimal life-cycle cost in the delivery of SBAR? | 7.1 Description of current practices, tools and systems used by SBAR to ensure that CCG assets are managed at optimal life-cycle costs. |
| 7.2 Comparative analysis of SBAR’s current practices with best practices in optimal life-cycle management found in literature. | |
| 7.3 Anecdotal evidence of higher costs and efforts associated with maintenance of assets in poor conditions. | |
| Gender-based Analysis Plus (GBA+) | |
| Q8. To what extent have GBA+ considerations been incorporated into the planning and the management of the SBAR program? | 8.1 Evidence of effort to consider and integrate GBA+ factors (such as biological sex, gender, visible minority status, geography, official languages) into the program planning, management and delivery. |
| 8.2 Evidence that efforts are undertaken by ITS to ensure a diverse workforce in the delivery of SBAR. | |
Appendix B – Evaluation methodology
Interviews Footnote 16
Conducted 37 interviews to explore issues related to the condition of the assets, meeting of services level agreements, tools and processes to support life cycle management, and impacts of investments in the program.
Interviewees were selected to ensure that input was received from a mix of program representatives across all regions and national headquarters, including SBAR program clients.
Interviews included: 19 ITS staff, 13 CCG clients and five external stakeholders.
Four interviews were also conducted with ITS program staff to better understand ITS’s Maximo system.
Data analyses
Analyzed SBAR administrative data, including Maximo work orders, asset condition surveys, maintenance plans, project management data and helicopter charter data.
Analyzed MCTS, AtoN and Fleet administrative data, including outage reports, asset performance, helicopter and vessel time data, and lost buoy data.
Analyzed SBAR financial data to assess the extent to which the program has received funding to deliver on its objectives, and SBAR procurement data to determine the volume of contracting processed through the DFO Procurement Hub.
Data limitations are outlined throughout the report where relevant and include data unreliability due to unknown degree of standardization and coordination within regions and users.
Observation
A total of 32 different sites were visited across all CCG Regions to observe different types of assets for which SBAR is responsible. The sites were selected to include different types of assets for both AtoN and MCTS.
Thirteen different types of assets were viewed: two wharfs, four MCI workshops, four E&I workshops, five warehouses/storerooms, four radar sites, three communication tower sites, three MCTS Centres, two Regional Operations Centres, one harbour, two light stations, one Technical Solutions Centre, and one Maritime Rescue Sub-Centre.
Informal discussions were held with ITS, AtoN and MCTS representatives at each site to understand the asset that was being viewed, including the condition of the asset, challenges maintaining it, the impact of investments, and the use of Maximo.
Document and literature review
Reviewed key CCG documents to understand the program and in particular LCM practices.
Conducted a literature review to understand the importance of the marine shipping industry.
Case studies
The evaluation included five case studies to examine issues related to project management, achievement of expected outcomes, and the impact of the project or initiative on the SBAR program.
The case studies were selected based on projects that were most recently undertaken by ITS.
The case studies included the 4SB project, the CCS Equipment Replacement Project, FII, the OPP-OpNet Initiative, and the OPP–Radar and Additional Radar Sites Initiative.
Appendix C - Case studies
Case study: The Four Season Buoy Project
The Four-Season Buoy Project, initially an initiative under the World-Class Tanker Safety System, aims to deliver four-season lighted aids to navigation* to the St. Lawrence shipping channel between Quebec City and Montreal. The project includes the installation of 185 four-season buoys, reducing maintenance needs as well as fees for industry.
Region: Central & Arctic (St. Lawrence Sector)
Program client: Aids to Navigation (AtoN)
$18.9M Total project cost
$285K Recurring annual maintenance cost
Project status: The project, which was initially planned to end in 2019, has been extended by two years to allow for additional research and development. Currently, 106 buoys are in position with a further 20 buoys awaiting deployment and the remainder to be delivered in the near future. The project is on track to be completed by March 2021, and is within the revised budget of $18.9M.

Description
The figure illustrates the timeline for the Four-season Buoy Project. The project started in 2014 and was initially planned to end in 2019. The project end date was revised to March 2021.
*The project includes not only the buoy, but also the lantern, the battery, the lettering, the paint and all mooring components.
Background: The St. Lawrence River is narrow and difficult to navigate in the best of conditions. Due to significant ice formation over the winter months, winter navigation in the St. Lawrence River requires that vessels double up on pilots to increase safety. The changeover from summer to winter buoys marks the end of the summer navigation season and the start of additional costs to the shipping industry to comply with winter navigation requirements. With limited CCG asset availability and the unpredictable timing of season changes (i.e., changing from autumn to winter), it is difficult to keep the summer navigation season open as long as possible to reduce additional costs for industry without running the risk of losing buoys because of ice.
Life cycle management activities:
- Determine operational requirements.
- Review off-the-shelf solutions against requirements.
- Design and test new buoy models based on operational and environmental requirements.
- Complete equipment procurement.
- Support buoy deployment in collaboration with AtoN and CCG Fleet partners, and maintain buoys.
Expected outcomes:
- Increase navigational safety year-round, reducing the risk of marine traffic accidents and environmental damage.
- Optimize the summer navigation season in the St. Lawrence River [the buoys remain in the water year-round, and offer a lighted-service, ice permitting].
- Reduce double-pilotage fees for industry by keeping the summer navigation season open as long as possible.
- Reduce the burden of buoy maintenance on the CCG Fleet by replacing the current bi-annual requirement with a 2- to 4 -year maintenance cycle (depending on buoy position).
Case study: The Communication Control System Equipment Replacement Project
The Communication Control System (CCS) Equipment Replacement Project upgraded the communication control equipment of all 12 consolidated operational centres of the Marine Communications and Traffic Services (MCTS) and their associated remote communication sites; modernized the operators’ workstations and consoles; and equipped the Canadian Coast Guard College with CCS simulators for training purposes.
Region: All CCG Regions
Program client: MCTS
$48.3M Actual project cost
Project status: The project was completed in 2019 after being delayed. The consolidation of 22 MCTS centres into 12 was announced two years into the project, and required a revision of the technical requirements and a redesign of the system. The project was completed within the approved updated budget.
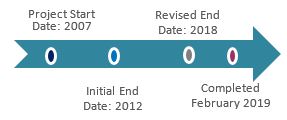
Description
The figure illustrates the timeline for the Communication Control System Equipment Replacement Project. The project started in 2007 and was initially planned to end in 2012. The end date was revised to 2018 and the project completed in February 2019.
Background: CCS enables the ship-to-shore communication component of the MCTS Centres. It is an essential technology for MCTS services allowing communication with vessel traffic and response to marine distress.
Life cycle management activities:
The CCS replacement project was prompted by LCM issues with the old CCS equipment (e.g., high maintenance costs, lack of adequate spares, decreased reliability of service). The project included LCM activities, such as:
- Definition of operational needs and identification of a preferred service provider.
- Revision of the initial project scope in response to the consolidation of MCTS centres announced two years into the planning phase.
- Initial training for MCTS Operations instructors, as well as installation and maintenance personnel.
- Development of maintenance support plans, technical documentation and training materials in English and French.
- Entering newly acquired equipment into the Asset Management System.
- Disposal of end-of-life CCS equipment.
Outcomes:
- The replacement of end-of-life equipment with new digital CCS equipment based on modern and improved technologies allowed improved MCTS service and permitted the modernization of other MCTS systems.
- The new CCS equipment facilitated the consolidation and standardization of MCTS services, systems and equipment across Canada.
Case study: The Federal Infrastructure Initiative
The Federal Infrastructure Initiative (FII) replaced aging towers and deteriorating infrastructure for the Marine Communications and Traffic Services (MCTS) and Aids to Navigation Programs (AtoN), using more efficient and greener technologies where possible, to ensure a reliable infrastructure network and ensure an adequate level of service is provided.
Region: All regions
Program client: MCTS and AtoN programs
$45.1M Actual and approved costs
Project status: Completed on time and within budget.

Description
The figure illustrates the timeline for the Federal Infrastructure Initiative. The project started in April 2016 and ended in May 2018.
Examples of improvements:
- Over 250 beacons were rebuilt in the Western Region;
- Five new telecommunication towers were installed in the Central and Arctic Region; and
- Two leaning DGPS towers were repaired in the Atlantic Region.
- A new telecommunications tower and a new equipment building were built in the Atlantic Region to replace old infrastructure.
Background: In 2016, many navigation and marine communication assets were at, or past, end-of-life due to the lack of maintenance and renewal budget over the years.
Life Cycle Management Activities:
- Engage with stakeholders to validate the operational requirements of the assets.
- Assess existing infrastructure to identify candidate sites for refurbishment.
- Perform options analysis and implement greener options.
- Organize refurbishment by site rather than by asset class to minimize travel to remote sites.
Outcomes:
- Existing infrastructure and assets were upgraded or replaced, particularly end-of-life AtoN assets.
- Safety standards for maintenance were met.
- The reliability of essential marine navigation infrastructure was increased.
- The replacement of assets with greener technologies reduced the CCG’s ecological footprint.
Case study: The Oceans Protection Plan – Operational Network Project
The Oceans Protection Plan - Operational Network Project (OPP-OpNet) aims to achieve an operational network infrastructure that is more reliable and resilient, and that provides enhanced performance. The initiative replaces aging network infrastructure (e.g., landline) with various technologies at remote sites and Marine Communications and Traffic Services (MCTS) Centres, ensuring continuity and minimal disruption to operations. Once completed, the initiative will strengthen services delivered by the CCG.
Region: All regions
Program client: MCTS
$34.8M Budget over 5 years
$4M Recurring annual maintenance cost
Project status: The project is currently on track to be completed on budget by March 2022.

Description
The figure illustrates the timeline for the Oceans Protection Plan – Operational Network Project. The project started in April 2017 and is projected to end in March 2022.
Background: Marine communications capabilities depend on the strength of the land-based operational network. Before the project, the CCG network had to rely on outdated technology (e.g., copper wires), and the equipment was at, or past, end-of-life. With no network back-up, the obsolescence of the equipment resulted in frequent service outages, heavy reliance on third-party telecommunications providers, and high costs for repairs and service charges, especially for remote sites. The project is comprised of three main activities, as described in the figure below:

Description
The figure depicts the three main activities of the Oceans Protection Plan – Operational Network Project.
Activity 1: Modernization of existing lines and addition of new lines (where required);
Activity 2: Installation of redundant connections; and
Activity 3: Development of business continuity plans for all MCTS Centres.
Life cycle management activities:
- Develop new technical documentation.
- Implement a network-wide CCG support structure (e.g., single entry point for all network service requests related to the network, service request tools, service level agreements with CCG programs).
- Improve the CCG network’s security, including a proper certification and accreditation process.
Expected outcomes:
- Reduce equipment outages and operational risks to CCG services.
- Improve network reliability to ensure MCTS is able to maintain most, or at least the highest priority operations, in the case of a major outage.
- Decrease risks related to the reliance on third-party telecommunications providers, as well as associated maintenance costs.
Case Study: The Oceans Protection Plan – Radar and the Additional Radar Sites Initiative
The Oceans Protection Plan – Radar (OPP-Radar) and the Additional Radar Sites Initiative will add 11 new radars to the existing network to: address priority gaps in the radar coverage of Canada’s coasts in support of marine safety; enhance the CCG’s ability to identify vessels; and provide a backup information source for Marine Communications and Traffic Services (MCTS) Centres in the event of communication loss with vessels navigating in Canadian waters.
Region: The Atlantic and Western Regions
Program client: MCTS
$24M OPP Budget over 5 years
$1.2M Recurring annual maintenance cost after 2022
Project status: The project is currently behind schedule due to delays in the procurement of the radars* (the same procurement process was used for the OPP-Radar as for the Radar Replacement Project initiated prior to 2017). Infrastructure for the new sites is being built ready for the installation of the radar systems. The first radar site is expected to be completed and available in the spring of 2021. The project is approximately 10% over-budget due to higher-than-expected costs for helicopter services, land acquisition and HR.

Description
The figure illustrates the timeline for the Oceans Protection Plan – Radar and the Additional Radar Sites Initiative. The project started in April 2017 and is projected to end in March 2022.
*The original scope included 8 radar sites. Three additional sites were added to the project during the gap coverage analysis.
Background: Radars are important to MCTS for the enhanced monitoring of marine traffic (e.g., the identification and position of a vessel) in support of safe marine navigation and to effectively and reliably respond to distress calls, in addition to other marine communication services.
Life cycle management activities:
- Conduct coverage analysis to identify priority geographical areas and radar sites; and adjust project scope accordingly to include 11 radar sites.
- Conduct community outreach to secure land tenure or acquisition.
- Build the infrastructure to support the radars.
- Procure and install the radar systems.
- Provide training to personnel who will operate and maintain the systems.
Expected outcomes:
- Improve marine safety by enhancing MCTS Centres’ marine situational awareness capabilities. For example, radars allow MCTS Centres to monitor smaller vessels without using the Automatic Identification System (AIS).
- Allow the CCG to provide enhanced supervision to vessels navigating in difficult waters.
- Improve service coverage and reliability.
Appendix D: Management action plan (MAP)
Evaluation of the Shore-based Asset Readiness program (project # 96263)
PMEC Date: June 2020
MAP Completion Target Date: June 2022
Lead ADM/DC: Deputy Commissioner, Shipbuilding and Materiel Sector
Recommendation 1 (June 2022)
Recommendation 1: The Canadian Coast Guard (CCG) should put in place standard methodologies to collect data on asset conditions and service availability to support ongoing measurement of asset performance; and establish roles and responsibilities for collecting the data.
Rationale: The SBAR program currently uses the asset condition assessment program (ACAP) to rate the condition of shore-based assets. The program had limited capacity to conduct visual inspections of assets prior to 2017-18 and rated conditions of assets were based on a combination of the last visual inspection and best estimates of their condition. Thus ACAP data prior to 2017-18 likely did not reflect the actual condition of assets.
There are also limitations with the ACAP methodology, including that it is not being applied consistently across the regions.
Service availability (i.e., the percentage of time assets are in service) is an indicator of asset availability and reliability. Data on service availability is not collected consistently across regions and programs and the data that are currently being collected are unreliable due to a number of factors.
Given these limitations, it is difficult to use the data to accurately measure the performance of the assets.
Management response
Integrated Technical Services (ITS) is currently updating its ACAP methodology to collect data on asset conditions by incorporating increased trend analysis that will influence planning and life cycle management. The revised ACAP methodology will be updated by the end of 2021-2022 with the exception of the Environmental Response (ER) equipment, for which an ACAP methodology will be put in place once the ER infrastructure is in service. With respect to the service availability, ITS will work with Marine Communications and Traffic Services (MCTS) and Aids to Navigation (AtoN) Programs to make sure they have access to the information required in order to track and report on availability of their services.
Link to larger program or departmental results (if applicable)
Core Responsibility: Marine Navigation
- Mariners safely navigate Canada’s waters; and
- A Canadian maritime economy that is supported by navigable waters.
Program results:
- Shore-based assets are available and reliable for CCG Service Program use (MCTS, AtoN and ER).
| MAP results statement (Result to be achieved in response to the recommendation) |
MAP milestones (Critical accomplishments to ensure achievement of results for PMEC’s approval) |
Completion date (Month, Year) |
Director General Responsible |
|---|---|---|---|
| 1. Standard ACAP data collection methodologies are in place to support the measurement of asset performance. | 1.1 ACAP methodology is reviewed, including service availability considerations, and gaps in the consistent application of the ACAP methodology are identified. | June 2021 | DG, ITS in consultation with:
|
| 1.2 ACAP methodology is updated and collection processes are standardized. | December 2021 | DG, ITS in consultation with:
|
|
| 1.3 National implementation of revised ACAP methodology is completed and revisions are reflected in the program’s performance information profiles. | June 2022 | DG, ITS in consultation with:
|
|
| 1.4 ACAP Methodology for ER Assets is developed and implemented and reflected in the programs’ information profiles (SBAR and ER). | June 2022 | DG, ITS in consultation with:
|
|
| 1.5 The assessment of the information accessibility required for reporting and tracking is completed. | December 2021 | DG, ITS | |
| 1.6 Identified improvements required for reporting and tracking are completed. | June 2022 | DG, ITS |
Recommendation 2 (June 2022)
Recommendation 2: The CCG should clarify the expected targets for service availability for SBAR assets, including the approach for prioritizing maintenance; and establish a consistent method for reporting on performance against those targets at a national level.
Rationale: ITS is responsible for maintaining AtoN and MCTS assets and have mitigation measures in place to minimize outages of those assets. ITS staff have a very high level of skills and knowledge and meet expectations for service with respect to the maintenance of these assets.
Service level agreements (SLAs) between ITS and its clients are either not in place or out of date. Therefore, there are no agreed upon expected targets for service availability of SBAR assets. In addition, there is no standardized process in place for reporting on the extent to which service availability targets are met.
Management response
ITS will work with the MCTS services and AtoN programs to clarify expected targets for service availability of SBAR assets, and develop an approach for prioritizing maintenance by establishing a consistent methodology for reporting on performance against targets at a national level. The approach for ER equipment is being developed separately and will be available upon implementation of the ER Life Cycle Management (LCM) program at the end of 2021-2022.
Link to larger program or departmental results (if applicable)
Core Responsibility: Marine Navigation
- Mariners safely navigate Canada’s waters; and
- A Canadian maritime economy that is supported by navigable waters.
Program results:
- Shore-based assets are available and reliable for CCG Service Program use (MCTS, AtoN and ER).
| MAP results statement (Result to be achieved in response to the recommendation) |
MAP milestones (Critical accomplishments to ensure achievement of results for PMEC’s approval) |
Completion date (Month, Year) |
Director General Responsible |
|---|---|---|---|
| 2. SBAR assets have clearly defined service availability targets and performance reporting is consistent at a national level. | 2.1 Applicable SLAs outlining service availability targets for the AtoN and MCTS Programs are developed (excluding ER). | June 2021 | DG, ITS in consultation with:
|
| 2.2 Standard methodology for the prioritization of shore based asset maintenance is established and published (excluding ER). | December 2021 | DG, ITS in consultation with:
|
|
| 2.3 Regions and internal stakeholders are consulted in the development of performance targets for MCTS and AtoN Services’ assets (excluding ER). | March 2022 | DG, ITS in consultation with:
|
|
| 2.4 Methodology for reporting on the performance of established service targets for MCTS and AtoN assets is complete and implemented (excluding ER). | June 2022 | DG, ITS in consultation with:
|
|
| 2.5 Applicable SLA outlining service availability targets for the ER Program are developed. | June 2022 | DG, ITS in consultation with:
|
|
| 2.6 Regions and internal stakeholders are consulted in the development of performance targets for ER Assets. | June 2022 | DG, ITS in consultation with:
|
|
| 2.7 Methodology for reporting on the performance of established service targets for ER Assets is complete and implemented. | June 2022 | DG, ITS in consultation with:
|
|
| 2.8 Methodology for prioritizing maintenance and reporting on ER Assets is completed and implemented. | June 2022 | DG, ITS in consultation with:
|
Recommendation 3 (June 2022)
Recommendation 3: The CCG should identify and implement ways to improve the availability and reliability of asset inventory data in Maximo to support the life cycle management (LCM) of SBAR assets.
Rationale: To support the LCM of assets, SBAR uses an asset management system (i.e., Maximo). The system is not being used as intended, in part, because program representatives find the system time consuming and difficult to use and there is a lack of business rules to guide the use of the system.
ITS has been working to provide more support and guidance to system users, however, the system currently does not contain all SBAR assets and it is largely not being used to initiate asset purchasing via DFO’s financial system (ABACUS). This is affecting the program’s ability to effectively manage asset inventory and establish its inventory valuation—information which will be important to support DFO’s move to an accrual-based budget framework.
In addition, DFO will be migrating to a new financial system (SAP) on April 1, 2021. SAP does have similar functionalities as Maximo, however, it is not yet known what impact the implementation of SAP will have on Maximo.
Management response
ITS staff will reinforce Maximo business rules with the regions and insist they need to incorporate their asset inventory in the system explaining that this is a necessary step in the delivery of LCM services. ITS will examine possible solutions to facilitate the identification of missing assets through SAP and Maximo. ITS will consult with the regions to look at potential ways to streamline the process and will encourage them to request support or direction on established processes from the subject matter experts within ITS. ITS will co-ordinate the addition of shore-based assets data in Maximo through the Maximo working groups. ITS will continue to work with the DFO SAP transition team to determine system synergies and efficiencies and ensure a successful interface between the two systems.
Link to larger program or departmental results (if applicable)
Core Responsibility: Marine Navigation
- Mariners safely navigate Canada’s waters; and
- A Canadian maritime economy that is supported by navigable waters.
Program results:
- Shore-based assets are available and reliable for CCG Service Program use (MCTS, AtoN and ER).
| MAP results statement (Result to be achieved in response to the recommendation) |
MAP milestones (Critical accomplishments to ensure achievement of results for PMEC’s approval) |
Completion date (Month, Year) |
Director General Responsible |
|---|---|---|---|
| 3. Process to ensure the availability and reliability of asset inventory data is kept up to date and is in place to better support the LCM of SBAR assets. | 3.1 Missing asset inventory data is identified. | May 2021 | DG, ITS |
| 3.2 Action plan is developed to address the missing data in Maximo. | June 2021 | DG, ITS | |
| 3.3 Missing asset inventory data is entered into Maximo. | June 2022 | DG, ITS | |
| 3.4 Regional consultation on potential Maximo data and process improvements are completed. | June 2021 | DG, ITS | |
| 3.5 Ensure that protocols and procedures are established to ensure Maximo asset and inventory data integrity through the established Working Group. | December 2021 | DG, ITS | |
| 3.6 Maximo training materials and guidance documents are updated to include procedures related to the implementation of SAP. | June 2022 | DG, ITS in consultation with:
|
|
| 3.7 Identified Maximo data and process improvements are implemented. | June 2022 | DG, ITS |
Recommendation 4 (June 2022)
Recommendation 4: The CFO sector and the CCG should collaborate to review and identify where improvements could be made to the current procurement processes, tools, and support that are available for the in-service maintenance of assets.
Rationale: As part of the LCM approach, SBAR is responsible for identifying requirements for equipment and assets and for completing the acquisition process. Procurement was identified as one of the biggest challenges in managing SBAR assets, particularly due to the large number of assets for which SBAR is responsible and because equipment is specialized and often proprietary.
All of the program’s assets (including spare parts) are not currently being entered into Maximo, which affects the program’s ability to plan for asset purchasing. In addition, the program reported challenges with the procurement process, including that it is long and that standing offers cannot be set up for certain pieces of equipment.
A special procurement team within the DFO Procurement Hub has recently been established to support the CCG with the procurement of goods. However, the team is currently focused on responding to procurement requests and will have limited capacity to provide support for a more strategic approach to contracting.
Management response
ITS will establish a management level working group that will consist of representatives from ITS and Procurement that will be mandated to identify, evaluate, resolve and communicate solutions to the current procurement processes, tools and support available for the in-service maintenance of assets. This working group will also ensure that strategies developed are aligned with initiatives (i.e. SAP) currently under way. ITS will implement strategies and best practices to better plan procurement activities; and communicate procurement needs with DFO Procurement Hub partners. This process will be facilitated internally by better utilizing Maximo as the primary inventory management system.
Link to larger program or departmental results (if applicable)
Core Responsibility: Marine Navigation
- Mariners safely navigate Canada’s waters; and
- A Canadian maritime economy that is supported by navigable waters.
Program results:
- Shore-based assets are available and reliable for CCG Service Program use (MCTS, AtoN and ER).
| MAP results statement (Result to be achieved in response to the recommendation) |
MAP milestones (Critical accomplishments to ensure achievement of results for PMEC’s approval) |
Completion date (Month, Year) |
Completion date (Month, Year) |
Director General Responsible |
|---|---|---|---|---|
| 4. The revision of current procurement processes, tools, and support that are available for the in-service maintenance of assets is completed and identified improvements are implemented. | 4.1 Identify procurement capacity gap and develop a business case for additional resources. | September 2020 | DG, FMMO in consultation with:
|
|
| 4.2 Establish a list of high volume and repetitive requirements to develop more efficient procurement vehicles (consolidate contracts or standing offers) for these commodities. | June 2021 | DG, FMMO in consultation with:
|
||
| 4.3 SBAR procurement annual procurement plans and automatic purchase requisition options are analysed and implemented, as appropriate. | June 2022 | DG, FMMO in consultation with:
|
- Date modified: