
Summary of the Evaluation of the Shore-based Asset Readiness Program
About the evaluation
The evaluation was conducted between April and December 2019 and examined the performance and efficiency of the program over the period 2014-15 to 2018-19, including the ability of the program to maintain non-fleet assets and processes in place to ensure the application of a life cycle management approach. Evidence was gathered through interviews, document review, data analysis, case studies, and observation.
About the program
The Shore-based Asset Readiness (SBAR) program is responsible for the life-cycle management of non-fleet assets and for ensuring that these assets are available, capable and reliable to support the delivery of Canadian Coast Guard (CCG) programs, including the Aids to Navigation (AtoN) and the Marine Communication and Traffic Services (MCTS) programs.
Key findings
Investments in the Shore-based Asset Readiness program
After having little investment over at least a 5-year period, the SBAR program had limited capacity to apply a life cycle management approach for the management of assets. In addition, the condition of assets was deteriorating, resulting in an increased risk of critical asset outages.
Large investments were made in the SBAR program beginning in 2015-16, which saw an increase in both human resources and operations and maintenance.
Investments in the program created challenges, as special projects were not part of the planning process, were unexpected and included short timelines. This put pressure on the program to deliver on significant short-term projects while keeping up regular program business.
SBAR actual expenditures, special project expenditures (millions) and full-time equivalents (FTEs) (2009-10 to 2018-19)
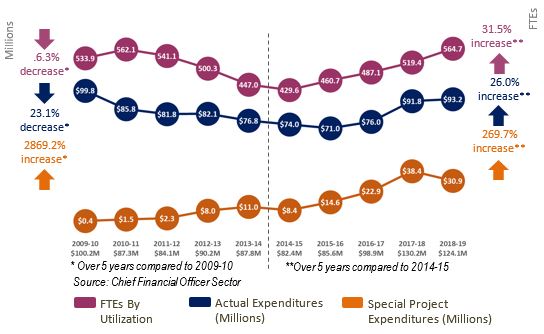
Description
The figure represents SBAR actual expenditures, special project expenditures (in Millions) and FTEs by utilization between 2009-10 and 2018-19 and is presented in two parts with a split to distinguish between 2009-10 to 2013-14 and the 2014-15 to 2018-19 time period.
In 2009-10, overall expenditures totalled $100.2M. Actual expenditures were $99.8M. Special project expenditures were $0.4M. FTE’s by utilization were 533.9.
In 2010-11: overall expenditures totalled $87.3M. Actual expenditures were $85.8M. Special project expenditures were $1.5M. FTE’s by utilization were 562.1.
In 2011-12: overall expenditures totalled $84.1M. Actual expenditures were $81.8M. Special project expenditures were $2.3M. FTE’s by utilization were 541.1.
In 2012-13: overall expenditures totalled $90.2M. Actual expenditures were $82.1M. Special project expenditures were $8.0M. FTE’s by utilization were 500.3.
In 2013-14: overall expenditures totalled $87.8M. Actual Expenditures were $76.8M. Special project expenditures were $11.0M. FTE’s by utilization were 447.0.
During the 2009-10 to 2013-14 time period, overall FTEs by utilization decreased by 16.3%, overall actual expenditures decreased by 23.1%, and overall special project expenditures increased by 2869.2%, when compared to 2009-10.
In 2014-15, overall expenditures totalled $82.4M. Actual expenditures were $74.0M. Special project expenditures were $8.4M. FTE’s by utilization were 429.6.
In 2015-16: overall expenditures totalled $85.6M. Actual expenditures were $71.0M. Special project expenditures were $14.6M. FTE’s by utilization were 460.7.
In 2016-17: overall expenditures totalled $98.9M. Actual expenditures were $76.0M. Special project expenditures were $22.9M. FTE’s by utilization were 487.1.
In 2017-18: overall expenditures totalled $130.2M. Actual expenditures were $91.8M. Special project expenditures were $38.4M. FTE’s by utilization were 519.4.
In 2018-19: overall expenditures totalled $124.1M. Actual expenditures were $93.2M. Special project expenditures were $30.9M. FTE’s by utilization were 564.7.
During this time period, overall FTE’s by utilization increased by 31.5%, overall actual expenditures increased by 26.0%, and overall special project expenditures increased by 269.7%, when compared to 2014-15.
Impacts of investments
The large investments in the SBAR program resulted in critical improvements and upgrades, the modernization of assets, and increases in staffing—all of which could not previously be addressed within the funding envelope for the program.
Infrastructure Improvements
- Federal Infrastructure Initiative
- Oceans Protection Plan - Radar
- World-Class Tanker Safety System
Equipment modernization
- Communication Control System
- Oceans Protection Plan -Operational Network
- Four-Season Buoy Project
Human resources
- Comprehensive Review
Gap analyses and studies
- World-Class Tanker Safety System
Condition of assets
Program representatives reported that the investments in the SBAR program have resulted in significant improvements to the condition of assets and that overall they are available, capable and reliable.
Limitations with respect to asset condition data and asset outage data make it difficult to use the data to accurately measure the condition of the assets.
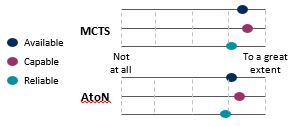
Description
The figure depicts the program representative’s ratings of the extent to which MCTS and AtoN assets are available, capable and reliable from "not at all" to "a great extent". The capability for both MCTS and AtoN assets scored highest, closely followed by the availability and then by the reliability. Both MCTS and AtoN assets rated highly across the three categories, although MCTS assets were rated slightly higher than AtoN assets.
Challenges maintaining assets
While the investments in the SBAR program have improved the condition of assets, there are ongoing challenges in ensuring that assets are available, capable and reliable.
| Operational challenges |
|
|---|---|
| External challenges |
|
Targets for service availability
Service level agreements between Integrated Technical Services (ITS) and its clients are either not in place or out of date. Despite this, clients indicated that ITS provides high quality services and meets expectations for the provision of service. In addition, ITS staff are highly skilled and knowledgeable and have identified and implemented innovative solutions to ensure the ongoing performance of assets and to find cost savings.
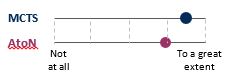
Description
The diagram depicts how MCTS and AtoN clients rated the extent to which expectations are met for service, from "not at all" to "a great extent". Both results are high and the MCTS clients gave a slightly higher rating than AtoN clients.
Life cycle management approach
The national asset management system in place to manage the assets (Maximo) is not being used as intended, which is affecting:
- the availability and reliability of data in Maximo required to effectively manage asset inventory;
- the ability to plan for asset purchasing; and
- the CCG’s ability to transition to an accrual-based budget framework.
Procurement
Procurement of shore-based assets has been identified as one of the biggest challenges for the program. A new DFO Procurement Team for CCG Goods and Construction was announced in October 2019 and is intended to provide multi-year procurement planning, prioritization and monitoring. However, the team currently has limited capacity to support a more strategic approach to contracting.
Recommendations
- Asset performance data: The CCG should put in place standard methodologies to collect data on asset conditions and service availability to support ongoing measurement of asset performance; and establish roles and responsibilities for collecting the data.
- Targets for service availability: The CCG should clarify the expected targets for service availability for SBAR assets, including the approach for prioritizing maintenance; and establish a consistent method for reporting on performance against those targets at a national level.
- Maximo data: The CCG should identify and implement ways to improve the availability and reliability of asset inventory data in Maximo to support the life cycle management of SBAR assets.
- Procurement process: The Chief Financial Officer sector and the CCG should collaborate to review and identify where improvements could be made to the current procurement processes, tools, and support that are available for the in-service maintenance of assets.
- Date modified: