Evaluation of fleet procurement and maintenance
Final report
July 29, 2024
Table of contents
- 1.0 Evaluation context
- 2.0 Program profile
- 3.0 Evaluation findings
- 3.1 Operational context for the Fleet Procurement and Fleet Maintenance programs
- 3.2 Capacity – internal factors impacting fleet maintenance
- 3.3 Delivery of maintenance activities
- 3.4 Decision-making and priority-setting
- 3.5 Vessel downtime due to unplanned maintenance
- 3.6 Risks and impacts to program clients, industry, and communities
- 3.7 Strategies to mitigate vessel unavailability
- 4.0 Recommendations
- 5.0 Annexes
1.0 Evaluation context
1.1 Evaluation context
This report presents the results of the Evaluation of Fleet Procurement and Maintenance conducted by the Evaluation Division at Fisheries and Oceans Canada (DFO) and the Canadian Coast Guard (CCG) from April to November 2023.
The evaluation complies with the Treasury Board Policy on Results (2016) and a Treasury Board Secretariat (TBS) request for information related to DFO and CCG elements of the National Shipbuilding Strategy (NSS).
1.2 Evaluation scope and objectives
The scope of the evaluation was established through a planning phase that included consultations with program representatives, senior management from CCG regions and national headquarters (NHQ), as well as departmental clients. These consultations determined that senior management decision-making would be best supported with information and insight into fleet maintenance activities. Thus, the scope of the evaluation focused on the CCG’s capacity to conduct maintenance activities on CCG vessels between 2017-18 to 2022-23. Some activities that took place prior to 2017-18 were considered, only to the extent they had impacted fleet maintenance in the later years.
1.3 Evaluation questions
The evaluation examined the following 5 questions:
Operational context and program delivery
- What factors have an impact on the fleet maintenance and procurement activities, including the implementation of recent initiatives?
- To what extent has the CCG developed and implemented effective processes and tools to support fleet maintenance activities?
Capacity to maintain the CCG fleet
- Does the CCG have the capacity to meet the requirements for fleet maintenance?
Risks, opportunities and mitigation strategies
- What are the key risks that exist if the CCG is unable to conduct fleet maintenance activities as per operational requirements?
- What are the strategies that the CCG uses to mitigate risks related to fleet operations? Are there additional mitigation strategies that could be implemented?
1.4 Data collection methods
To answer the evaluation questions, evidence was gathered from multiple methods. To mitigate, where possible, any methodological challenges or limitations, collected evidence was triangulated to decrease potential limitations with any one method, to develop the overall findings, and to ensure that recommendations were based on objective and documented evidence. These included:
- a review of over 240 internal and external documents
- interviews with 88 NHQ and regional personnel
- visits to 9 CCG locations across three regions
- a survey to CCG employees involved in maintenance activities (30% response rate)
- a review of various categories of administrative data
- a financial analysis
2.0 Program profile
2.1 Description of programs
The Fleet Procurement (FP) and Fleet Maintenance (FM) programs are responsible for the “cradle to grave” management of CCG vessels and assets throughout the 4 phases of CCG’s national Life Cycle Management System (LCMS), as depicted in Figure 1 below. The in-service phase was the focus of this evaluation as this is where the bulk of the FM program’s activities take place.
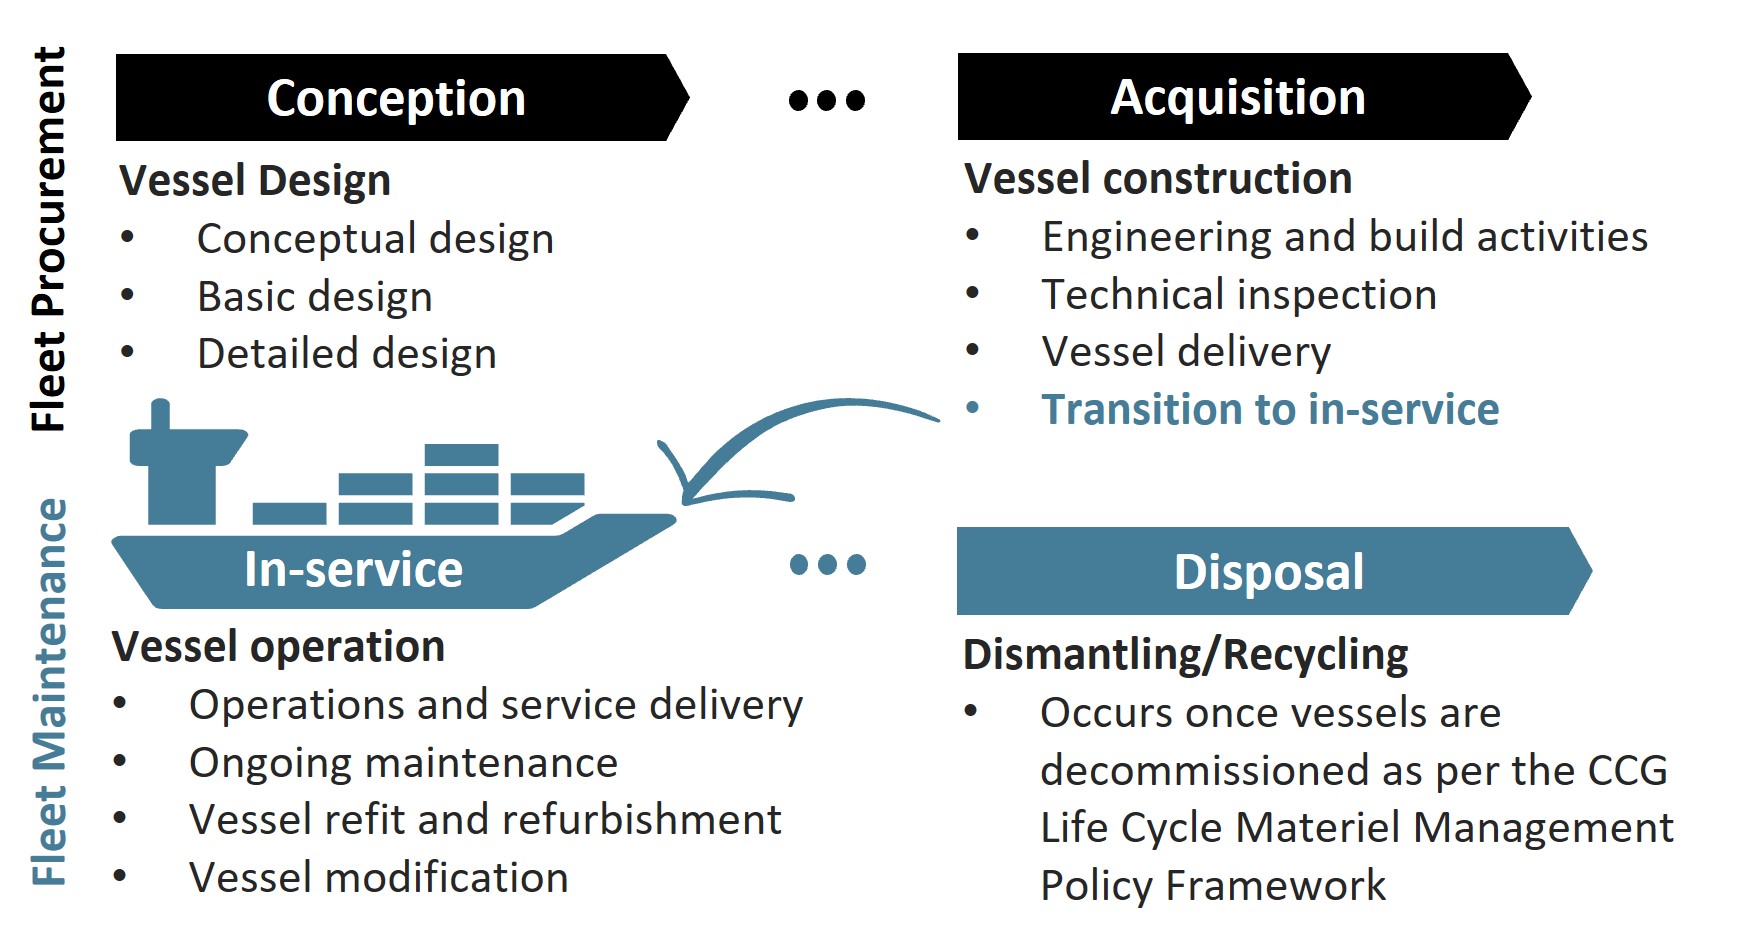
Figure 1 - Long Description:
Fleet Procurement is responsible for conception and acquisition. Conception covers vessel design, which includes: conceptual design, basic design, and detailed design. Acquisition covers vessel construction, which includes: engineering and build activities, technical inspection, vessel delivery, and transition to in-service.
Fleet Maintenance is responsible for in-service and disposal. In-service covers vessel operation, which include: operations and service delivery, ongoing maintenance, vessel refit and refurbishment, and vessel modification. Disposal covers dismantling/recycling, which occurs once vessels are decommissioned as per the CCG LCM Policy Framework.
2.2 CCG fleet maintained by the FM program and resources
As of 2022-23, the CCG fleet consists of 124 active vessels managed across 16 large and small vessel classes. Most vessels have one or two planned maintenance periods per year and the duration of each period varies by vessel class. CCG vessels are further supported by a vessel electronics asset base consisting of several thousand assets across the fleet. In 2022-23, the FM program spent $320.5M and employed 356 full-time equivalents across all regions within the Integrated Technical Services (ITS) directorate.
2.3 Program clients supported by the FM program
CCG vessels provide key maritime services to Canadians by supporting the mandates and on-water missions of other government departments as well as various DFO/CCG programs, e.g.:
- Icebreaking services
- Aids to Navigation
- Waterways Management
- Marine Security
- Marine Environmental and Hazards Response
- Search and Rescue
- Fisheries Management
- Conservation and Protection
- Ecosystems and Oceans Science (including Canadian Hydrographic Services)
2.4 Delivery structure for fleet maintenance activities
A complex network of partners collaborates to plan, fund, and deliver fleet maintenance activities during the in-service phase, as illustrated in Figure 2 below. Four branches within ITS-NHQ provide guidance and direction for fleet maintenance activities, including:
- Marine Engineering (ME)
- Electronics and Informatics (EI)
- Technical Management (TM)
- Vessel Modification Projects (VMP)
While VMP project officers are based out of ITS-NHQ, regional ME, EI, and TM staff have functional relationships with ITS-NHQ counterparts but report organizationally within regional management structures.

Figure 2 - Long Description:
Fleet and Program Clients may perform maintenance activities, when directed. Four branches within ITS-NHQ provide guidance for fleet maintenance activities: Technical Management (which supports the other three), Marine Engineering, Electronics and Informatics, and Vessel Modification Projects.
Seagoing fleet personnel and DFO/CCG program staff perform maintenance activities under functional direction from ME and ITS as per Service Level Agreements (SLAs) outlining requirements for vessel maintenance, if in place.
3.0 Evaluation findings
3.1 Operational context for the Fleet Procurement and Fleet Maintenance programs
Finding: Fleet procurement and maintenance activities take place within a complex and evolving environment and several external factors influence the scope of maintenance work required and the CCG’s capacity to undertake the work. Delays with the delivery of NSS ships have placed significant pressure on the Fleet Procurement and Fleet Maintenance programs, requiring them to implement interim measures, such as vessel life extensions and modification projects, which are not part of typical life cycle management activities. The arrival of the first NSS vessels led to additional challenges within the CCG due to a lack of organizational expertise and infrastructure to support the transition of new vessels into service.
Several external factors influence the program’s ability to maintain vessels in service, such as lengthy procurement processes, increasing costs for parts and equipment, shipyard ability to conduct maintenance, and the ability to respond to evolving regulatory requirements, as well as with evolving marine technologies. Amongst all factors, survey respondents ranked the increasing maintenance requirements due to aging vessels and machinery as the top external challenge being faced.
Aging CCG fleet
The CCG fleet is aging as vessels approach and exceed their intended end of service life (EOSL).Footnote 1 Across the CCG fleet, 30% of vessels have less than five years left until they reach their EOSL, 27% have exceeded their EOSL by up to 14 years, and 6% have exceeded it by 17 to 36 years. As of 2023, the large fleet has reached 82% of its intended service life while the small fleet has reached 91% of its intended service life, on average, as depicted in Figure 3 below. The age, condition, and obsolescence of CCG vessels and their electronics and informatics infrastructure represent a key risk to program delivery.
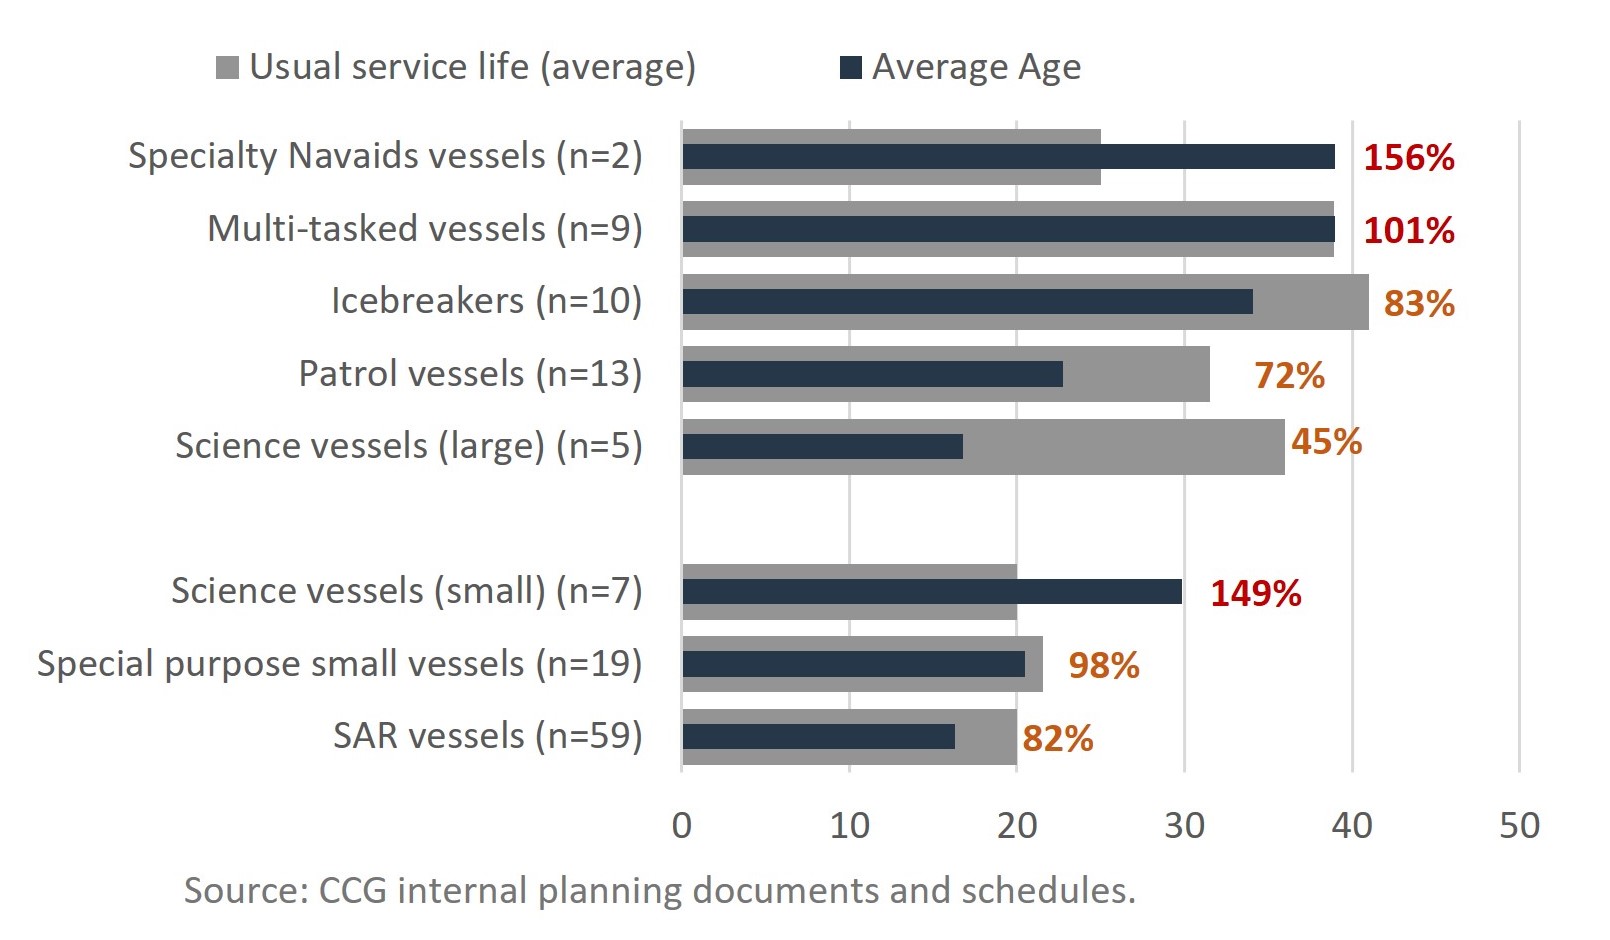
Figure 3 - Long Description:
Speciality Navaids vessels (n=2) have exceeded their usual service life by 156%.
Multi-tasked vessels (n=9) have exceeded their usual service life by 101%.
Icebreakers (n=10) are at 83% of their usual service life.
Patrol vessels (n=13) are at 72% of their usual service life.
Large science vessels (n=5) are at 45% of their usual service life.
Small science vessels (n=7) have exceeded their usual service life by 149%.
Special purpose small vessels (n=19) are at 98% of their usual service life.
SAR vessels (n=59) are at 82% of their usual service life.
Source: CCG internal planning documents and schedules.
State of the industry
Prior to 2010, a lack of domestic demand for ships had reduced the capacity of the Canadian ship and boat building industry. In 2010, the Government of Canada committed to revitalizing the industry creating good middle-class jobs and maximizing economic benefits across the country through the work done under the NSS.
Major shipyards are nevertheless facing challenges as they rebuild their capacity following the period of decline. Interviewees indicated that the state of the industry poses a risk to FP and FM activities, particularly on contracted services. Challenges facing shipyards include workforce attraction and retention, supply chain issues, volatility in commodity prices, and increasing costs for parts and equipment. Accordingly, the programs’ ability to forecast and assess costing trends within the marine and ship and boat building industry is limited. The recent incidence of COVID-19 led to further disruptions in supply chains, workforce shortages, and increased costs.
National Shipbuilding Strategy
Fleet renewal is a departmental priority and interviewees viewed NSS acquisition and maintenance projects positively as these are needed to address the clear and urgent capability gap related to the age of the fleet. However, concerns were expressed with the delays in the delivery of planned vessels, increased workloads associated with mitigating measures that the CCG had to implement, and workloads required to transition newly acquired ships into service, all which have resulted in additional pressures on the programs.
NSS activities were carried out across two pillars related to large and small vessel procurement while repair, refit, and maintenance activities formed a third pillar. An NSS audit conducted in 2021 by the Office of the Auditor General examined whether large vessels were being built on schedule and delivered as planned.Footnote 2 The audit found that vessel delivery dates set during the early years of the NSS had been missed by several years.
Furthermore, delivery schedules were becoming significantly longer and increasingly delayed due to delays with vessel design and construction. Designing entirely new classes of vessels while rebuilding industry capacity was found to be particularly challenging. To address some of these challenges, PSPC partnered with a third Canadian shipyard under the NSS in 2023. Box 1 below presents ship delivery delays identified by the audit.
Box 1. NSS ships and snapshot of delays
- 2010: The NSS' original work package included the replacement of up to 28 large vessels, including 5 vessels for CCG. Of the original 5 vessels for which data is available:
- Three offshore fisheries science vessels experienced an average delay of 10 months. All 3 have been delivered as of 2022. This represents the first large vessel project completed under the NSS.
- The offshore oceanographic science vessel was delayed 30 months and the vessel remains under construction.
- The polar icebreaker was undergoing a refresh of the original 2014 design and is still ongoing.
- 2019: Additional shipbuilding projects were announced including 2 Arctic and Offshore Patrol Ships, up to 16 Multi-Purpose Vessels and up to 6 Program Icebreakers
- 2021: An additional polar icebreaker was announced
The audit also identified that delivery schedules for new vessels, particularly those announced in 2019, line up tightly with the expected end-of-service dates of those they are meant to replace. As the current fleet nears its end of service life, further NSS delays could result in vessels being forced to retire before their replacements are available (e.g., CCGS W.E. Ricker retired in 2016 before it could be replaced by the first offshore fisheries science vessel delivered in 2019).
These delays, along with the proportion of vessels at or nearing EOSL, have placed additional strain on the programs, and this could impact the department’s ability to deliver on domestic and international obligations.
Interim measures implemented
In response to NSS delays, the CCG implemented mitigation measures to maintain operational capabilities until new ships could be delivered. These measures included extending the life of current vessels and purchasing ships from abroad. The additional workload associated with these mitigation measures has increased the scope of work of the FM program as these measures are atypical of the activities that the FP or FM programs carry out to manage the life cycle of a vessel. Instead, these represent additional responsibilities that the programs would not otherwise be required to deliver.
For instance, Fleet Procurement took on the responsibility for vessel modifications of interim icebreakers in the acquisition phase. The CCG purchased four foreign polar icebreaking vessels between 2018 and 2023 to address a gap in icebreaking services. The vessels were modified to meet CCG requirements before entering the fleet to ensure continuity of icebreaking services while other large vessels underwent VLE.
Fleet Maintenance took on the responsibility for vessel modification and Vessel Life Extension (VLE) projects in the in service-phase. VLE investments prolong the life of a vessel so it may operate beyond a planned decommissioning date. The CCG received funding for VLE in 2012, as well as an additional $2.07B in 2020.
The implementation of VLE 2012 saw various delays that were attributed to unexpected work (e.g., extensive damage or significant steel issues) required on specific vessels. Such instances increased the workloads of maintenance managers, fleet personnel and procurement specialists due to the need to oversee projects for longer periods, make ad-hoc adjustments to initial project scopes, and manage unplanned logistics and/or supply arrangements. Furthermore, some of the planned VLE work, which could not be postponed or delayed had to be funded and completed with the existing FM resources, thus, adding another pressure factor on the FM program.
These challenges underscored the importance of having dedicated internal expertise and infrastructure within the program, to ensure proper project management, trend analysis, and forecasting. The evaluation found that this was lacking.
Figure 4, below, depicts key initiatives that have taken place since the NSS was implemented, including the 2012 and 2017 Fleet Renewal Plan and 2019 Fleet Recapitalization Plan. The Fleet Sustainability Initiative launched in 2022 is preparing the CCG for the acquisition of additional vessels by leveraging lessons learned to inform the implementation of supporting structures, resources, and processes.

Figure 4 - Long Description:
The timeline goes from 2010 to 2022 and depicts 8 initiatives driving Fleet Procurement and Fleet Maintenance activities:
2010 – NSS (Federal)
2012 – Fleet Renewal Plan (Departmental)
2012 – VLE (Interim measures)
2017 - Fleet Renewal Plan (Departmental)
2018 – Interim Icebreakers (Interim measures)
2019 – Fleer Recapitalization Plan (Departmental)
2020 – VLE (Interim measures)
2022 – Fleet Sustainability Initiative (Departmental)
3.2 Capacity – internal factors impacting fleet maintenance
Finding: Several internal factors impact the program’s capacity to deliver maintenance. The main ones include the ability to recruit and retain qualified personnel, budgetary constraints, spending limits, and challenges with the organizational structure.
Internal factors impacting fleet maintenance
Figure 5 below presents a weighted ranking of the internal factors that impact the FM program, as indicated by Fleet, ME, EI, and VMP staff who responded to a survey.
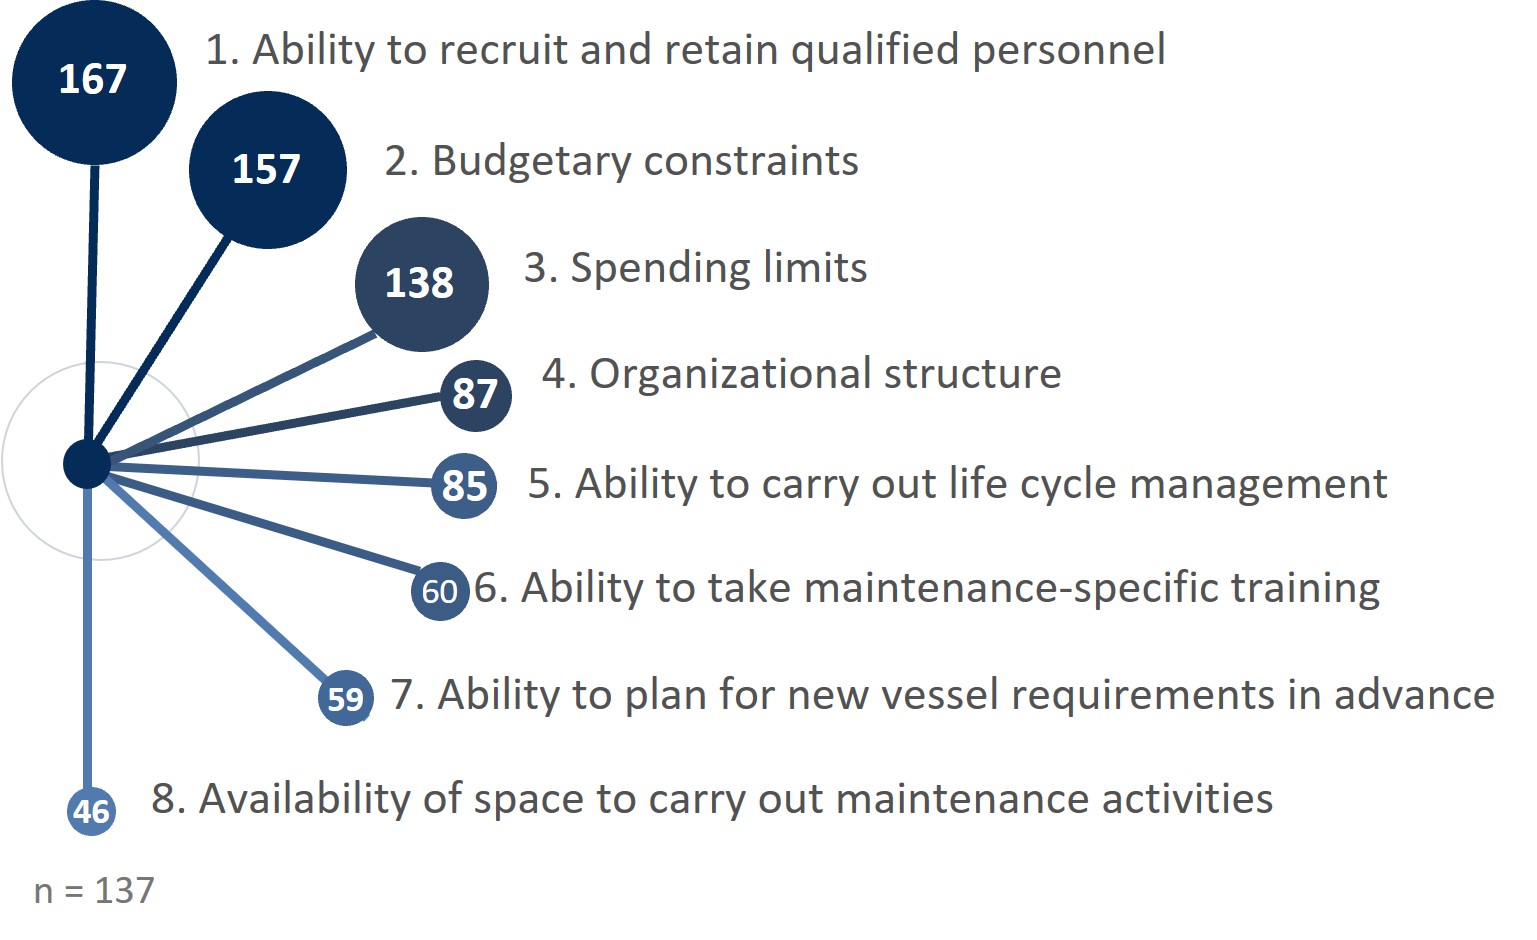
Figure 5 - Long Description:
1. Ability to recruit and retain qualified personnel (weight – 167)
2. Budgetary constraints (weight – 157)
3. Spending limits (weight – 138)
4. Organizational structure (weight – 87)
5. Ability to carry out lifecycle management (weight – 85)
6. Ability to take maintenance-specific training (weight – 60)
7. Ability to plan for new vessel requirements in advance (weight – 59)
8. Availability of space to carry out maintenance activities (weight – 46)
There were 137 respondents.
Ability to recruit and retain qualified personnel
The CCG is facing challenges recruiting and retaining qualified personnel due to a lack of qualified candidates on the market with certifications in relevant specialties. A high degree of competition between CCG, industry partners, as well as other government departments further complicates the CCG’s ability to attract, recruit and retain staff, particularly where better conditions exist (e.g., indeterminate status, lighter workloads).
Interviewees indicated that the FM program’s human resources are insufficient to the levels required for the program to fulfill its responsibilities. Furthermore, the evaluation found that while many respondents regarded the level of their team’s expertise highly, they also generally disagreed that their teams had enough personnel to conduct fleet maintenance activities, as illustrated in Figure 6. Chief engineers, small craft maintenance staff, electronics engineering technologists, and support staff for asset management and safety management systems were among the positions noted to be experiencing key shortages.
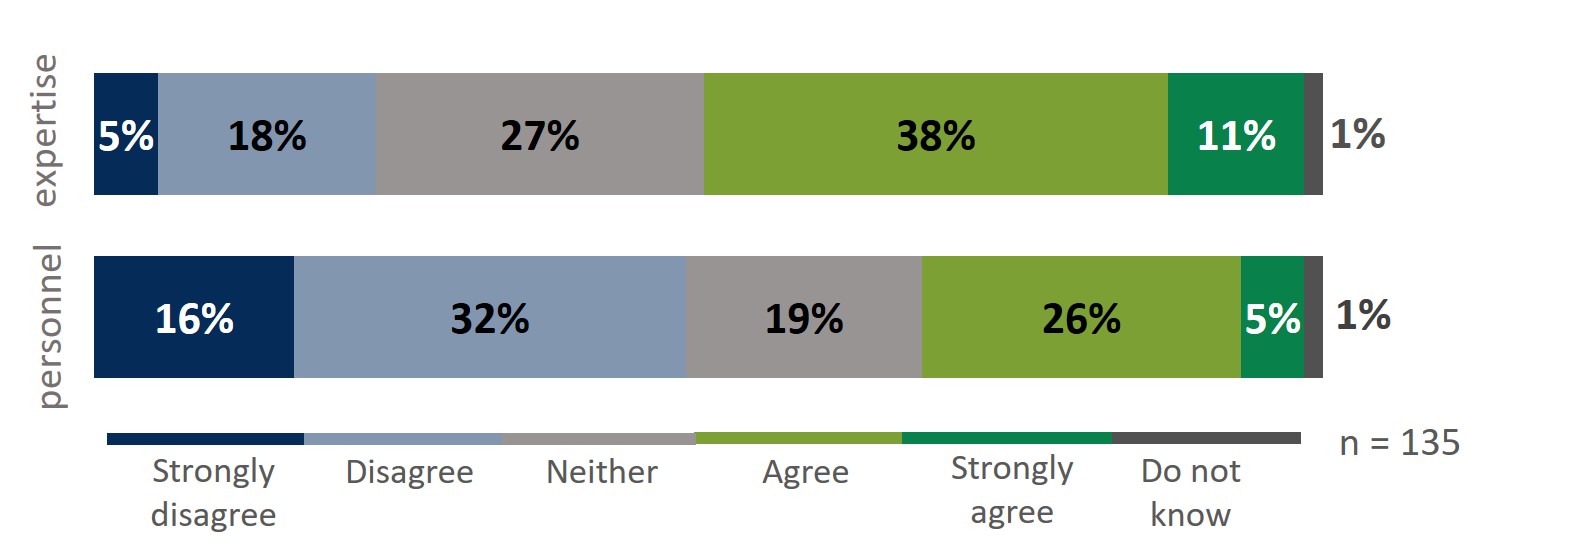
Figure 6 – Long Description:
Regarding expertise, 5% of respondents strongly disagreed, 18% disagreed, 27% neither disagreed nor agreed, 38% agreed, 11% strongly agreed, and 1% did not know.
Regarding personnel, 10% strongly disagreed, 32% disagreed, 19% neither disagreed nor agreed, 26% agreed, 5% strongly agreed, and 1% did not know.
Budgetary constraints
Increases in the demand and workload for maintenance operations are reflected in increases to the program’s capital expenditures. Since 2015-16, non-salary operating expenditures as tracked by the program have remained somewhat stable when related to vessel refits, as depicted in Figure 7 below. Meanwhile, capital expenditures for vessel refurbishments have increased significantly since 2012-13. These include vessel modifications or improvements that enhance vessels’ service capacity, design, and/or functionality, as well as VMP projects.
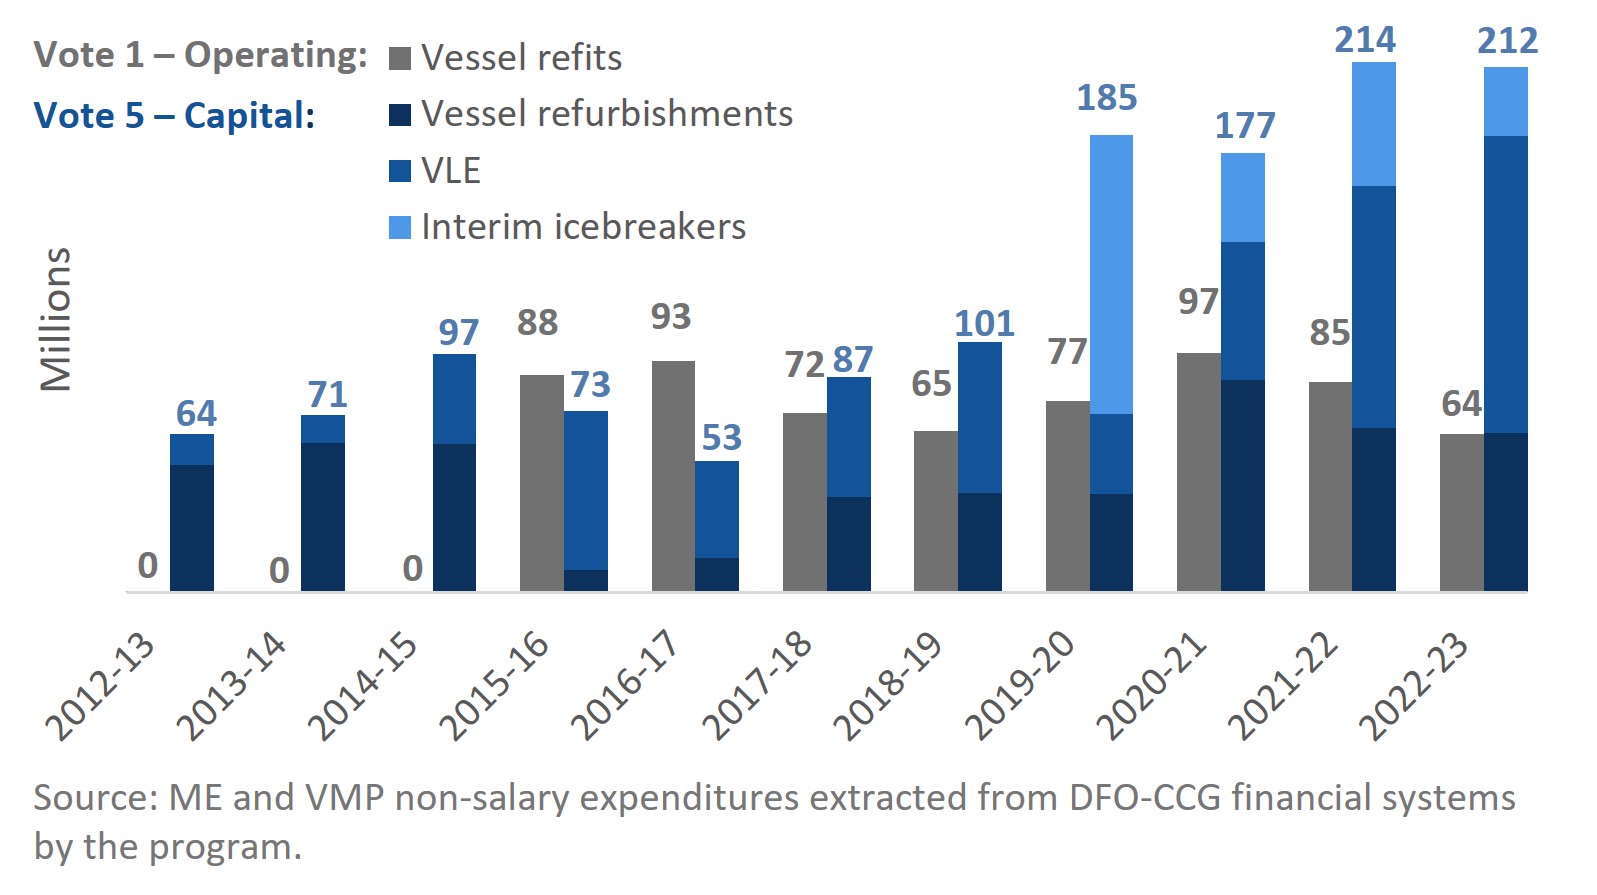
Figure 7 – Long DescriptionLong Description:
A 2-column stacked graph represents four series of spending by fiscal year, from 2012-13 to 2022-23:
- Vote 1 Operating and Maintenance: Vessel refits;
- Vote 5 Capital: Vessel Refurbishments; VLE; Interim icebreakers
The vessel refits spending was minimal in 2012-13 to 2014-15, and varied slightly for the rest of the period within the range $64M (in 2022-23) to $93M (in 2016-17).
The combined capital spending varied more over the period, within the range $53M (in 2016-17) to $214M (in 2021-22).
Source: ME and VMP non-salary expenditures extracted from DFO-CCG financial systems by the program.
The main reason for operating expenditures remaining stable is the fact that this budget was determined based on a subset of 30 vessels out of the whole CCG fleet in 2016. This is no longer representative of the program’s budget needs. In addition, it does not include funding for small craft and SAR vessels, nor the resources required to comply with new regulatory requirements (e.g., Greening Government Strategy). Furthermore, interviewees noted that initial requests are historically larger than allocated budgets, meaning that needs are greater than the expenditures presented.
Spending limits
The FM program is responsible for many assets that require the ongoing purchasing of parts and equipment as well as contracting of related services. The budget threshold for low dollar value goods and services (up to $20,000 and $10,000, respectively) was found to not be meeting the needs of ITS staff. Current spending limits and financial delegated authorities increasingly cannot cover the rising costs for goods (e.g., spare parts, ship repair) and services (e.g., engineering, towing) given the trends in inflation affecting the purchase of equipment and services. When the program’s spending limits are exceeded, staff must go through either the DFO Procurement Hub and/or PSPC processes which typically do not align with the unexpected, unplanned nature of maintenance work and can delay procurement timelines.
The recent departmental transition to SAP as well as newly established roles and authorities for approvals within the system further reduced the flexibility within DFO’s financial management processes and created new complexities as the department underwent this transition.
Interviewees mentioned that having more pre-authorized arrangements (e.g., standing offers) to support contracting services would be helpful, particularly in the areas where internal gaps in expertise have been identified.
The procurement processes and tools that are currently available to support asset maintenance are not meeting the needs of the program, that is, they lack efficiency and flexibility and have impacts on schedule, cost, and parts availability.
Organizational structure
Pressures on the FM program to address increasing scopes of work and deliver maintenance activities in a timely manner resulted in the creation of various positions through special projects and initiatives (e.g., the 2016-17 Comprehensive Review and 2016-17 Oceans Protection Plan) that would not otherwise have been possible. However, these positions were created quickly to meet program needs at the time and lacked longer-term planning and standardization. This has resulted in inefficiencies within the organizational structure, including the creation of risk-managed positions, classifications anomalies, challenges with span of control issuesFootnote 3, and reporting inefficiencies across personnel within the structure which impact the ability of the program to fulfill its responsibilities.
In 2018, the Fleet Recapitalization Plan identified ITS staffing requirements that would be needed to support the growth of the CCG fleet. This included organizational re-design, job description development, classification, as well as hiring staff on a temporary basis using Vote 5 capital budgets. Stabilizing the FM program’s organizational structure has been challenging due to the lack of a dedicated team within ITS with staffing and classification expertise to undertake this complex exercise, as well as insufficient levels of permanent salary funding needed to create positions as part of an updated structure. The result is a lack of alignment with the long-term nature of maintenance projects, particularly under the NSS; staff dissatisfaction, including grievances and departures; higher turnover rates; difficulty attracting and retaining qualified personnel; and excessive time spent on staffing paperwork at the expense of focusing on other priorities.
VMP is currently in the process of obtaining approval under the VLE 2020 framework for the staff and resources needed to enable them to successfully plan, execute, and deliver projects. When VMP was established as a branch in 2022, 90 positions were planned for, including a mix of temporary positions and those transferred from ME. Approximately 40 of these have been filled with indeterminate staff who report to NHQ as well as various part-time, assignment/ secondment, casual, and contracted staff.
A stable organizational structure would improve the FM program’s efficiency and ability to fulfill its responsibilities.
As depicted in Figure 8 below, the evaluation found that reliance on contracted services significantly increased in 2022-23. While this strategy is necessary to mitigate the lack of internal resources with solid engineering expertise (both shore-based and seagoing), contracted services are estimated to cost three times more than internally delivered services.
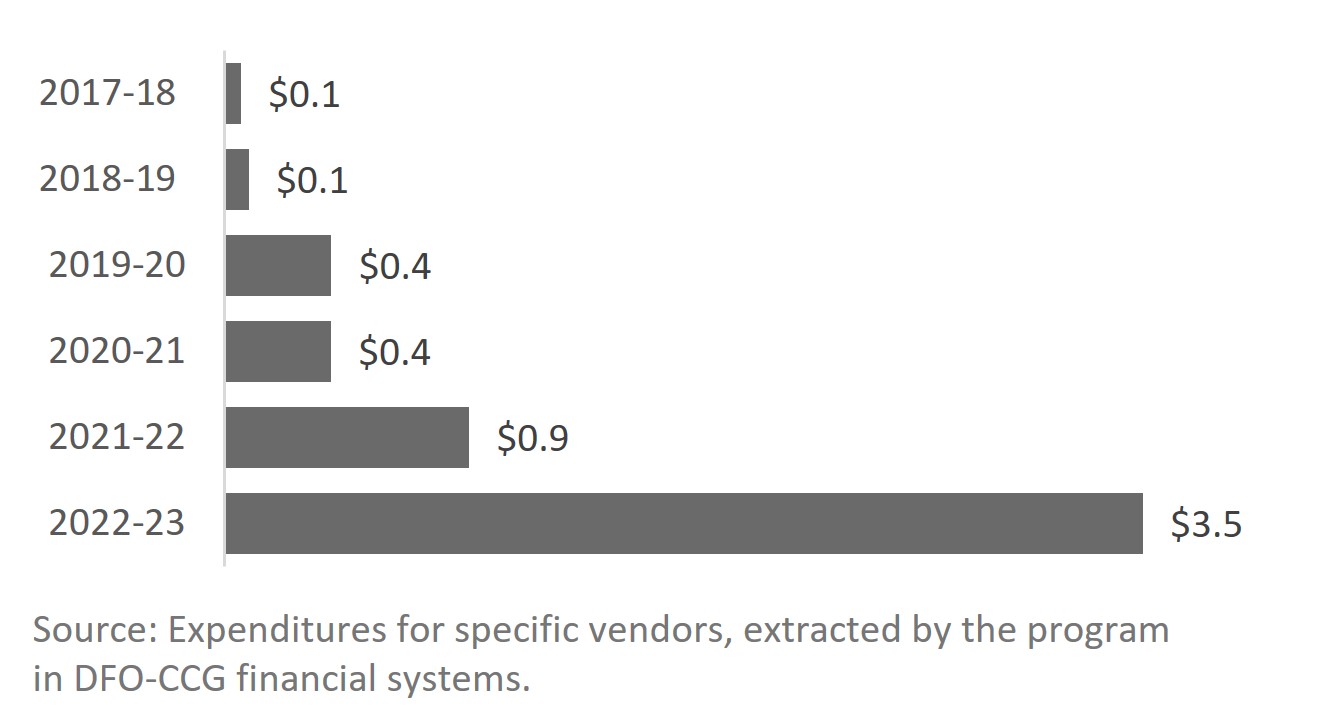
Figure 8 – Long Description:
In 2017-18 expenditures were $0.1 million. In 2018-19, $0.1 million. In 2019-20, $0.4 million. In 2020-21, $0.4 million. In 2021-22, $0.9 million. In 2022-23, $3.5 million.
Source: Expenditures for specific vendors, extracted by the program in DFO-CCG financial systems.
Utilizing contractors with specialized expertise for on-the-job training would support knowledge transfer and strengthen internal capacity. Furthermore, a long-term strategy for seagoing marine engineers to work on shore-based projects and vice-versa could contribute to building corporate memory while reducing external services’ costs.
3.3 Delivery of maintenance activities
Finding: Alongside, dry dock, and onboard self-maintenance were found to be completed as planned half of the time. Refit and VLE maintenance activities have experienced delays, with refit activities being more significantly impacted.
The evaluation could not assess whether maintenance activities have been delivered as planned (e.g., within scope, on schedule, within budget) due to a lack of formal reporting related to changes in maintenance plans. As such, the delivery of fleet maintenance activities were assessed through indirect means. Consolidated information regarding the delivery and status of various maintenance activities would be beneficial to have, to inform performance measurement and decision-making.
Delays in delivery of complex maintenance activities
When asked how often maintenance activities that take place alongside a CCG base, in drydock at a shipyard, or onboard vessels are completed as planned, survey respondents indicated that on average, 54% are completed as planned, as illustrated in Figure 9 below. Alongside maintenance was reported as experiencing slightly greater delays (60%).
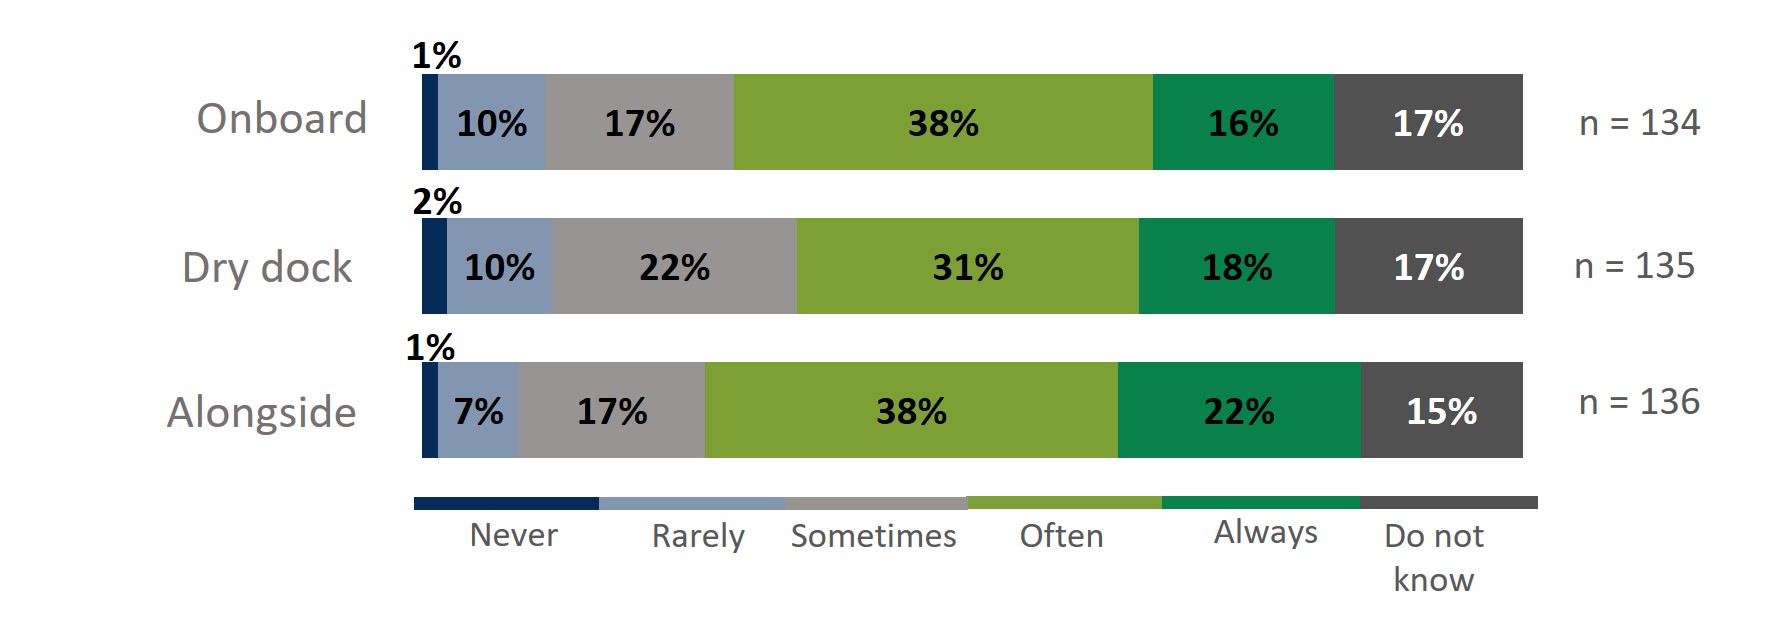
Figure 9 – Long Description:
Regarding alongside maintenance, 1% strongly disagreed, 10% disagreed, 17% neither disagreed nor agreed, 38% agreed, 16% strongly agreed, and 17% did not know. There were 136 respondents.
Regarding dry dock maintenance, 2% strongly disagreed, 10% disagreed, 22% neither disagreed nor agreed, 31% agreed, 18% strongly agreed, and 17% did not know. There were 135 respondents.
Regarding onboard maintenance, 1% strongly disagreed, 7% disagreed, 17% neither disagreed nor agreed, 38% agreed, 22% strongly agreed, and 15% did not know. There were 134 respondents.
With regards to refits and refurbishments (e.g., VLE), both types of maintenance activities have experienced delays compared to established workplans. Refit activities have experienced more consistent and significant delays across all regions compared to VLE when comparing the number of planned and actual maintenance days for the two activities, as depicted in Figure 10 below.
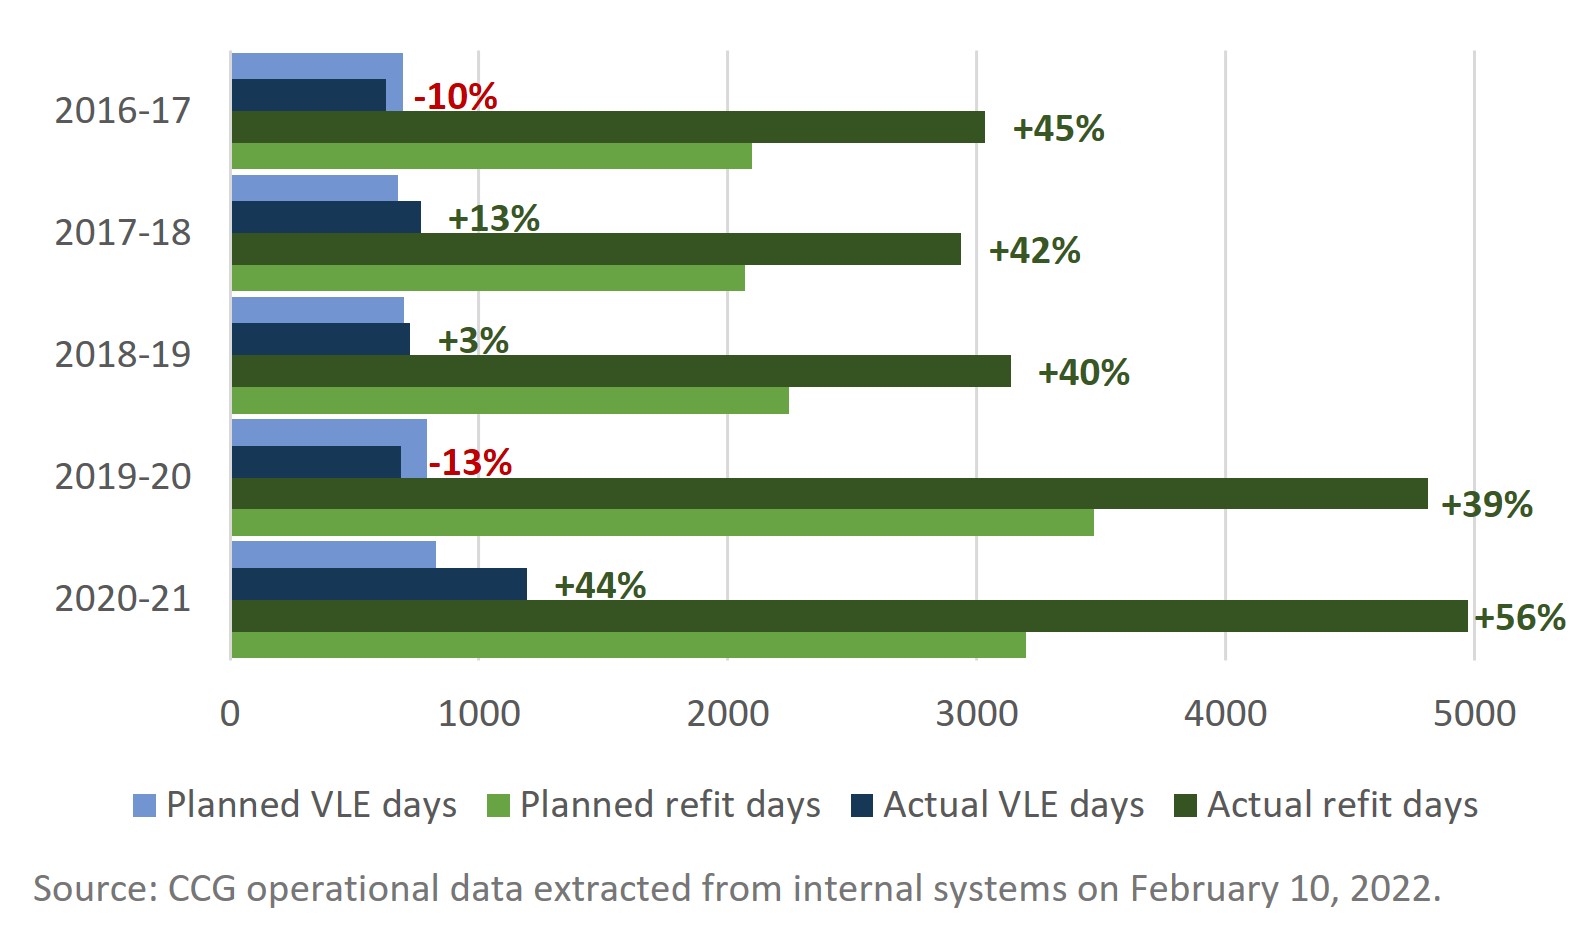
Figure 10 – Long Description:
The four-series bar graph shows the planned and actual VLE days; and the planned and actual refit days over five years, from 2016-17 to 2020-21. The actual refit days have consistently exceeded the planned refit days by 39% (in 2019-20) to 56% (2020-21). The actual VLE days were less than the planned VLE days in 2016-17 (-10%) and 2019-20 (-13%); however, they exceeded the planned VLE days in 2017-18 (+13%), in 2018-19 (+3%) and 2020-21 (+44%).
Source: CCG operational data extracted from internal systems on February 10, 2022.
Refit and VLE delays were attributed to various factors that have been discussed throughout this evaluation (e.g., the aging fleet, insufficient planning time and engineering capacity, procurement challenges, shipyard delays, COVID 19, snowball effect of delays on future planned activities, and increased scope of work due to unforeseen issues). Some inaccuracies in the data and analysis of refit and VLE delays might exist because of inconsistent or inaccurate tracking and reporting (e.g., delay reported as a ‘refit’ while it might be due to other reasons, such as missing a crew member).
3.4 Decision-making and priority-setting
Finding: Operational priority setting with respect to fleet maintenance is well-supported via various mechanisms that were found to be mostly working well. Nevertheless, decision-making was found to be somewhat ineffective and could be improved with regards to regional involvement in vessel procurement, as well as access to consolidated maintenance information to facilitate reporting and analysis.
Decision-making across maintenance partners is informed through various mechanisms. Survey respondents found operational priority setting to be well-supported through key tools and processes which were viewed as overall effective, as depicted in Figure 11 below. ITS’s Multi-Year Maintenance Plan (MYMP) was seen as an effective maintenance prioritization tool. The Vessel Maintenance Management Manual (VMMM) detailing maintenance procedures and methodologies was seen as providing sufficient guidance. The Vessel Condition Survey (VCS) process was found to provide useful information for maintenance planning, although there are opportunities to increase its use and feedback; and the process to develop the FOP was seen as effective.
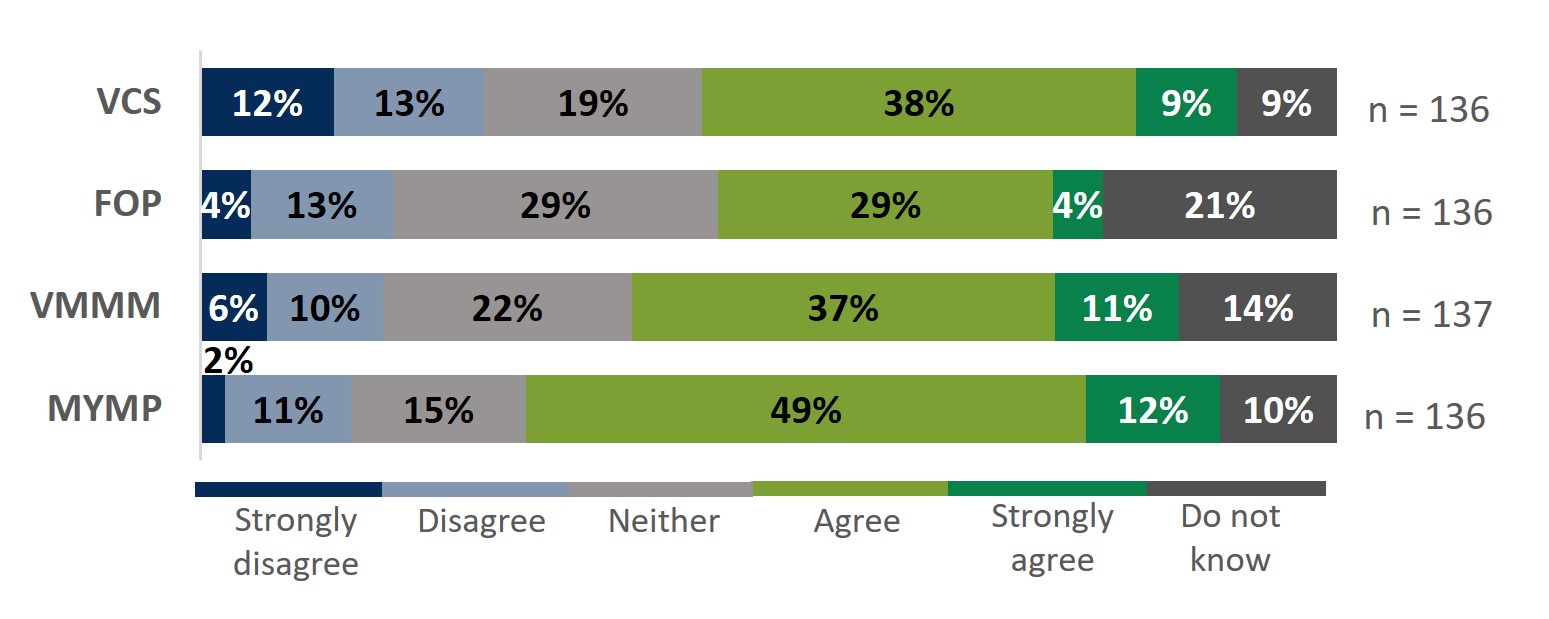
Figure 11 – Long Description:
Regarding the VCS, 12% of respondents strongly disagreed, 13% disagreed, 19% neither disagreed nor agreed, 38% agreed, 9% strongly agreed, and 9% did not know. There were 136 respondents.
Regarding the FOP, 4% strongly disagreed, 13% disagreed, 29% neither disagreed nor agreed, 29% agreed, 4% strongly agreed, and 21% did not know. There were 136 respondents.
Regarding the VMMM, 6% strongly disagreed, 10% disagreed, 22% neither disagreed nor agreed, 37% agreed, 11% strongly agreed, and 14% did not know. There were 137 respondents.
Regarding the MYMP, 2% strongly disagreed, 11% disagreed, 15% neither disagreed nor agreed, 49% agreed, 12% strongly agreed, and 10% did not know. There were 136 respondents.
Still, interviewees noted that some manuals, plans, and standard operating procedures are outdated and need a review. As well, there is a need for a consistent and standardized approach on how tools are used. The suggested improvements, however, may require additional resources for reviewing and maintaining, which are not available.
Decision-making with respect to fleet maintenance activities was found to be somewhat ineffective, as illustrated below in Figure 12. The planning and delivery of life cycle management maintenance activities is tracked across multiple mechanisms for various purposes, therefore data to support decision-making is not available in a consistent format that would facilitate analysis and reporting. Concerns were raised regarding the degree of effort required to extract and use this data holistically (i.e., to assess overall results, challenges, and gaps) to support priority-setting and decision-making, including work and resource planning, which may be based on incomplete information.

Figure 12 – Long Description:
18% of respondents strongly disagreed, 23% disagreed, 29% neither disagreed nor agreed, 24% agreed, 3% strongly agreed, and 3% did not know. There were 137 respondents.
Because the planning and delivery of maintenance activities is reflected and tracked through multiple mechanisms and for different purposes, there is no central repository where data on all aspects of maintenance is consistently organized in a standardized format that facilitates analysis, reporting, and communication. Thus, many aspects of priority-setting and decision-making, including work and resource planning, may be based on incomplete information.
Some interviewees express reservations regarding the insufficient regional involvement in the decision-making processes linked to new vessel design and procurement. Concerns were raised that this leads to gaps in the equipment and materials required for maintenance support of new vessels and program delivery in future (e.g., missing or incomplete integrated logistics support components).
3.5 Vessel downtime due to unplanned maintenance
Finding: Maintenance-related issues have resulted in vessels not always being available and reliable to deliver CCG programs, particularly when corrective maintenance needs arise and when maintenance work cannot be completed within planned periods. Given that an increase in corrective maintenance-related issues is closely aligned with an aging fleet and delays with the delivery of new vessels continues, it is expected that the number of non-operational vessel days due to unplanned maintenance will continue to increase in the coming years.
Operational days lost due to maintenance issues
To assess the number of operational days lost due to maintenance-related issues, the evaluation relied on CCG operational data available between 2018-19 and 2020-21. This data is not available beyond 2020-21 due to issues with the system, therefore, beyond this period the evaluation analyzed a sample of National Command Center (NCC) reports gathered between May 15 and June 30, 2023Footnote 4, as well as data tracked by DFO/CCG program clients. While these sources provide snapshots of lost vessel time due to maintenance-related issues, they cannot be compared or combined with CCG operational data due to the different methodologies used.
Vessels may not be available and reliable to deliver on planned regional Fleet Operations Plan (FOP) activities when failure situations arise that require off-service corrective maintenance or when maintenance work is delayed beyond planned off-service periods. Overall, the CCG operational data shows that vessel days lost from the FOP due to corrective maintenance, refit delays, and VLE delays increased between 2018-19 and 2020-21; this represents between 7% and 12% of planned FOP vessel time being lost as illustrated in Figure 13 below.

Figure 13 – Long Description:
In 2020-21, 5.7% of FOP vessel days were lost due to corrective maintenance, 5.8% to refit delays, and 1% to VLE delays. 12% of FOP days were lost in total.
In 2019-20, 4.3% of FOP vessel days were lost due to corrective maintenance, 4.4% to refit delays, and 1% to VLE delays. 10% of FOP days were lost in total.
In 2018-19, 3.6% of FOP vessel days were lost due to corrective maintenance, 2.9% to refit delays, and 0.5% to VLE delays. 7% of FOP days were lost in total.
Source: CCG operational data extracted from internal systems on Feb 10, 2022.
Since 2020-21, the evaluation also found that based on NCC reports (May 15 to June 30, 2023), 459 vessel days were not delivered as planned due to unplanned failures and delays, 57% of which took place in the Atlantic region, as depicted in Figure 14 below.
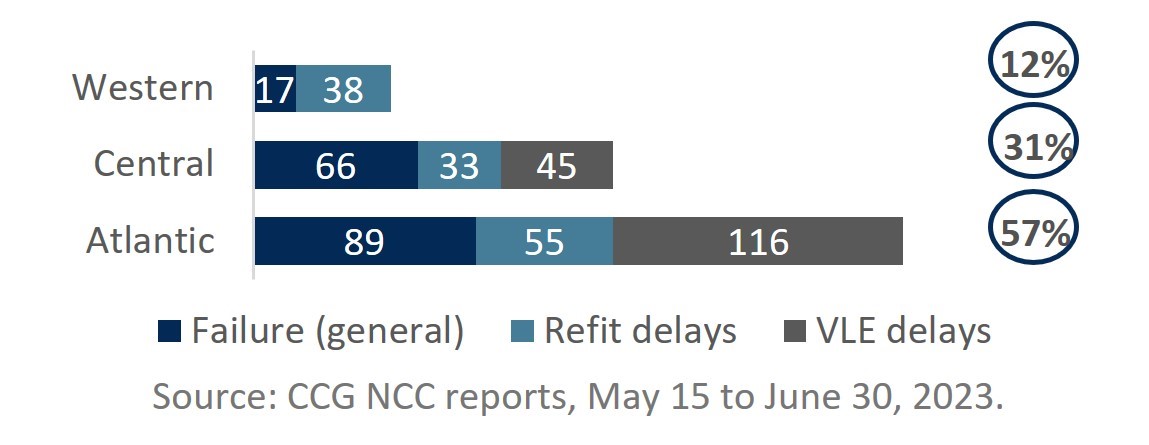
Figure 14 – Long Description:
The Western region lost 17 vessel days due to general failure and 38 days to refit delays. 12% of vessel days were lost in total.
The Central region lost 66 vessel days to general failure, 33 days to refit delays, and 45 days to VLE delays. 31% of vessel days were lost in total.
The Atlantic region lost 89 vessel days to general failure, 55 days to refit delays, and 116 days to VLE delays. 57% of vessel days were lost in total.
Source: CCG NCC reports, May 15 to June 30, 2023.
Between 2021-22 and 2022-23, the Programs sectorFootnote 5 lost 12% and 27% of allocated vessel time in the FOP due to maintenance-related issues as depicted in Figure 15 below.
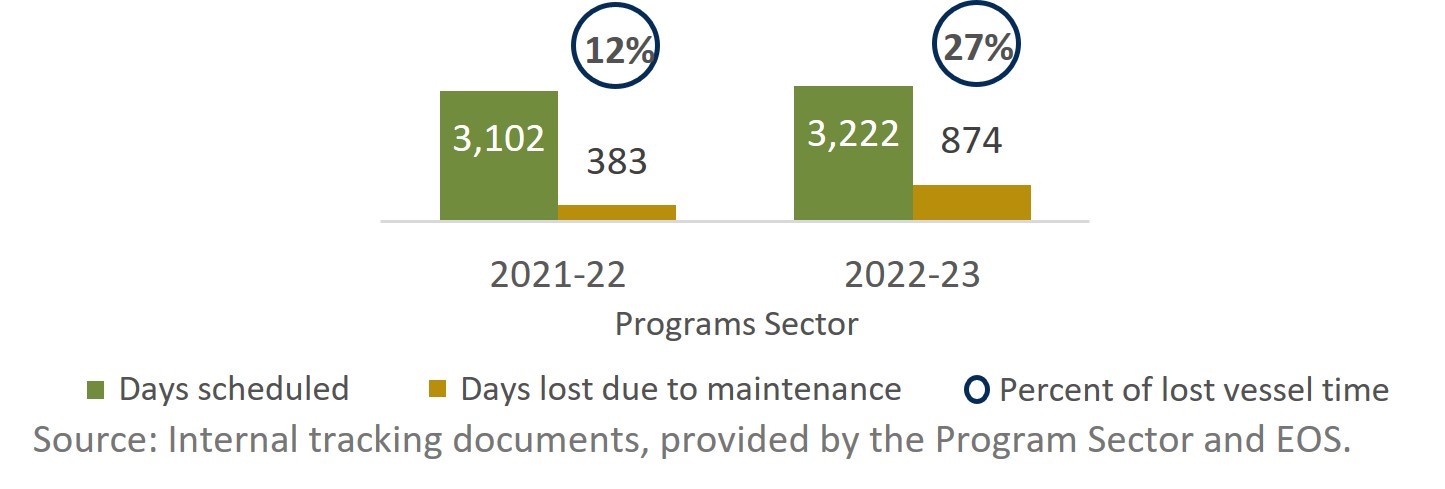
Figure 15 – Long Description:
In 2021-22, the Programs Sector reported 3,102 vessel days planned and 383 vessel days lost, amounting to 12% of vessel days lost.
In 2022-23, the Programs Sector reported 3,222 vessel days planned and 874 vessel days lost, amounting to 27% of vessel days lost.
Source: Internal tracking documents, provided by the Program Sector and EOS.
In 2022-23, the Ecosystem and Oceans Science (EOS) sector lost 8% of allocated vessel time in the FOP for offshore science programs and 19% for inshore and hydro science due to maintenance-related issues, as depicted in Figure 16 below.
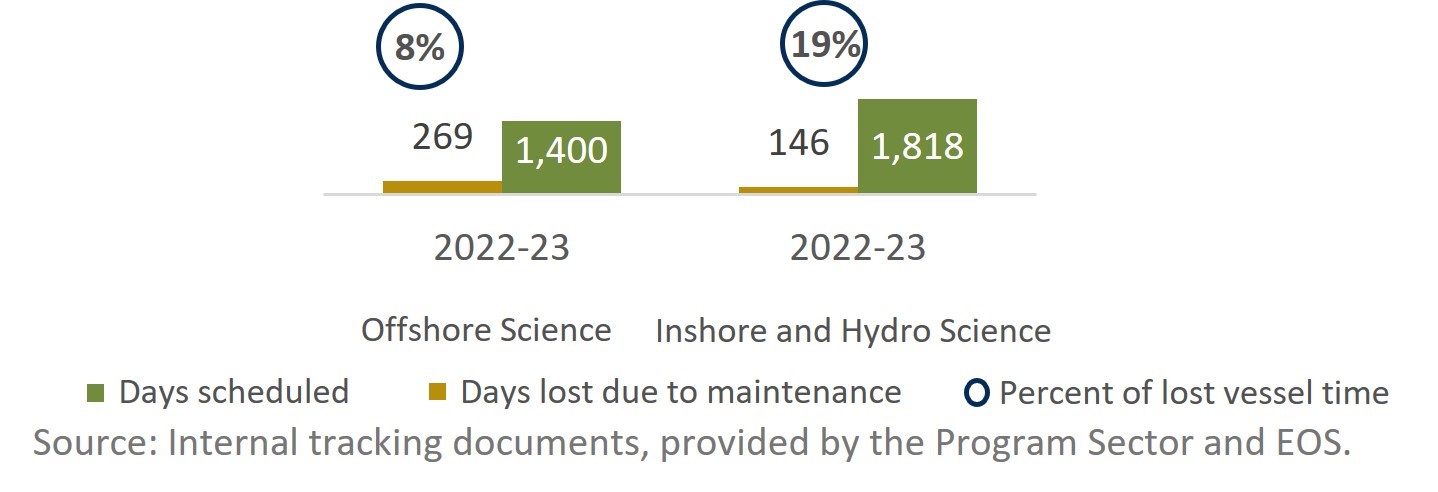
Figure 16 – Long Description:
Offshore Science reported 1,400 days vessel days scheduled and 269 vessel days lost, amounting to 8% of vessel days lost.
Inshore and Hydro Science reported 1,818 vessel days scheduled and 146 vessel days lost, amounting to 19% of vessel days lost.
Source: Internal tracking documents, provided by the Program Sector and EOS.
3.6 Risks and impacts to program clients, industry, and communities
Finding: Despite the complex operational environment and capacity challenges, CCG is still able to maintain vessels and vessel electronic assets, systems, and applications in a relatively good condition, meeting regulatory and safety requirements. However, vessel days lost due to maintenance-related issues have an impact on CCG and DFO program delivery. Associated risks extend beyond DFO/CCG programming and include reputational risk to DFO/CCG should mandate or international commitments not be met as well as risks to industries and communities that depend on DFO/CCG services.
Risks to operations for CCG programs
Interruptions to CCG program operations impact DFO/CCG’s ability to meet core responsibilities related to marine navigation and marine operations and response. For instance, having 5 out of 6 large vessels in the Western region undergoing VLE between 2022 and 2027 puts additional pressure on CCG’s ability to support programs during that time period (Source: 2022 Western Region Fleet Mix Risk Analysis).
Marine Navigation:
- Gaps in the Icebreaking Services program have impacts on navigation, access to ports and fishing harbours, Arctic patrols related to national security, and SAR coverage. Northern communities that rely on sea lift operations for supplies may also be at risk.
- Delays in placing and maintaining the approximately 17,000 short-range aids to navigation overseen by the Aids to Navigation (AtoN) program (e.g., buoys and leading marks) have impacts on the navigation of both CCG and commercial vessels. Associated economic impacts may also be far reaching with regards to delay in opening of fisheries and delays in the shipment of goods. AtoN program data indicates that 25% - 30% of buoys were deployed later than planned in the Western and Central region (St. Lawrence sector) during the last period of four years. As well, 17 weeks of AtoN program time were lost in the Western region in 2022-23 due to maintenance. For the last two years, the Western region has not been able to meet the national service level standard for operational reliability of short-range aids to navigation system (target being 99%), calculated over a 3-year period.
Marine Operations and Response:
- Delays in Search and Rescue program delivery or gaps in program coverage have impacts on the program’s response times and degree of mission risk, which correlate with lives lost in case of incidents. Additionally, there is an increased risk that the department may not meet its legal and international obligations as stipulated by the International Convention on Marine Search and Rescue. Ultimately, the vessel coverage support of the CCG SAR mandate is the highest priority for vessel time planning.
- Gaps in Marine Security programming have impacts on the Marine Security Enforcement Teams’ (MSET) ability to patrol the Great Lakes – St. Lawrence Seaway and ensure on-water law enforcement. They may also impede the ability of MSET’s to respond appropriately to potential threats.
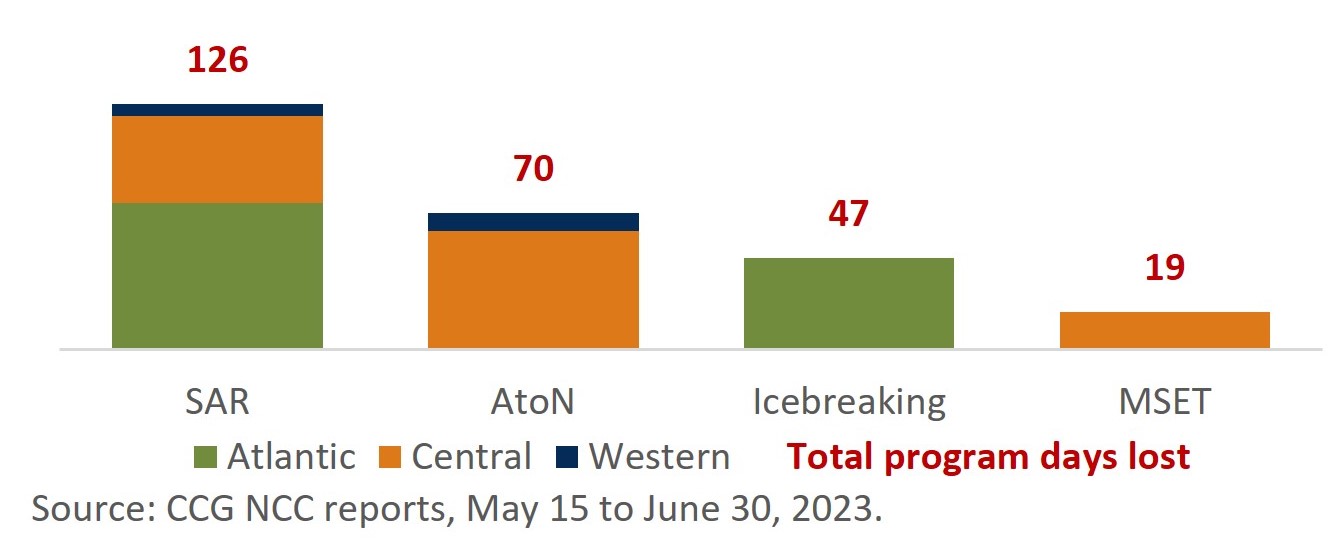
Figure 17 – Long Description:
SAR lost 75 program days in the Atlantic region, 45 in Central, and 6 in Western, losing 126 days total.
AtoN lost 81 program days in the Central region and 9 days in Western, losing 70 days total.
Icebreaking lost 47 program days in the Atlantic region.
MSET lost 19 days in the Central region.
Source: CCG NCC reports, May 15 to June 30, 2023.
Risks to operations for DFO programs
Interruptions to DFO programming impacts the department’s ability to meet core responsibilities related to fisheries, aquatic ecosystems, and marine navigation.
Fisheries:
- A lack of vessel availability for Conservation and Protection (C&P) patrols impacts the program’s ability to enforce and ensure compliance with maritime and fisheries regulations. This may increase risks of overfishing, including of marine protected areas and endangered species. The risks are even higher if C&P needs to reduce offshore patrols due to lack of vessels of appropriate capacity and special equipment.
- Under the North Atlantic Fisheries Organization (NAFO), DFO/CCG contributes to the management and conservation of high seas fishery resources in the Northwest Atlantic Ocean. Loss of vessel days may mean Canada is unable to meet its international NAFO commitments. As reported in C&P internal documents, 50% overall vessel days were lost related to NAFO due to refit delays in 2022-23.
Aquatic Ecosystems:
- Reduced vessel time for DFO science programs has impacts on key data collection work, such as research surveys and stock assessments, including long-term series data. Disruptions pose a risk from having to rely on older data to inform policy and decision-makingFootnote 6 which in turn poses a reputational risk to the department if scientific integrity is perceived as compromised. In addition, there could be impacts to industry (e.g., loss of eco-certification required for accessing markets) and spin-off impacts to communities.
Marine Navigation:
- Gaps in vessel availability for Canadian Hydrographic Service (CHS) missions have impacts on the program’s ability to acquire foundational bathymetric data, create and update navigational products and services (e.g., hydrographic charts), and support sound scientific recommendations and advice as well as critical SAR decision-making. As indicated in CHS internal reporting documents, 2.5 months of Canadian Hydrographic Service survey time was lost in 2022-23 due to engine failure and VLE delays.
With changes to the fleet’s fisheries science vessels, ensuring the continuity of 30-year time series data has been a priority for fisheries science. Comparative fishing is used to assess conversion factors between data collected on new and legacy fisheries vessels by pairing them and conducting targeted comparative fishing exercises for key stocks simultaneously. A plan established in 2022 assumed four vessels would be available until 2024 for this work, however the high failure rates of the vessels and unexpected earlier decommissioning of CCGS Alfred Needler impacted the success of the plan.
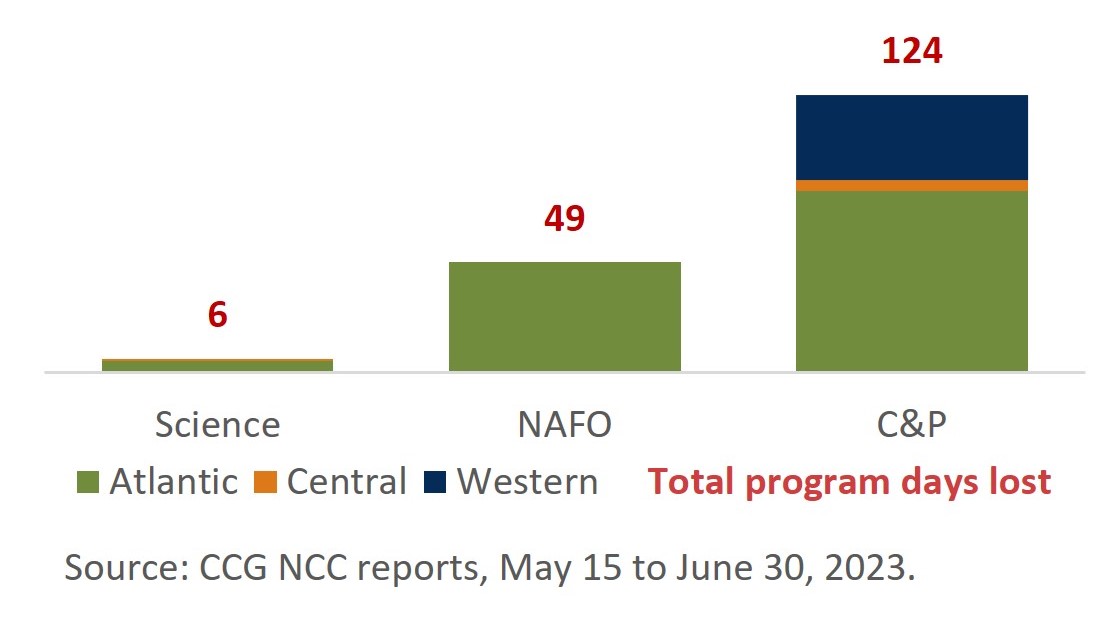
Figure 18 – Long Description:
Science lost 5 program days in the Atlantic region and 1 in Central, losing 6 days total.
NAFO lost 49 program days in the Atlantic region.
C&P lost 81 program days in the Atlantic region, 5 in Central, and 38 in Western, losing 124 days in total.
Source: CCG NCC reports, May 15 to June 30, 2023.
3.7 Strategies to mitigate vessel unavailability
Finding: Mitigation strategies employed by DFO/CCG encompass several approaches, including chartering vessels, optimizing vessel usage, adjusting programming, and continuing to implement large-scale refurbishment measures.
Vessel chartering
To mitigate risks due to vessel unavailability, program clients primarily charter alternative vessels. That said, vessel chartering remains a challenge due to the specialized nature of most programs. Since 2017-18, $114.1 million has been spent by the department on vessel chartering, though not all chartered vessel expenditures can be linked to vessel unavailability as illustrated in Figure 19 below. For instance, Science expenditures in 2017-18 to 2019-20 are a result of an unavailable vessel, whereas CCG program expenditures in 2019-20 to 2022-23 are a result of dedicated funding received for chartering as an interim measure.
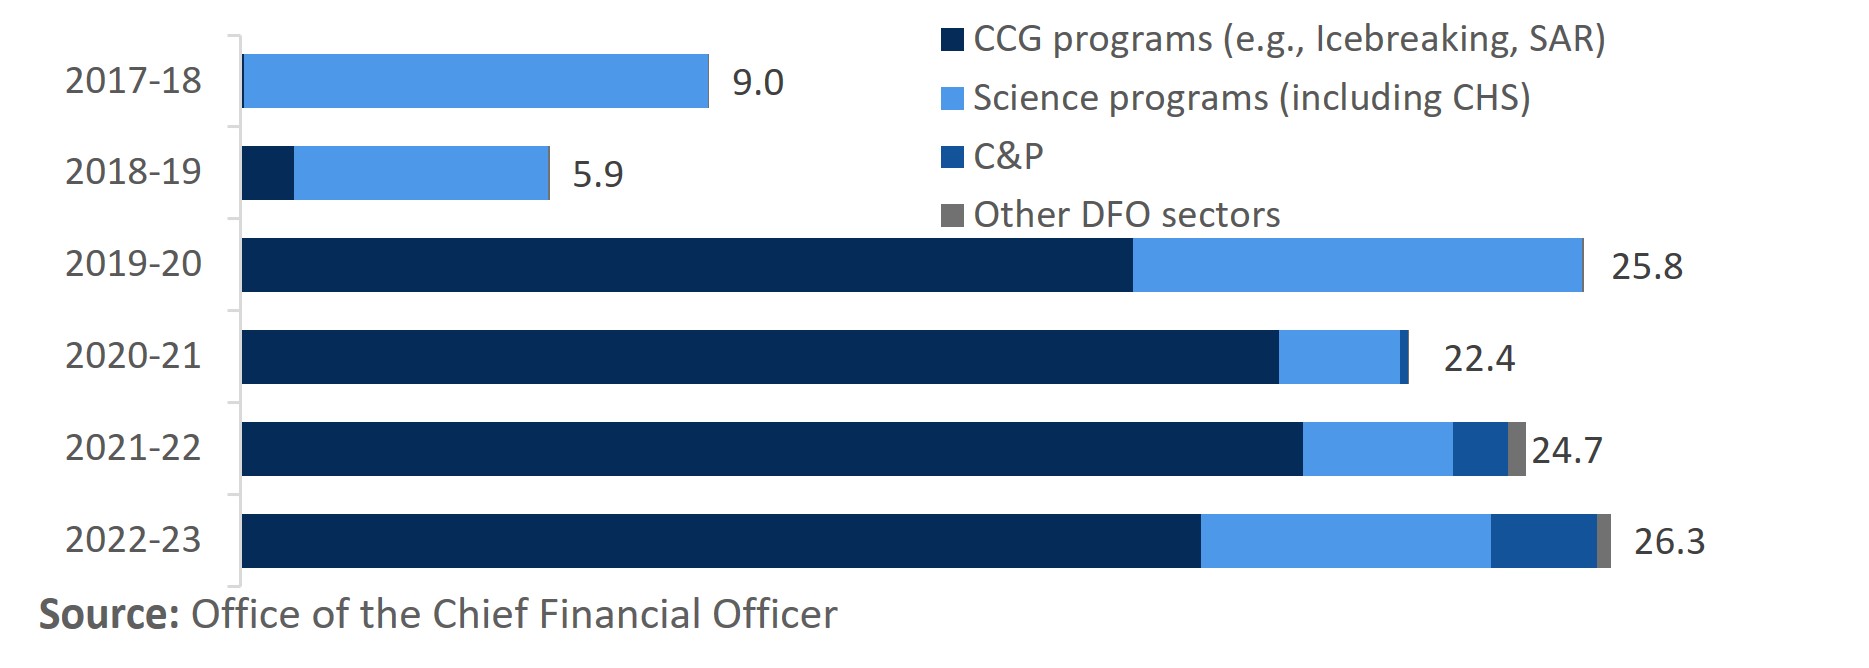
Figure 19 – Long Description:
The stacked bar graph shows the chartered vessel expenditures, by four sectors (CCG programs, Science programs, C&P, other DFO sectors), for the six-year period from 2017-18 to 2022-23. The overall expenditures are $9M in 2017-18, $5.9M in 2018-19, $25.8M in 2019-20, $22.4M in 2020-21, $24.7M in 2021-22 and $26.3M in 2022-23.
The chartered expenditures of CCG programs (e.g., icebreaking, SAR) are not tracked in 2017-18, and are about 20% of the overall expenditures in 2018-19 (with Science programs being about 80%). From 2019-20 to 2022-23, the CCG programs expenditures are significantly higher and are at least 60% of the overall annual expenditures, followed by the expenditures of Science programs for the same period. In comparison, the C&P chartered expenditures are less, but have increased from 2020-21 t0 2022-23. The chartered expenditures of other DFO sectors are minimal, and are tracked only in 2021-22 and 2022-23.
Source: Office of the Chief Financial Officer
Programming adjustments
Program adjustments and alterations can happen when vessels are not available as planned in the FOP. However, this is not sustainable nor recommended as a long-term mitigation strategy because of the risk of under-delivery and failure to meet key program requirements. Changes in planned work can also have a significant impact on time-sensitive activities (e.g., those that depend on biological or ecological cycles). Furthermore, program clients may incur the same or increased costs and effort, particularly when there is not enough time to revise plans, vessel budgets are strained, and additional funds for mitigating strategies (e.g., vessel chartering) are required. Cost recovery mechanisms to alleviate financial strain on program clients would be beneficial.
Optimizing and leveraging available vessels
When vessels are not available as planned, the Regional Operations Centre works to re-task and multi-task vessels (e.g., allocate two or more concurrent programs on one vessel), which is a near-universal CCG practice. While this mitigates some impacts of lost vessel time, the use of alternative assets was noted to require adjustments or reductions in the scope of program work as well as logistical arrangements (e.g., shifting necessary equipment between vessels).
Implementing large-scale refurbishment measures
Following on the lessons learned and results of VLE 2012, a $2.1B investment was approved in 2020 over 20 years (2020-21 to 2039-40) to undertake further large-scale refurbishment projects. The first phase of the initiative taking place between 2021-22 and 2028-29 consists of 87 projects of three types: mid-life modernization, vessel life extension and special projects, as depicted in Figure 20 below. These measures are necessary to maintain operational capabilities until new ships can be delivered. Of note, VLE cannot mitigate completely the delays. Several vessels reached the end of service life and could no longer be repaired before the replacement were available, and this trend will most likely continue.
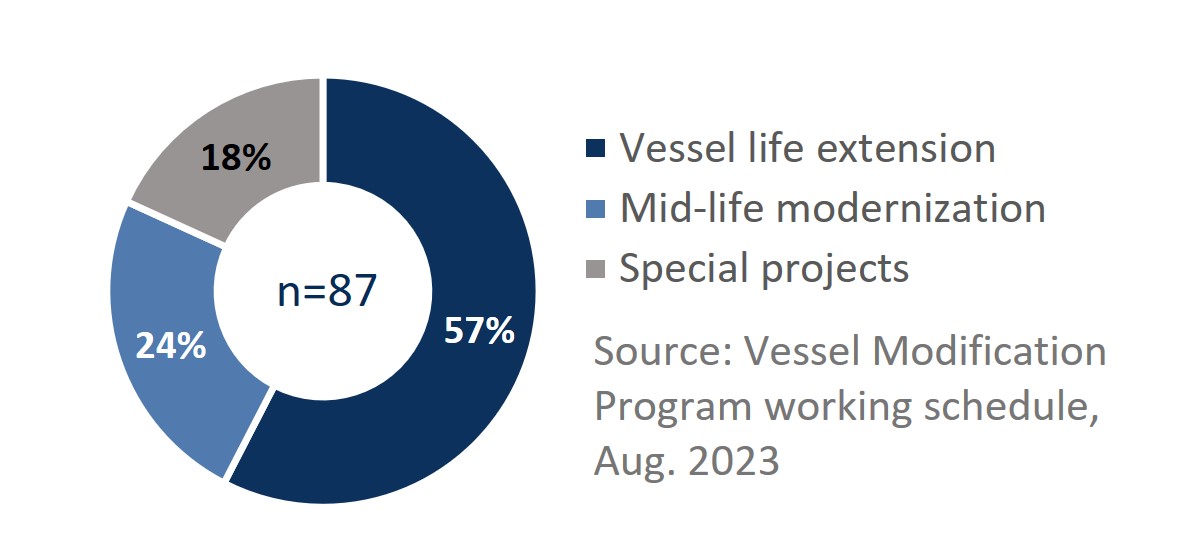
Figure 20 – Long Description:
57% of planned projects are VLE, 24% are mid-life modernization, and 18% are special projects. There are 87 projects planned in total.
Source: Vessel Modification Program working schedule, Aug. 2023
4.0 Recommendations
As a result of the evaluation findings, three recommendations have been developed.
Recommendation 1
It is recommended that the Deputy Commissioner, Shipbuilding and Materiel, in coordination with the Assistant Deputy Minister, People and Culture, stabilize the organizational structure of Integrated Technical Services, including ensuring positions are classified appropriately, finalizing the organizational charts, and completing required staffing.
Recommendation 2
It is recommended that the Deputy Commissioner, Shipbuilding and Materiel implement a standard process to holistically collect, track, and report on the delivery of fleet maintenance activities to support ongoing measurement of performance and ensure that roles and responsibilities for collecting and reporting on the data are clearly established and communicated.
Recommendation 3
It is recommended that the Deputy Commissioner, Shipbuilding and Materiel, in coordination with the Chief Financial Officer, collaborate to review and identify where improvements could be made to maintenance-related financial management processes, particularly those related to tools and support for procurement and forecasting.
5.0 Annexes
Annex A: Management Action Plan
Evaluation of Fleet Procurement and Maintenance
Approval Date: July 2024
MAP Completion Target Date: March 31, 2026
Lead ADM/DC: Deputy Commissioner, Shipbuilding and Materiel
Recommendation 1: March 2025
Recommendation: It is recommended that the DC, Shipbuilding and Materiel, in coordination with the ADM, People and Culture, stabilize the organizational structure of Integrated Technical Services, including ensuring positions are classified appropriately, finalizing the organizational charts, and completing required staffing.
Rationale: The Fleet Maintenance program was facing pressures related to an increasing scope of work to deliver maintenance activities in a timely manner and thus created positions through various special projects and initiatives. These positions were created quickly and lacked longer-term planning and standardization. To date, the team has not had the capacity to stabilize the organizational structure. This has resulted in a lack of alignment with the long-term nature of maintenance-related projects and challenges attracting and retaining qualified personnel. A stable organizational structure would improve the Fleet Maintenance program’s efficiency and ability to fulfill its responsibilities.
Management response: Management agrees with this recommendation. Integrated Technical Services (ITS) conducted a significant organizational review exercise throughout the fall of 2023 that steadily increased the focus on the Fleet Maintenance Program re-organization efforts. Through this exercise, the state of the organization was rationalized to accurately assess and understand the necessary steps to stabilize the organizational structure. This included an assessment of the number and nature of positions within each of the directorates/regions with an overlay of personnel, anticipated human resources processes, and associated funding.
A key issue is the ongoing reorganization of the national Fleet Maintenance Program, encompassing Marine Engineering (ME) and a newly formed Vessel Modification Projects (VMP) directorate. This reorganization, which began in 2019, has seen limited success to date due to a number of administrative challenges. Some progress has been made over the last five years based on anticipated endorsement, but has resulted in the creation of many risk-managed positions and a cumbersome number of acting appointments, which has compromised a culture of job-insecurity and the development of program priorities. A significant amount of work remains to stabilize the organization, including the classification of risk managed positions and staffing actions to establish a more permanent workforce.
In response to this recommendation, Management agrees to solidify the national Vessel Maintenance Management Program (VMMP) organization, encompassing the ME and VMP directorates, both in headquarters and the regions. Management and key personnel within ITS will work with Fisheries & Oceans Canada (DFO) People and Culture (P&C) to create the organization with full senior management endorsement.
There are approval, funding, and classification risks associated with the implementation of this recommendation that we are tracking. These risks could impact the ability to implement the changes in a timely manner.
Link to larger program or departmental results (if applicable):
- Values and Ethics Code for the Public Sector and DFO-CCG values of Respect for People and Excellence
- DFO-CCG Departmental Plan
- Oceans Protection Plan (OPP)
- National Shipbuilding Strategy (NSS)
- Fleet Sustainability Initiative (FSI)
- Fleet Maintenance Program Results P30
| MAP results statement
Result to be achieved in response to the recommendation |
MAP milestones Critical accomplishments to ensure achievement of results for PMEC’s approva |
Completion date Month, Year |
RD/DG responsible |
|---|---|---|---|
1. The Fleet Maintenance Program organization implementation plan receives senior management endorsement. The ITS organization is rationalized, all risk managed positions are resolved and the organization is stabilized. |
1.1 Draft ITS organization cleanup plan (including modified Marine Engineering re-organization plan) is created in collaboration with DFO P&C and is endorsed by DC, Shipbuilding & Material. |
February 2024 |
DG, ITS |
1.2 Organization stabilization issues that can be corrected through administrative measures are resolved and a risk mitigation plan is created to track and monitor organization stabilization issues subject to longer term solutions and/or additional work. |
April 2024 |
DG, ITS |
|
1.3 The Fleet Maintenance Program Organization is revised in accordance with the DC’s endorsement and the fleet maintenance organization chart has been signed. |
April 2024 |
DG, ITS |
|
1.4 Management communicates the full reorganization plan to ME and VMP personnel. |
September 2024 |
DG, ITS |
|
1.5 Management implements the approved ME and VMP organizations in collaboration with DFO P&C. |
March 2025 |
DG, ITS |
Recommendation 2: March 2026
Recommendation: It is recommended that the DC, Shipbuilding and Materiel implement a standard process to holistically collect, track, and report on the delivery of fleet maintenance activities to support ongoing measurement of performance and ensure that roles and responsibilities for collecting and reporting on the data are clearly established and communicated.
Rationale: The Fleet Maintenance program is responsible for planning, conducting, and reporting on various activities related to the in-service (e.g., maintenance, repair, and modification of assets throughout their operational life) and disposal phases of vessels’ life cycle management. Because the planning and delivery of maintenance activities is reflected and tracked through multiple mechanisms and for different purposes, there is no central repository where data on all aspects of maintenance is consistently organized in a standardized format that facilitates analysis, reporting and communication. Thus, many aspects of priority-setting and decision-making, including work and resource planning, may not be based on a holistic assessment of needs or the best information available. In addition, it makes it challenging to report on program performance in a consistent way.
Management response: Management agrees with this recommendation. ITS has made positive steps to advance and modernize the reporting of ongoing and emergent vessel maintenance activities and issues. Work was initiated and is ongoing to develop an application that will serve as the system of record for maintenance reporting and status.
The Fleet Status System (FSS) is being developed by CCG Tactical IT Systems and CCG Logistical Systems in collaboration with the CCG maintenance and operational support communities to support the priority for a data-ready organization. FSS will allow CCG to monitor vessel operational readiness in real time and provide up-to-date data through an accessible single platform.
In the interim, while FSS is being developed, ITS has recently improved its reporting capabilities by introducing centrally stored (GCDocs), accessible weekly reports that capture all maintenance activities and projects for the CCG Fleet. ME refits and maintenance activities are being tracked through a CCG Fleet-wide national spreadsheet while VMP projects are being tracked through individual customized spreadsheet templates.
The Fleet Maintenance Program has several other key documents that serve as sources of maintenance related information and planning (e.g., end of refit reports, vessel surveys, technical specifications documents, change configuration requests, incident investigation reports, refit plans, etc.). Although these documents all serve to report on various activities related to the in-service support of the Fleet Maintenance Program, management envisions a more formalized approach where these processes would be supported under one effective Quality Management System (QMS) that will document processes, procedures, and responsibilities for achieving quality policies and objectives.
As part of QMS, ITS is reviewing the Vessel Maintenance Management Manual (VMMM) which will serve as the quality manual to the entire QMS for CCG’s in-service Fleet Maintenance. ITS is also focusing on the review of the Multi-Year Maintenance Plan (MYMP) process, key maintenance documents (e.g., end of refit report, vessel survey, etc.), standard operating procedures, work instructions, forms, and process flowcharts. QMS will serve as a structured framework to coordinate and direct CCG’s maintenance activities, ensuring it meets CCG Operations requirements, complies with regulations, and continuously improves efficiency and effectiveness.
Resourcing risks associated with the implementation of this recommendation are being tracked. These risks may delay the planned implementation timeline.
Link to larger program or departmental results (if applicable):
- Public Service Modernization
- Data Strategy Framework for the Federal Public Service
- Values and Ethics Code for the Public Sector and DFO-CCG values of Respect for Democracy, Respect for People, Integrity, Stewardship and Excellence
- Fleet Maintenance Program Results P30
| MAP results statement Result to be achieved in response to the recommendation |
MAP milestones Critical accomplishments to ensure achievement of results for PMEC’s approval |
Completion date Month, Year |
RD/DG responsible |
|---|---|---|---|
2. ITS will establish a QMS that ensures CCG has the processes in place for quality execution of fleet maintenance activities and efficient, nationally consistent, and reliable reporting that is readily available to key stakeholders and Senior Management. |
2.1 Nationally synthesized maintenance reporting spreadsheets are updated weekly and centrally stored in GCDocs. |
December 2023 |
DG, ITS |
2.2 FSS is successfully developed and launched for use by CCG. |
March 2025 |
DG, ITS |
|
2.3 The CCG VMMM is reviewed and a comprehensive re-draft is ready for management endorsement. |
March 2025 |
DG, ITS |
|
2.4 All processes, documents, standard operating procedures, work instructions, forms and process flowcharts for the Fleet Maintenance program are reviewed, documented and readily available for CCG’s maintenance community, key stakeholders and senior management. |
March 2026 |
DG, ITS |
|
2.5 QMS framework is established in collaboration with key stakeholders to drive innovation, ensure process improvements, enhance time-sensitive reporting, and optimize maintenance activities. |
March 2026 |
DG, ITS |
Recommendation 3: September 2024
Recommendation: It is recommended that the DC, Shipbuilding and Materiel, in coordination with the Chief Financial Officer, collaborate to review and identify where improvements could be made to maintenance-related financial management processes, particularly those related to tools and support for procurement and forecasting.
Rationale: The Fleet Maintenance program is responsible for many assets that require the ongoing purchasing of parts and equipment as well as contracting of related services. Procurement processes and tools that are currently available to support asset maintenance are not meeting the needs of the program, that is, they lack efficiency and flexibility and have impacts on schedule, cost, and parts availability. This includes but is not limited to insufficient spending limits and financial delegated authorities, complex SAP roles and associated layers of required internal approvals, and lack of requests for proposals and standing offers. In addition, there is a lack of project management, trend analysis and forecasting expertise within the program to support decision-making given the current inflationary context.
Management Response: Management agrees with this recommendation and work is underway to address.
More specifically, ITS recently engaged DFO Procurement Hub to deliver training to Fleet Maintenance Program personnel on the processes, tools and contracting mechanisms within DFO-CCG. This training is currently under development with the national Business and Strategic Services team. It is expected that through this training, project and refit planning will better incorporate procurement and contracting activities, as well as support comprehensive forecasting for time and resources.
Additionally, ITS is participating in regular communications with the SAP Dedicated Support Team to highlight system issues impeding Fleet Maintenance Program delivery. Finally, ITS is represented on the Marine Industry Advisory Council (MIAC) and internal Marine Procurement Management Working Group (MPM) chaired and coordinated by PSPC. Through MIAC and MPM, ITS is able to collaborate to address key marine industry challenges and contribute to its growth and development.
Link to larger program or departmental results (if applicable):
- Values and Ethics Code for the Public Sector and DFO-CCG values of Stewardship and Excellence
- Management Accountability Framework Financial Management Methodology
- DFO-CCG Procurement Roadmap
- Fleet Maintenance Program Results P30
| MAP results statement Result to be achieved in response to the recommendation |
MAP milestones Critical accomplishments to ensure achievement of results for PMEC’s approval |
Completion date Month, Year |
RD/DG responsible |
|---|---|---|---|
3. ITS will coordinate and collaborate with the Chief Financial Officer, PSPC and other key stakeholders to review and identify where improvements can be made to maintenance-related financial management processes, particularly those related to tools and support for procurement and forecasting. |
3.1 Collaborate with SAP Dedicated Support Team to highlight system issues impeding Fleet Maintenance Program delivery by participating in SAP Business & Technology Assessments with IBM. |
February 2024 |
DG, ITS |
3.2 Collaborate with DFO Procurement Hub to identify specific training needs within Fleet Maintenance Program community and rollout training. |
June 2024 |
DG, ITS |
|
3.3 Participate in MIAC and MPM in order to highlight challenges faced by CCG Fleet Maintenance Program and continue to collaborate for public service and marine industry wide solutions. |
August 2024 |
DG, ITS |
- Date modified: