Evaluation of fleet procurement and maintenance
Overview of the Fleet Procurement and Fleet Maintenance programs
The Fleet Procurement (FP) and Fleet Maintenance (FM) programs are responsible for the “cradle to grave” management of CCG vessels and assets throughout the four phases of the CCG’s national Life Cycle Management System including conception, acquisition, in-service, and disposal. The evaluation was designed to address key information needs of CCG senior management regarding the capacity of the CCG to conduct vessel maintenance activities, including line one, two, and three maintenance conducted by ITS and other program delivery partners (i.e., Fleet Operations).
As of 2022-23, the CCG fleet consists of 124 active vessels managed across 16 large and small vessel classes. Most vessels have one or two planned maintenance periods per year and the duration of each period varies by vessel class.
Program clients supported by the FM program:
- Icebreaking Services
- Aids to Navigation
- Waterways Management
- Marine Security
- Marine Hazards and Environmental Response
- Search and Rescue
- Conservation and Protection
- Ecosystems and Ocean Science
- Canadian Hydrographic Services
- Fisheries Management
About the evaluation
Scope: The scope of the evaluation focused on the period between 2017-18 to 2022-23. Some activities starting prior to 2017-18 were included when they continued after 2017-18. The in-service phase was the focus of this evaluation as this is where the bulk of fleet maintenance activities take place. Procurement activities have been well documented through previous reports and audits.Footnote 1 Thus, with respect to fleet procurement, the scope of the evaluation was limited to procurement activities, such as the National Shipbuilding Strategy, that have had a significant impact on vessel maintenance and CCG program delivery as part of the broader operational context for the FM program.
Methodology: The evaluation gathered the perspectives of key program staff and program clients. Evidence was gathered through multiple lines of evidence including interviews, a survey, document and file reviews, financial and administrative data analyses, as well as site observations.
Key findings
Operational context
Fleet procurement and maintenance activities take place within a complex and evolving environment. Several external factors, such as the aging fleet illustrated in Figure 1 below, lengthy procurement processes, and the state of the ship and boat building industry influence the scope of maintenance work required and the CCG’s capacity to undertake the work.
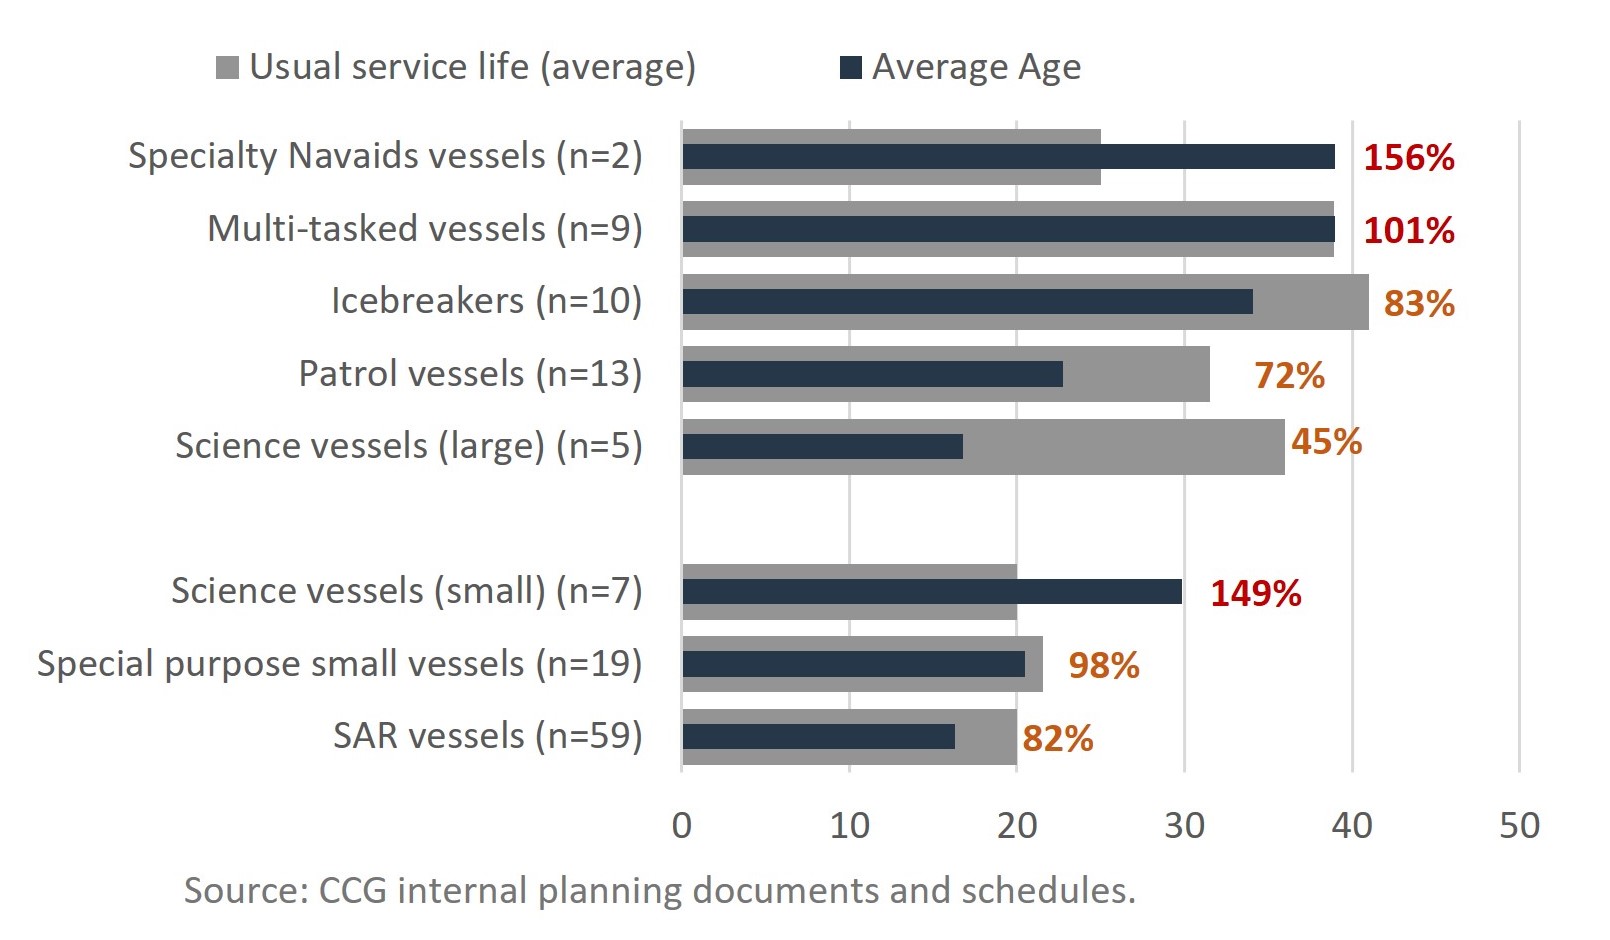
Figure 1 - Long Description:
Speciality Navaids vessels (n=2) have exceeded their usual service life by 156%.
Multi-tasked vessels (n=9) have exceeded their usual service life by 101%.
Icebreakers (n=10) are at 83% of their usual service life.
Patrol vessels (n=13) are at 72% of their usual service life.
Large science vessels (n=5) are at 45% of their usual service life.
Small science vessels (n=7) have exceeded their usual service life by 149%.
Special purpose small vessels (n=19) are at 98% of their usual service life.
SAR vessels (n=59) are at 82% of their usual service life.
Source: CCG internal planning documents and schedules.
Delays with the delivery of NSS ships have placed pressure on the FP and FM programs, requiring them to implement interim measures, such as vessel life extensions and modification projects, which are not part of typical life cycle management activities.
The arrival of the first NSS vessels led to challenges within the CCG due to a lack of organizational expertise and infrastructure to support the transition of new vessels into service.
Capacity
While external factors are increasing the demand and workload for vessel maintenance operations, several internal factors also impact the program’s capacity to deliver maintenance. These include the ability to recruit and retain qualified personnel, budgetary constraints, spending limits, the cyclical nature of the maintenance funding envelope, challenges with the organizational structure, the ability to carry out lifecycle management, as well as the ability to take maintenance-specific training as depicted in Figure 2 below.
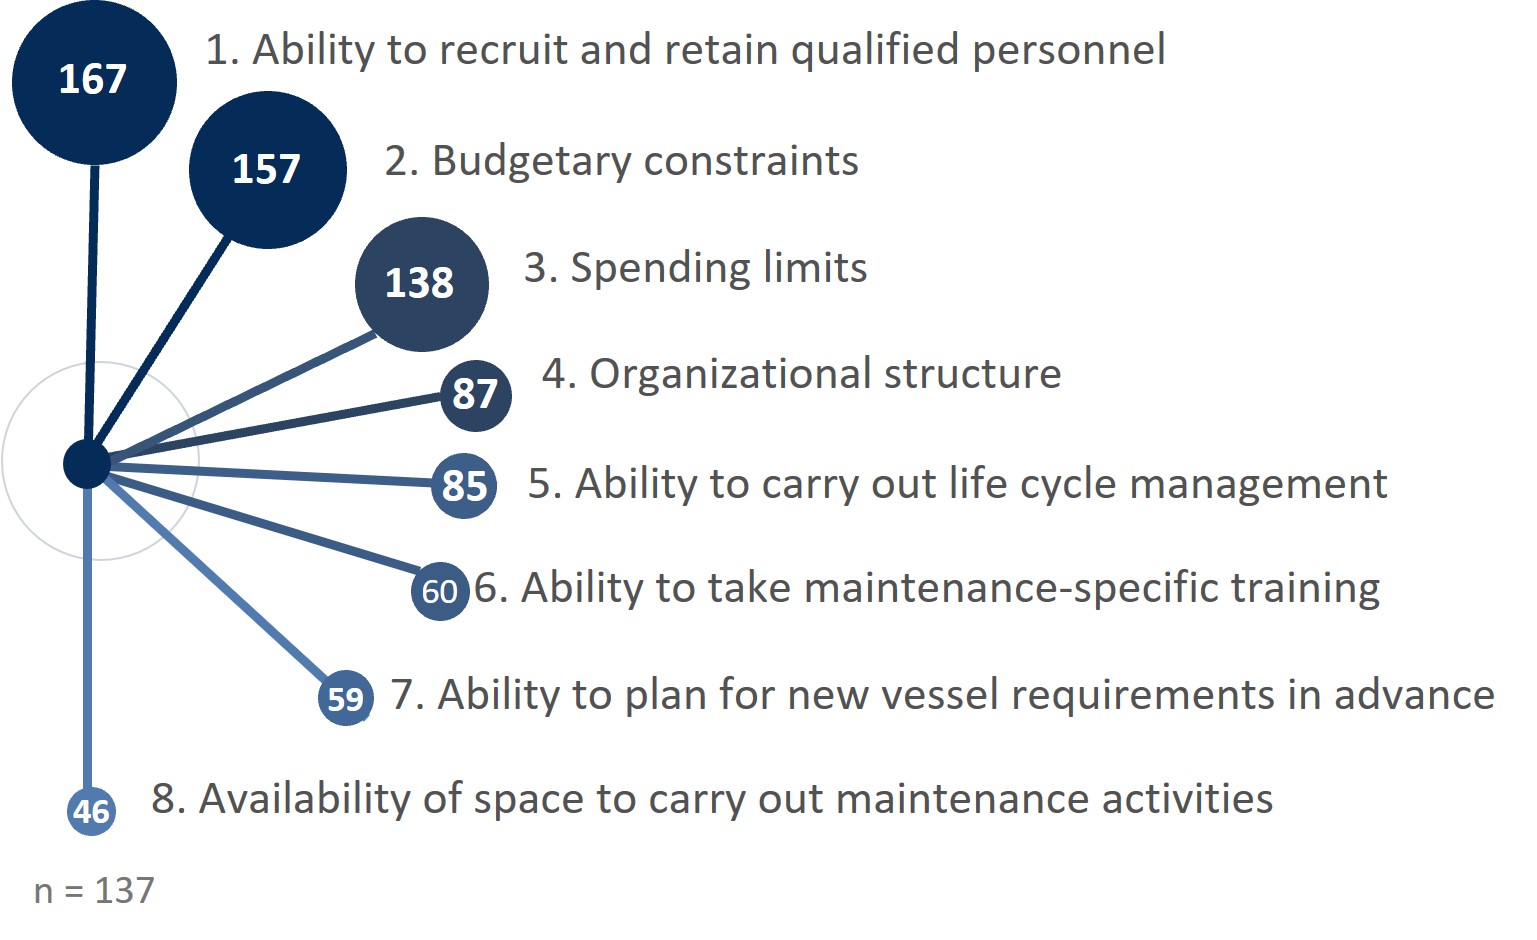
Figure 2 - Long Description:
1. Ability to recruit and retain qualified personnel (weight – 167)
2. Budgetary constraints (weight – 157)
6. Ability to take maintenance-specific training (weight – 60)
7. Ability to plan for new vessel requirements in advance (weight – 59)
8. Availability of space to carry out maintenance activities (weight – 46)
There were 137 respondents.
The delivery of fleet maintenance activities were assessed through indirect means due to a lack of formal and consolidated reporting on the implementation of maintenance activities. Alongside, dry dock, and onboard self-maintenance were found to be completed as planned half of the time, as illustrated in Figure 3 below. Refit and vessel life extension maintenance activities have experienced delays, with refit activities being more significantly impacted.
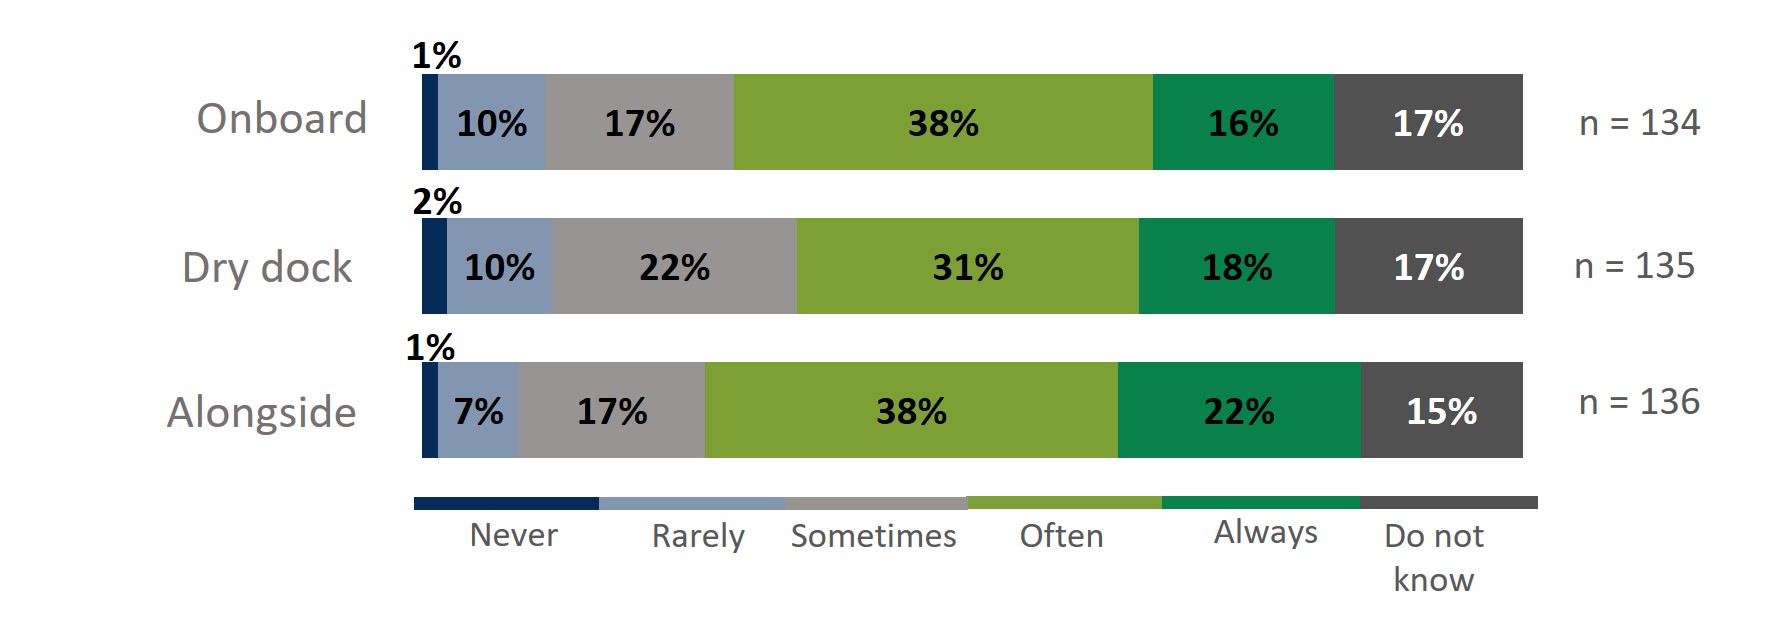
Figure 3 – Long Description:
Regarding alongside maintenance, 1% strongly disagreed, 10% disagreed, 17% neither disagreed nor agreed, 38% agreed, 16% strongly agreed, and 17% did not know. There were 136 respondents.
Regarding dry dock maintenance, 2% strongly disagreed, 10% disagreed, 22% neither disagreed nor agreed, 31% agreed, 18% strongly agreed, and 17% did not know. There were 135 respondents.
Regarding onboard maintenance, 1% strongly disagreed, 7% disagreed, 17% neither disagreed nor agreed, 38% agreed, 22% strongly agreed, and 15% did not know. There were 134 respondents.
Despite the complex operational environment and capacity challenges, CCG is still able to maintain vessels and vessel electronic assets, systems, and applications in a relatively good condition, meeting regulatory and safety requirements.
Risks to departmental programs and mitigation
Maintenance related issues have resulted in vessels not always being available and reliable to deliver CCG programs, particularly when corrective maintenance needs arise and when maintenance work cannot be completed within planned periods, as illustrated in Figure 4 below. Given that an increase in corrective maintenance-related issues is closely aligned with an aging fleet, and delays with the delivery of new vessels continues, it is expected that the number of non-operational vessel days due to unplanned maintenance will continue to increase in the coming years.

Figure 4 – Long Description:
In 2020-21, 5.7% of FOP vessel days were lost due to corrective maintenance, 5.8% to refit delays, and 1% to VLE delays. 12% of FOP days were lost in total.
In 2019-20, 4.3% of FOP vessel days were lost due to corrective maintenance, 4.4% to refit delays, and 1% to VLE delays. 10% of FOP days were lost in total.
In 2018-19, 3.6% of FOP vessel days were lost due to corrective maintenance, 2.9% to refit delays, and 0.5% to VLE delays. 7% of FOP days were lost in total.
Source: CCG operational data extracted from internal systems on Feb 10, 2022.
Vessel days lost due to maintenance-related issues have had an impact on CCG and DFO program delivery (e.g., the planned allocated vessel time lost was: 12% in 2021-22 and 27% in 2022-23 for the Programs sector; 8% for the offshore science programs and 19% for inshore and hydro science in 2022-23). Associated risks extend beyond DFO/CCG programming and include reputational risk to DFO/CCG should mandate or international commitments not be met as well as risks to industries and communities that depend on DFO/CCG services.
Mitigation strategies employed by DFO/CCG encompass several approaches, including chartering vessels, optimizing vessel usage, adjusting programming, and continuing to implement large-scale refurbishment measures, such as those depicted in Figure 5 below.
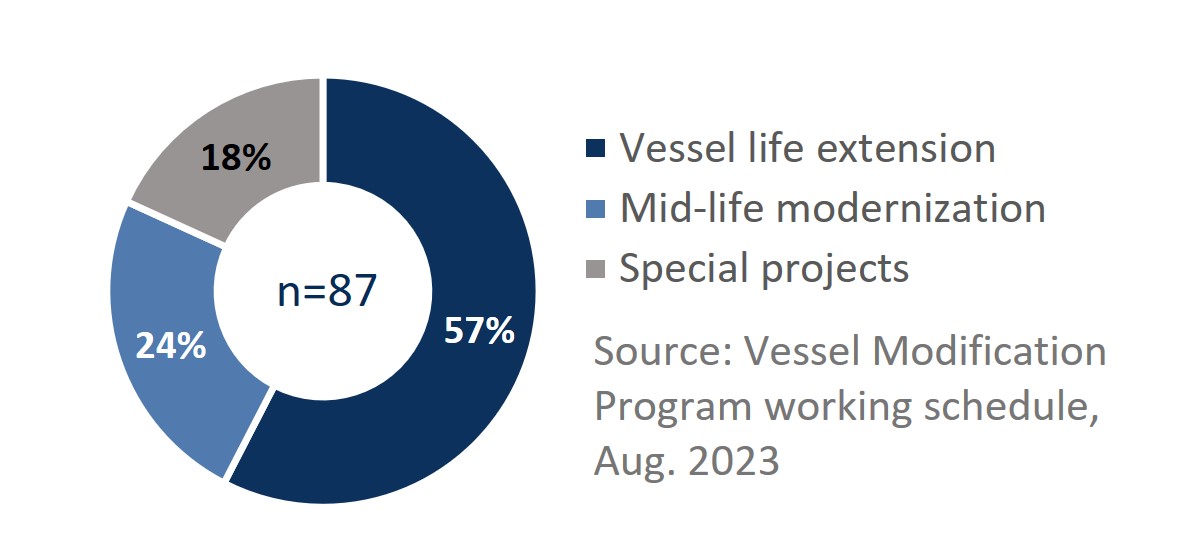
Figure 5 – Long Description:
57% of planned projects are VLE, 24% are mid-life modernization, and 18% are special projects. There are 87 projects planned in total.
Source: Vessel Modification Program working schedule, Aug. 2023
Collaboration and decision-making
Operational priority setting with respect to fleet maintenance is well-supported via various mechanisms, such as the Vessel Condition Survey (VCS), Fleet Operation Plan (FOP), Vessel Maintenance Management Manual (VMMM), and Multi-Year Maintenance Plan (MYMP), were found to be mostly working well, as illustrated in Figure 6 below.
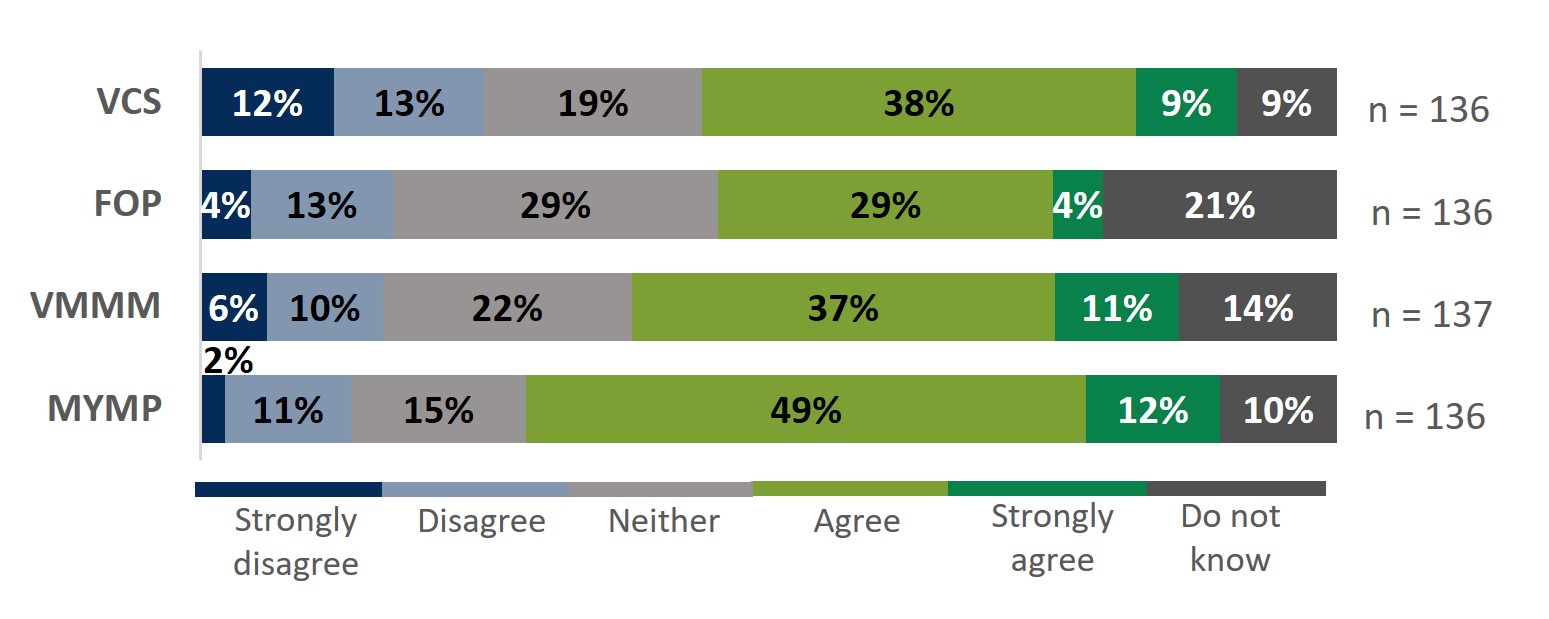
Figure 6 – Long Description:
Regarding the VCS, 12% of respondents strongly disagreed, 13% disagreed, 19% neither disagreed nor agreed, 38% agreed, 9% strongly agreed, and 9% did not know. There were 136 respondents.
Regarding the FOP, 4% strongly disagreed, 13% disagreed, 29% neither disagreed nor agreed, 29% agreed, 4% strongly agreed, and 21% did not know. There were 136 respondents.
Regarding the VMMM, 6% strongly disagreed, 10% disagreed, 22% neither disagreed nor agreed, 37% agreed, 11% strongly agreed, and 14% did not know. There were 137 respondents.
Regarding the MYMP, 2% strongly disagreed, 11% disagreed, 15% neither disagreed nor agreed, 49% agreed, 12% strongly agreed, and 10% did not know. There were 136 respondents.
Nevertheless, decision-making was found to be somewhat ineffective, as shown in Figure 7 below, and could be improved with regards to regional involvement in vessel procurement, as well as access to consolidated maintenance information to facilitate reporting and analysis.

Figure 7 – Long Description:
18% of respondents strongly disagreed, 23% disagreed, 29% neither disagreed nor agreed, 24% agreed, 3% strongly agreed, and 3% did not know. There were 137 respondents.
The roles and responsibilities of fleet maintenance partners are somewhat defined in multiple guidance documents. However, in practice these roles and responsibilities are not always well-understood.
Communication and coordination is effective in some cases, but challenges exist due to the multiple layers of collaboration required and there are opportunities for improvement.
Recommendations
Recommendation 1
It is recommended that the Deputy Commissioner, Shipbuilding and Materiel, in coordination with the Assistant Deputy Minister, People and Culture, stabilize the organizational structure of Integrated Technical Services, including ensuring positions are classified appropriately, finalizing the organizational charts, and completing required staffing.
Recommendation 2
It is recommended that the Deputy Commissioner, Shipbuilding and Materiel implement a standard process to holistically collect, track, and report on the delivery of fleet maintenance activities to support ongoing measurement of performance and ensure that roles and responsibilities for collecting and reporting on the data are clearly established and communicated.
Recommendation 3
It is recommended that the Deputy Commissioner, Shipbuilding and Materiel, in coordination with the Chief Financial Officer, collaborate to review and identify where improvements could be made to maintenance-related financial management processes, particularly those related to tools and support for procurement and forecasting.
- Date modified: