
Fisheries and Oceans management of aquaculture and the application of the precautionary approach
Introduction
The Government of Canada views its commitment to the precautionary approach as:
“…recognizing that the absence of full scientific certainty shall not be used as a reason for postponing decisions where there is a risk of serious or irreversible harm.”
While Fisheries and Oceans Canada (DFO) has policies on the precautionary approach related to fisheries management, specific policies for applying the precautionary approach to the management of aquaculture have not been developed.
The objective of this document is to further explain how DFO applies the precautionary approach within its Framework for Aquaculture Risk Management (FARM).
The precautionary approach
The application of precaution, within science-based risk management is characterized by three principles:
- the need for a decision
- a risk of serious or irreversible harm
- a lack of full scientific certainty
DFO incorporates the precautionary approach when making decisions about fisheries by ensuring that potential risks to aquatic environments are managed to reduce the risk of harm to fish populations and habitat. We are more cautious in our management decisions when scientific information is uncertain, unreliable or incomplete.
We will apply the precautionary approach as part of the FARM management of aquaculture activities even when large-scale or permanent environmental impacts are not at stake.
Precautionary measures will be taken with an understanding of the potential risk, as assessed by experts, the extent of the effect of an activity on fish and fish habitat, and the scientific uncertainty associated with the assessment of these effects.
The greater the uncertainty, the less confidence there is that impacts and risk are estimated/predicted with accuracy and precision. Therefore, the management of these risks will, by necessity, require more risk averse measures and decisions.
Additionally, precautionary measures must be appropriately scaled to our understanding of where we are on the risk spectrum and the significance of uncertainty in potentially underestimating or overestimating the risk. That is, the lower the risk, regardless of the uncertainty, the extent of precautionary measures required will be reduced compared to if the risk is considered to be higher (Figure 1). The most effective precautionary measures should result in lowering the overall estimated risk to the target population or environment.
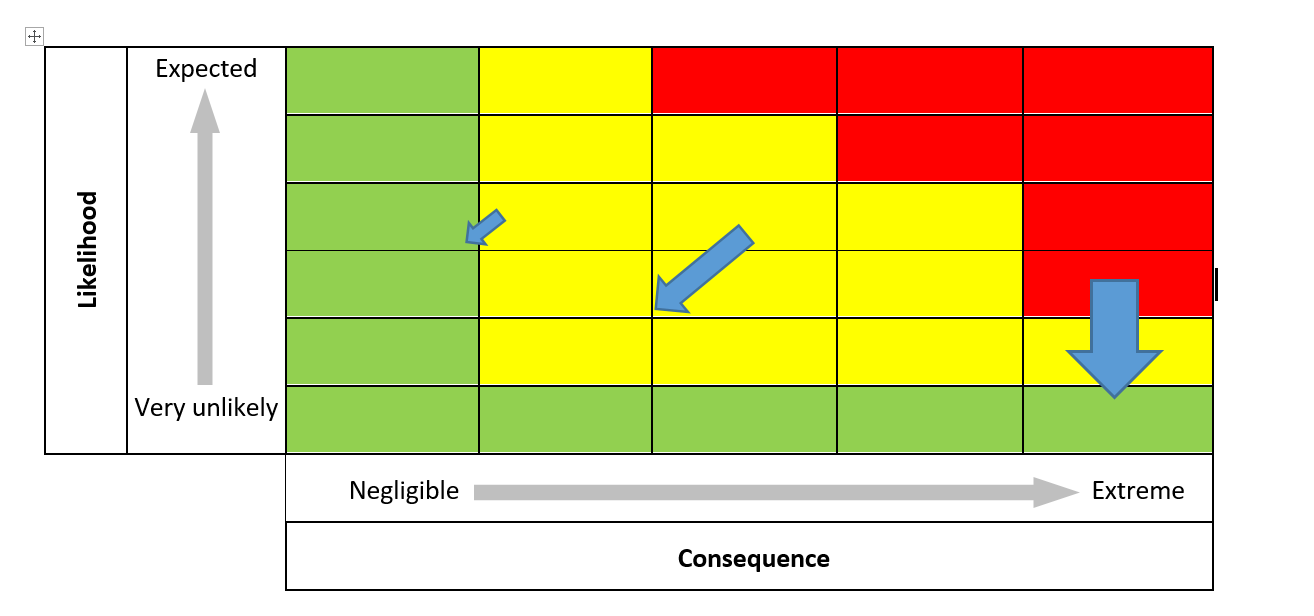
Long description
As the likelihood goes from very unlikely to expected, the consequence goes from negligible to extreme. The likelihood (y variable) increases over 6 rows. The consequence (x variable) increases over 5 columns. The first row and first column are colored green. The top 1 row in column 3, top 2 rows in column 4, and top 4 rows in column 5 are colored red. A small blue arrow points from column 2 row 3 (from the top) to column 1 row 3 (going from the yellow area to the green). A longer arrow goes from column 3 row 3 (from the top) to column 3 row 4 (from the top) staying in the yellow area. A wider arrow goes from column 5 row 4 (from the top) to column 5 row 6 (from the red area to the green).
An appropriate selection of precautionary measures will consider:
- the types and sources of uncertainties
- the predicted impacts.
If errors and uncertainties are thought to increase the risk then precautionary measures may be employed, however if they are considered to decrease the risk, then further measures are not required.
If the overall uncertainty is high, and the target population or environment has specific protection objectives or measures in place, precautionary measures that address specific elements may also be appropriate, particularly if they are expected to increase the confidence in the risk estimation (Figure 2).
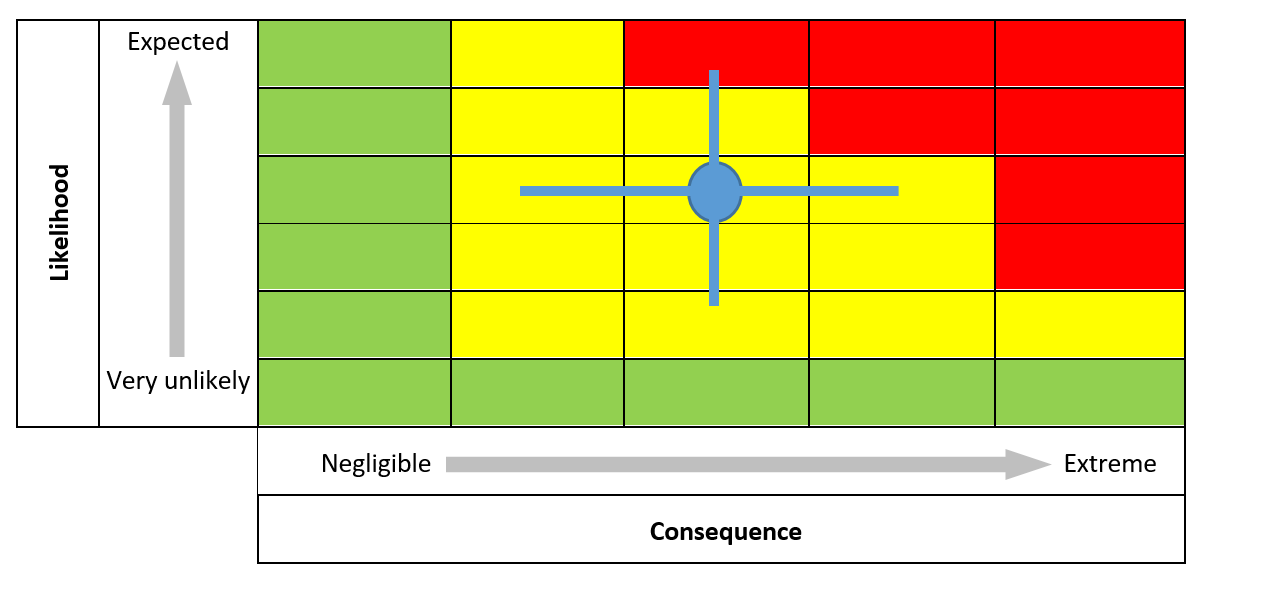
Long description
Scale of uncertainty associated with risk estimation prior to precautionary measures.
As the likelihood goes from very unlikely to expected, the consequence goes from negligible to extreme. The likelihood (y variable) increases over 6 rows. The consequence (x variable) increases over 5 columns. The first row and first column are colored green. The top 1 row in column 3, top 2 rows in column 4, and top 4 rows in column 5 are colored red. The rest are colored yellow. Row 3 (from the top) column 3 contains a blue circle with crosshairs spreading into the 2 rows above, 2 rows below, column 2 and column 4.
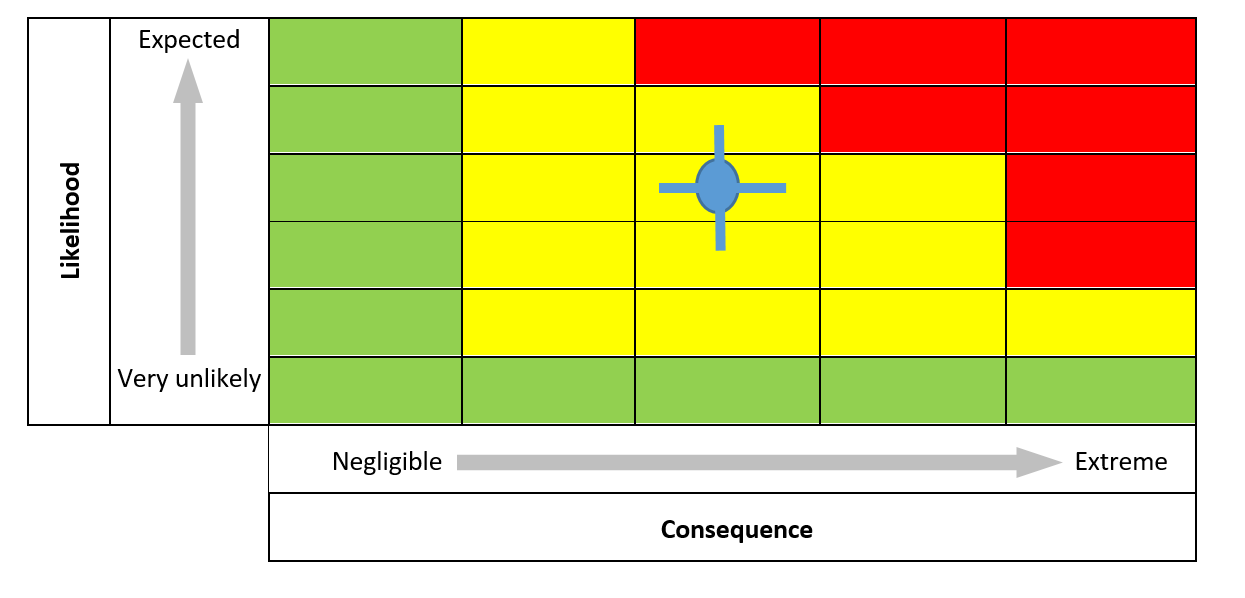
Long description
Scale of uncertainty associated with risk estimation following the application of precautionary measures
As the likelihood goes from very unlikely to expected, the consequence goes from negligible to extreme. The likelihood (y variable) increases over 6 rows. The consequence (x variable) increases over 5 columns. The first row and first column are colored green. The top 1 row in column 3, top 2 rows in column 4, and top 4 rows in column 5 are colored red. The rest are colored yellow. Row 3 (from the top) column 3 contains a blue circle with crosshairs going into the row above and below it.
Consideration will be given to existing or proposed precautionary measures for other purposes that mitigate the need for further measures (e.g. if fisheries management has incorporated measures that are expected to result in a change in the status of a conservation unit, stock or populations, especially if there is a demonstrated trend in the stock status towards the healthy zone).
The application of the precautionary approach is guided by peer-reviewed scientific advice and other knowledge available, and can consider values and priorities.
Related information
- A Fishery Decision-Making Framework Incorporating the Precautionary Approach
- A Framework for the Application of Precaution in Science-Based Decision Making about Risk
- Date modified: