
Socio-Economic Impact of Aquaculture in Canada
2013 Edition
Table of contents
1. Overview
This study provides estimates of the economic impact of aquaculture in Canada, with a focus on impacts at the community or regional level in some of the major producing areas. It relies on data for 2010. It is an up-date of a report produced in 2009, based on 2007 data.
Commercial aquaculture in Canada traces its history to the 1950s, with trout farming in Ontario, British Columbia and Québec, and oyster culture in New Brunswick, British Columbia and Prince Edward Island. The industry took off with the successful development of salmon farming. The first attempts to culture salmon commercially in Canada began in the early 1970s in British Columbia, with development work in the mid-1970s in New Brunswick and Nova Scotia. A mussel industry emerged on the east coast during the 1970s, expanded rapidly in Prince Edward Island during the 1990s, and today is the nation’s leading shellfish species by weight and value.
Today, aquaculture takes place in all ten provinces and the Yukon territory. Production of Atlantic salmon, Chinook Salmon, Trout, Arctic char, Blue Mussel, Oyster and Clam are well established. Several other species including halibut, sturgeon, tilapia, sablefish and scallop are at various stages of development.
2. Aquaculture production
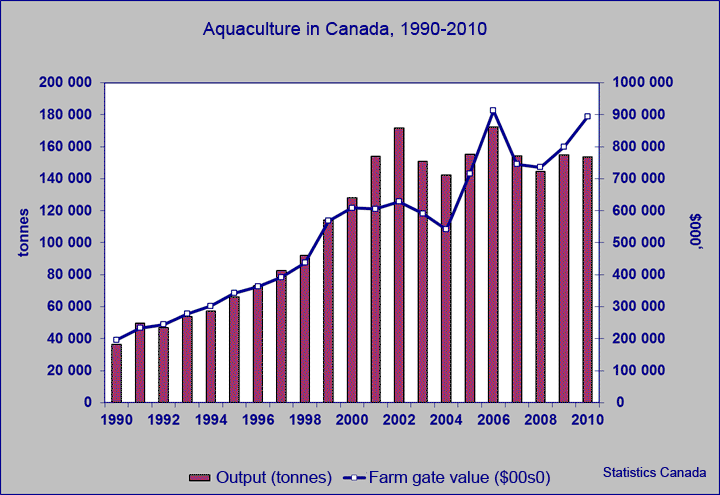
Aquaculture production in Canada increased more than four-fold between 1990 and 2002 with the rapid expansion in leases and area in production. Output (in round weight equivalent tonnes) increased from 40,000 to 170,000 t, while farm gate value increased from $195 to just over $600 million (Figure 1). A decline in output and value in the early 2000s was followed by a strong recovery by 2006, as tonnage and prices increased sharply. Price weakness and a cut in production on the east coast due to changes in bay area management systems caused revenues to decline by 2008. Overall output (finfish and shellfish) stabilized at about 155,000 t, while value increased to about $900 million, due mainly to sharply increased salmon prices as output in Chile dropped.
Figure 1
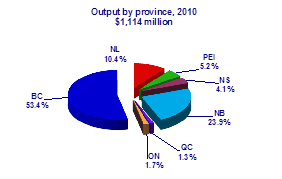
The quantity and value of national output is divided about equally between the Pacific and Atlantic coasts, though British Columbia leads all other provinces, typically accounting for about 50-60% of total production value vs. 20-25% for New Brunswick. Figure 2 provides a breakdown of output value by province, while Figure 3 gives a breakdown of quantity produced (tonnes) by species. Salmon is the leading species at 68.5% of total tonnage.
Figure 2
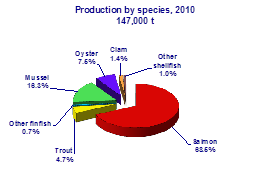
Figure 3
The value of output produced by the Canadian aquaculture industry in 2010 is estimated at $1.1 billion (Table 1), slightly above the 2007 value of $1.0 billion. This is the aggregate value of final products sold into the wholesale market by Canada’s aquaculture companies. Final product value is built up mainly from farm gate value, but also includes value added gained through basic processing (e.g., dressing in the case of salmon or trout, and washing and grading in the case of mussels and oysters). Many finfish producers are fully integrated, conducting both grow-out and processing activities. Many shellfish growers process their own output and also process on behalf of other growers.
| Province | Farm-gate value(1) |
Processing value-added (2) |
Final product value (3) |
Total value | |||
|---|---|---|---|---|---|---|---|
| Finfish | Shellfish | Finfish | Shellfish | Finfish | Shellfish | ||
| British Columbia | 511,500 | 22,300 | 41 080 | 19 030 | 552 580 | 41 330 | 593 910 |
| Ontario | 17,100 | - | 2 300 | - | 19 400 | - | 19 400 |
| Quebec | 8,579 | 829 | 4 046 | 545 | 12 625 | 1 374 | 14 000 |
| New Brunswick | 162,700 | 2,038 | 98 145 | 3 462 | 260 845 | 5 500 | 266 345 |
| Nova Scotia | 32,932 | 8,100 | 1 448 | 3 260 | 34 380 | 11 360 | 45 740 |
| Prince Edward Island | - | 30,254 | - | 27 592 | - | 57 846 | 57 846 |
| New foundland and Labrador | 81,270 | 2,953 | 29 031 | 3 056 | 110 301 | 6 009 | 116 310 |
| Total | 814,081 | 66,474 | 176 050 | 56 945 | 990 131 | 123 419 | 1 113 551 |
Source: Statistics Canada, Cat. No. 23-222-X;
British Columbia Ministry of Environment, Aquaculture Industry Overview, 2010;
New Brunswick Department of Agriculture, "Aquaculture 2010"
Nova Scotia Department of Fisheries and Aquaculture, Aquaculture Statistics, 2010
Prince Edward Island Department of Fisheries and Aquaculture, Fishery Statistics, 2010;
Newfoundland and Labrador "Seafood Industry Year in Review", 2010
Notes:
1. Where farm-gate values are not reported (e.g., NL for all products and NB for oysters), estimates are based on industry
average farm-gate prices applied to reported output.
2. Processing value added is the difference between farm-gate and final product value.
3. Final product value is as reported in Statistics Canada, Cat. No. 23-222-X, with adjustments where needed (shellfish generally) to reflect market prices.
3. Approach to measuring economic impact
Economic impact is measured using three key indicators: GDP, employment and labour income. Impacts are measured at three levels of activity: direct, indirect and induced, where direct captures the impact of the aquaculture industry itself (hatcheries, grow-out operations and processing); indirect captures impacts in the industries supplying goods and service to aquaculture (feed, equipment, advice), and induced captures the impacts arising from spending of income earned by those employed in direct and indirect activities (see Appendix 1 for details).
Economic impact arises as industry expenditures work their way through the economy. An aquaculture company’s spending on inputs becomes the revenue of many another companies, which they in turn they spend on inputs for the goods and services they produce, and so on. Gross value of output, then, is the cumulative sum of these sales and purchases of intermediate and final goods and services. These transactions occur in the province where aquaculture takes place, and also spill over to other provinces where supply and service industries may be located. The gross value of output generated by aquaculture in Canada in 2010 was $2.7 billion (Table A-1).
Data on trade flows illustrate how important aquaculture in one province is to that province and to all other provinces in Canada. Reading the data in Table 2 horizontally gives the value of goods and services exported by each province to support the aquaculture industries in other provinces (e.g., the value of NL exports to NS is $2.1 million). Reading vertically gives the value of goods and services imported from other provinces to support the aquaculture industry in a province (e.g., the value of NL imports from Ontario is $10.9 million).
Though most of the activity triggered by aquaculture occurs in the province of production, supply and service industries in each province benefit at least in a minor way from aquaculture activity in every other province. The spillover effect is felt most strongly in Québec and Ontario, which do not have large aquaculture industries, but benefit greatly from the multiplier effects of supplying goods and services to other provinces (indicated by the relatively high intra-provincial trade value of $80.9 million in Québec and $117.0 million in Ontario).
| Imports (1) ↓ | Newfoundland and Labrador |
Prince Edward Island | Nova Scotia | New Brunswick | Quebec (3) | Ontario (3) | British Columbia | Other provinces | Canada |
|---|---|---|---|---|---|---|---|---|---|
| Exports (2) → | |||||||||
| Newfoundland and Labrador | 79,586 | 469 | 2,119 | 8,332 | 521 | 379 | 364 | 55 | 91,826 |
| Prince Edward Island | 524 | 31,647 | 1,739 | 6,006 | 70 | 106 | 44 | 31 | 40,167 |
| Nova Scotia | 9,934 | 2,744 | 55,923 | 35,567 | 434 | 617 | 1,267 | 305 | 106,790 |
| New Brunswick | 5,996 | 7,111 | 3,980 | 206,462 | 1,157 | 400 | 723 | 311 | 226,139 |
| Québec | 3,881 | 2,170 | 3,910 | 29,122 | 80,939 | 8,186 | 27,715 | 2,659 | 158,582 |
| Ontario | 10,857 | 6,198 | 11,419 | 39,260 | 12,974 | 116,993 | 46,961 | 9,246 | 253,908 |
| British Columbia | 7,046 | 247 | 636 | 2,484 | 1,472 | 1,663 | 597,840 | 5,376 | 616,765 |
| Other provinces | 11,797 | 1,446 | 3,748 | 10,757 | 5,757 | 9,970 | 74,298 | 117,112 | 234,886 |
| International imports | 12,094 | 5,467 | 16,569 | 74,412 | 24,921 | 31,783 | 142,284 | 16,816 | 324,346 |
| Total impact | 141,715 | 57,499 | 100,044 | 412,401 | 128,244 | 170,098 | 891,495 | 151,911 | 2,053,407 |
Notes:
1. Columns set out the total value of goods and services imported from each province to produce the aquaculture output in the province indicated.
2. Rows set out the total value of goods and services shipped from the province indicated to each province and used as inputs for aquaculture production.
3. Though Québec and Ontario have relatively small aqauculture industries, the trade flows reflect the strong supply capacity for the rest of Canada.
Source: Statistics Canada, Interprovincial Input-Output Model, 2008 version
4. Economic impact results
2010 impacts
In total, the aquaculture industry generated just over $1.0 billion in GDP in Canada in 2010, with just over $355 million in direct GDP and about $710 million in spin-off impact (Table 3). The industry created just over 5,800 direct full-time equivalent jobs, with an overall employment impact of just over 14,000 FTEs. It generated direct labour income of about $193 million, with an overall income impact of almost $618 million.
| Newfoundland and Labrador | Prince Edward Island | Nova Scotia | New Brunswick | Québec | Ontario | British Columbia | Other provinces | Canada | |
|---|---|---|---|---|---|---|---|---|---|
| Value of output (in $000s) |
116,310 | 57,846 | 45,740 | 266,345 | 14,000 | 19,400 | 593,910 | 1,113,551 | |
| GDP (in $000s) | |||||||||
| Direct | 46,845 | 42,825 | 16,990 | 47,897 | 6,813 | 8,259 | 184,764 | 354,392 | |
| Indirect | 33,047 | 11,911 | 24,117 | 47,760 | 43,669 | 64,997 | 172,709 | 65,519 | 463,728 |
| Induced | 12,038 | 11,181 | 10,404 | 26,977 | 24,525 | 45,423 | 94,574 | 20,767 | 245,890 |
| Total | 91,930 | 65,917 | 51,511 | 122,633 | 75,007 | 118,679 | 452,047 | 86,286 | 1,064,010 |
| Jobs (FTE) | |||||||||
| Direct | 619 | 867 | 199 | 1,454 | 109 | 103 | 2,477 | 5,828 | |
| Indirect | 345 | 188 | 385 | 718 | 526 | 722 | 2,283 | 470 | 5,638 |
| Induced | 131 | 138 | 129 | 326 | 295 | 474 | 947 | 173 | 2,614 |
| Total | 1,096 | 1,193 | 713 | 2,498 | 930 | 1,299 | 5,707 | 643 | 14,079 |
| Labour income (in $000s) | |||||||||
| Direct | 18,355 | 24,830 | 6,417 | 44,756 | 2,959 | 3,553 | 91,923 | 192,794 | |
| Indirect | 21,703 | 7,643 | 16,761 | 31,418 | 25,244 | 40,360 | 115,394 | 27,140 | 285,661 |
| Induced | 6,211 | 6,247 | 5,867 | 15,208 | 14,176 | 27,037 | 53,990 | 10,723 | 139,458 |
| Total | 46,268 | 38,720 | 29,045 | 91,382 | 42,379 | 70,949 | 261,306 | 37,863 | 617,912 |
Source: Statistics Canada Interprovincial Input-Output Model, 2008 version.
Note: Figures may not sum to totals due to rounding.
Concerning the interpretation of I-O model results, two points of caution are warranted:
- I-O models are built with fixed coefficients that capture the industrial structure of the economy in a particular year. As long as the model is updated regularly and frequently, the model would measure accurately the impacts of current changes in economic activity. The impacts presented in this report are for the 2010 production year, though they are based on the 2008 version of the Statistics Canada Inter-provincial Input-Output Model. This is the most up to date version of the model, reflecting the structure and operating conditions in the industry in 2008. These conditions are ordinarily fairly stable from year to year, but can sometimes vary, implying that caution should be exercised in interpreting results (see footnote 1).
- Results should be seen as broadly indicative of the magnitude of impacts, rather than definitive in the sense that they convey a high level of precision. I-O models are built up from survey results covering many industries, and while considerable effort is made by Statistics Canada to ensure the accuracy of the information, results should be understood to contain a margin of error (unspecified). One of the implications of this margin of error is that caution should be used in comparing results for different years. Small differences in impact could fall within the margin of error, rather than be attributable to changes in the real economy.
2010 vs. 2007 impacts
National
At the national level, the direct GDP impact is up by 10%, rising from $321.5 million in 2007 to $354.4 million in 2010 (Table 4). This follows the increase in the gross value of output, which rose from $1,026 to $1,113 million. Direct employment has increased, rising by about 20% from 4,895 FTEs in 2007 to 5,828 in 2010. Labour direct income increased in line with employment growth (about 20%), rising from $156.8 to $192.8 million.
While the change in direct impacts is what ordinarily would be expected given the change in gross output, the mix of changes at the indirect level are less easy to explain (see Table 3 above and Table S-3 in Appendix 2). Again, both GDP and income increase predictably, while indirect employment declines. It is the decline in indirect employment that is problematic. This small decline may not have been felt or observed as it was spread out across the country. We are uncertain of the exact cause, but it could be due to an increase in the import content of industry inputs (consistent with the strengthening of the Canadian dollar), or there may have been an increase in the integration of activities within the aquaculture industry (so, activities that were indirect in the past have become direct), or any changes could fall within the margin of error of the model.
| Value in $000s except Jobs (FTE) |
Newfoundland and Labrador |
Prince Edward Island |
Nova Scotia | New Brunswick | Québec | Ontario | British Columbia |
Canada |
|---|---|---|---|---|---|---|---|---|
| 2010 | ||||||||
| GDP | 46,845 | 42,825 | 16,990 | 47,897 | 6,813 | 8,259 | 184,764 | 354,392 |
| Jobs (FTE) | 619 | 867 | 199 | 1,454 | 109 | 103 | 2,477 | 5,828 |
| Labour income | 18,355 | 24,830 | 6,417 | 44,756 | 2,959 | 3,553 | 91,923 | 192,794 |
| 2007 | ||||||||
| GDP | 20,000 | 42,800 | 22,800 | 69,100 | 8,200 | 7,480 | 151,100 | 321,480 |
| Jobs (FTE) | 215 | 790 | 380 | 1,100 | 80 | 110 | 2,220 | 4,895 |
| Labour income | 6,200 | 22,000 | 12,200 | 32,700 | 2,600 | 2,720 | 78,400 | 156,820 |
Source: Table 3 and Appendix 2, Table S-3.
Provincial
A comparison of 2010 and 2007 provincial impacts is possible at the direct level only, because of the difference in the way the I-O Model was run in the two years. For 2007, impacts were estimated by running the model separately for each province. The results reported the direct, indirect and induced impacts in that province only. The impacts exclude the spillover effects arising from the supply of goods and service created by the demands of aquaculture activity in other provinces. These spillover impacts tend to be relatively low for all provinces except Québec and Ontario. For 2010, the impacts were estimated by running the model simultaneously for all provinces, resulting in indirect and induced impacts that include spillover effects from activity in other provinces (though these effects are small for all provinces but Québec and Ontario).
- British Columbia: GDP impact increased by about 20% between 2007 and 2010. Employment and labour income impacts increased by about 10%. The strong GDP growth is attributable to higher salmon prices, with stable output and operating costs.
- Newfoundland and Labrador: GDP impact more than doubled, while the employment and income impacts tripled between 2010 and 2007. This was due mainly to a substantial increase in salmon production as the industry continues to expand.
- Nova Scotia: direct impacts declined as output fell, attributable mainly to a drop in the value of finfish production.
- New Brunswick: with just a slight drop in output value, the direct GDP impact has declined sharply from that shown for 2007, while employment and labour income impacts have increased. The GDP drop would appear to be attributable to the challenges industry faced in adapting to changes in the bay management system.Footnote 1
- Prince Edward Island: With only a modest increase in the value of output, direct GDP and labour income impacts remained fairly stable. The employment impact shows an increase of about 10%.
- Québec and Ontario: that these provinces have relatively small aquaculture industries is evident from Table 3, showing output and direct impacts well below those of other provinces. Indirect and induced impacts, on the other hand, are relatively high. This reflects the strength of these economies in supplying goods and services to industry and individuals in other provinces. For the reasons given above, this strength shows up in the 2010 impact results, but not in 2007, because of the difference in approach taken to running the I-O model.
5. Regional impacts
Campbell River and Comox (Comox-Strathcona Region), British Columbia
Though in the range of 70% of salmon production occurs outside the waters of the Comox-Strathcona Region, most of the spending that drives economic impact occurs within the Region. This includes the major salmon companies that are headquartered in Campbell River, as well as many of the companies supplying goods and services including fish processing, nets and maintenance, transportation, packaging, containers, diving services, and machinery and equipment. As well, most of the employees working the salmon sites are based within the Region. Since only a relatively small percentage of production occurs outside the area on the west coast of Vancouver Island, we credit the Comox-Strathcona area with 95% of the direct impact.
Much of the indirect activity also occurs in the impact area, though exactly what proportion is not known. Data provided by the aquaculture industry suggests it is likely to be in the 50-70% range (for example, about 40% of operating expenditures is made on feed for salmon, which is imported to the area from Vancouver); so to be conservative, we use the lower bound for estimating regional indirect employment and income impacts. The same assumption is used to derive induced impacts.
Table 5, setting out the resulting impacts, shows that aquaculture generated the equivalent of just under 3,970 full-time jobs in the Comox-Strathcona area and $172 million in labour income. With the decline in forestry and the commercial fisheries, salmon and shellfish aquaculture occupy an increasingly important place in the economy of northern Vancouver Island.
| British Columbia | Comox-Strathcona | |||
|---|---|---|---|---|
| Jobs (FTE) | Income ($000s) | Jobs (FTE) | Income ($000s) | |
| Direct | 2,477 | 91,923 | 2,353 | 87,327 |
| indirect | 2,283 | 115,394 | 1,142 | 57,697 |
| Induced | 947 | 53,990 | 474 | 26,995 |
| Total | 5,707 | 261,307 | 3,968 | 172,019 |
Source: Statistics Canada, I-O Model 2008 version; Census of Canada, 2006.
An estimate of the relative importance of aquaculture in terms of the share of regional employment and income is set out in Table 6. It shows that aquaculture accounts for an estimated 8% of regional employment and income. The income impact rises to 12% when compared with earnings from employment only.
| Regional | Aquaculture | ||
|---|---|---|---|
| Comox-Strathcona | Regional impact | % of regional total | |
| Employment (FTE) | 47,880 | 3,968 | 8% |
| Income ($000s) | |||
| Total | 2,085,605 | 8% | |
| From employment | 1,436,982 | 172,019 | 12% |
Source: Statistics Canada, Census 2006 Community Profiles.
Note: the difference between total and employment income is accounted for mainly by investment income and transfer payments.
Charlotte County, New Brunswick
Aquaculture has transformed Charlotte County from a high unemployment-low income area to one of relative prosperity within the province. Though income and employment levels remain below provincial averages, the County has made substantial gains over the past 20 years from an economy characterized by seasonal employment and limited opportunity. Aquaculture and its supply and service industries offer year-round employment and good incomes in an export industry that has become the foundation of the local economy.
A key question concerning local impacts is how much of the total aquaculture activity and associated employment and income occurs in the area. Because all of the direct salmon activity occurs in Charlotte County, we credit it with 100% of the associated direct impacts arising from salmon, which in turn account for an estimated 98% of overall aquaculture impacts. Shellfish aquaculture, focused mainly on oyster, occurs along the eastern coast of New Brunswick in the Gulf of St Lawrence and accounts for the balance.
Much of the indirect activity also occurs in the Charlotte County, though exactly what proportion is not known with certainty. Information provided by the aquaculture industry suggests it is likely to be in the 60-70% range (for example, about 40% of operating expenditures goes toward feed about half of which is imported to the area from Nova Scotia), so to be conservative, we use the lower bound for estimating local employment and income impacts. The same assumption is used to derive induced impacts.
Table 7, setting out the resulting impacts, shows that aquaculture generated the equivalent of 2,039 full-time jobs in Charlotte County and about $71 million in labour income. With the decline commercial fisheries, salmon aquaculture occupies an increasingly important place in the region.
| New Brunswick | Charlotte County | |||
|---|---|---|---|---|
| Jobs (FTE) | Income ($000s) | Jobs (FTE) | Income ($000s) | |
| Direct | 1,454 | 44,756 | 1,425 | 43,861 |
| indirect | 718 | 31,418 | 422 | 18,474 |
| Induced | 326 | 15,208 | 192 | 8,942 |
| Total | 2,498 | 91,382 | 2,039 | 71,277 |
Source: Statistics Canada, I-O Model 2008 version; Census of Canada, 2006.
An estimate of the relative importance of aquaculture in terms of the share of regional employment and income is set out in Table 8. It shows that aquaculture accounts for an estimated 16-18% of regional employment and income. The income impact rises to 23% when compared with earnings from employment only.
| Regional | Aquaculture | ||
|---|---|---|---|
| Charlotte County | Regional impact | % of regional total | |
| Employment (FTE) | 11,635 | 2,039 | 18% |
| Income ($000s) | |||
| Total | 456,411 | 71,277 | 16% |
| From employment | 304,882 | 71,277 | 23% |
Source: Statistics Canada, Census 2006 Community Profiles.
Note: the difference between total and employment income is accounted for mainly by investment income and transfer payments.
Northern / Eastern Prince Edward Island
The aquaculture impact area for Prince Edward Island (PEI) is derived from an aggregation of Census tract data capturing almost all of the aquaculture production and processing activity in the province. The impact area(s) is composed of several small, rural communities for which aquaculture provides one of the few sources of year-round employment and income. Data were collected at the census tract level allowing socio-economic indicators to be quantified, and these indicators were then aggregated to determine the industry’s significance at the sub-provincial level. The communities profiled include:
- Malpeque Bay
- New London Bay
- Murray River
- Tracadie Bay
- Boughton River
- Brudenell River
- Darnley Basin
- Rustico Bay
- St. Peter’s Bay
- Cardigan Bay
- St. Mary’s Bay
- Souris Bay
- Montague River
- Savage Harbour
- Hillsborough Bay
- Cascumpec Bay
Aquaculture makes three important contributions to the impact area economy: it provides a year-round source of income and employment in an area that has traditionally experienced few alternatives to seasonal fishing and agriculture; it is a widely-distributed activity (geographically) and accessible to those who prefer a rural lifestyle; and, it creates wealth in the sense that aquaculture relies almost exclusively on export markets for its revenues.
The impact area is credited with 100% of direct activity and impact. Much of the indirect activity occurs inside the impact area, though exactly what proportion is not known with certainty. Information provided by the industry suggests it is likely to be in the 60-70% range, including such inputs as seed for grow-out, transportation, and maintenance and repair. To be conservative, we use the lower bound for estimating local indirect employment and income impacts.Induced impacts are assumed to fall in the same range. Provincial and regional impacts are set out in Table 9.
| Prince Edward Island | Impact area | |||
|---|---|---|---|---|
| Jobs (FTE) | Income ($000s) | Jobs (FTE) | Income ($000s) | |
| Direct | 867 | 24,830 | 867 | 24,830 |
| indirect | 188 | 7,643 | 113 | 4,586 |
| Induced | 138 | 6,247 | 83 | 3,748 |
| Total | 1,193 | 38,720 | 1,062 | 33,164 |
Source: Statistics Canada, I-O Model 2008 version; Census of Canada, 2006.
An estimate of the relative importance of aquaculture in terms of the share of regional employment and income is set out in Table 10. It shows that aquaculture accounts for an estimated 9% of regional income and 12% of employment. The income impact rises to 12% when compared with earnings from employment only.
| Aquaculture impact in the PEI impact area, 2010 | |||
|---|---|---|---|
| Regional | Aquaculture | ||
| PEI impact area | Regional impact | % of regional total | |
| Employment (FTE) | 8,895 | 1,062 | 12% |
| Income ($000s) | |||
| Total | 388,373 | 33,164 | 9% |
| From employment | 280,172 | 33,164 | 12% |
Source: Statistics Canada, Census 2006 Community Profiles.
Note: the difference between total and employment income is accounted for mainly by investment income and transfer payments.
Coast of Bays, south coast of Newfoundland and Labrador
The Coast of Bays region is located about mid-way along the south coast of the province, just to the northwest of the Burin Peninsula. With some 1,365 km of coastline, and excellent biophysical conditions, its bays and inlets are home to most of the aquaculture activity in the province. Among the key areas are Bay d’Espoir, Hermitage Bay, Connaigre Bay and Fortune Bay North. The industry occupies an increasingly important component of the regional economy as the commercial fishery has declined and fish plants in Harbour Breton, Hermitage and Gaultois have closed.
The impact area is credited with 95% of the province’s direct aquaculture activity and impact (the balance occurs mainly on the northeast coast in Notre Dame Bay. With limited industrial infrastructure (including feed production), much of the indirect activity occurs outside the impact area, though exactly what proportion is not known with certainty. Information provided by the industry suggests it is likely to be in the 40-50% range. To be conservative, we use the lower bound for estimating local indirect employment and income impacts. Induced impacts are assumed to fall in the same range. Provincial and regional impacts are set out in Table 11.
| Newfoundland and Labrador | Coast of Bays | |||
|---|---|---|---|---|
| Jobs (FTE) | Income ($000s) | Jobs (FTE) | Income ($000s) | |
| Direct | 619 | 18,355 | 588 | 17,437 |
| indirect | 345 | 21,703 | 138 | 8,681 |
| Induced | 131 | 5,867 | 53 | 2,347 |
| Total | 1,096 | 45,925 | 779 | 28,465 |
Source: Statistics Canada, I-O Model 2008 version; Census of Canada, 2006.
An estimate of the relative importance of aquaculture in terms of the share of regional employment and income is set out in Table 12. It shows that aquaculture accounts for an estimated 22% of regional employment and 27% of income. The income impact rises to 42% when compared with earnings from employment only (reflecting the strong seasonality of employment in the region). Data limitations (consistency between the impact area boundary and that used in the Census) make it difficult to estimate total regional income against which the income impact is compared, so caution should be exercised in interpreting the result. The relative impact shown in Table 12 is likely on the high side.
| Aquaculture | |||
|---|---|---|---|
| Coast of Bays | Regional impact | % of regional total | |
| Employment (FTE) | 3,605 | 779 | 22% |
| Income ($000s) | |||
| Total | 106,987 | 28,465 | 27% |
| From employment | 67,402 | 28,465 | 42% |
Source: Statistics Canada, Census 2006 Community Profiles.
Note: the difference between total and employment income is accounted for mainly by investment income and transfer payments.
Appendix 1: Notes on impact assessment methodology
1. Key concepts
Reporting on the impact of an economic activity generally begins with a descriptive profile of the activity, setting out its nature and economic characteristics and providing an overview of its linkages with other sectors in the broader economy. Key factors affecting performance and trends are discussed and quantified using industry-specific indicators. Relevant factors include resource conditions, regulatory framework and markets, with performance measured using such indicators as the quantity and value of production, number of establishments, employment and exports.
In producing its output, an industry also triggers activity elsewhere in the economy. The sum of this activity, generally referred to as economic impact, is conventionally measured with three indicators:
- GDP: an industry’s contribution to Gross Domestic Product represents its broadest measure of economic impact. The domestic product of aquaculture captures the value it adds to purchased inputs (e.g., feed and utilities) through the application of labour and capital. GDP represents the sum of the value added by all firms in an industry, where value added is composed of the income earned – labour income, and returns to and of capital. Value added should not be confused with output value, since the latter would include the value of purchased inputs.
- Employment: industry employment is important because of the significance generally attached to jobs; from a purely economic impact perspective, the significance lies in the economic impact generated through the spending of employment income. The greater the employment and higher the average income, the more significant the industry in terms of its overall economic impact. Unless otherwise indicated, employment is measured in full-time equivalents (FTE).
- Labour income: this captures payments in the form of wages and salaries earned in an industry. Returns to labour in the form of wages, salaries and earnings form a key component of GDP. Industries paying relatively high average wages and salaries generate a correspondingly higher economic impact than industries paying lower average incomes.
Economic impacts are generated through direct, indirect and induced demand in the economy expressed in terms of industry and consumer purchases of goods and services.
- Direct impact: refers to impact arising from the expenditures made by firms in the subject industry (in this case aquaculture) on the goods and services needed to produce industry outputs. Direct activities include hatchery operations, grow-out, harvesting, processing and corporate administration.
- Indirect impact: refers to the impacts arising from purchased inputs triggered by the direct demand. For example, aquaculture companies buy feed, vessels and cages from manufacturers, and business services from biologists, technicians and divers. These companies in turn buy their inputs (e.g., fish meal and oil, steel and winches, plastics and netting, professional labour and equipment) from other companies, and so on. Taken together, the process of producing these goods and services creates profits, employment and income generating indirect impacts.
- Induced demand: refers to the demand created in the broader economy through consumer spending of incomes earned by those employed in direct and indirect activities. It may take a year or more for these rounds of consumer spending to work their way through an economy.
The sum of impacts flowing from each level of demand gives the overall economic impact of Canada’s aquaculture industry. Generally, the greater the domestic supply capability (multipliers) at each level, the greater will be the economic impact. Conversely, the higher the import content, the weaker the domestic industry response and the lower the impact. Output value and impacts by province for 2010, with relevant multipliers are set out in Table A-1 at the end of this Appendix.
Note that the multipliers are derived from production figures and include spillover effects from aquaculture activity in other provinces. For all provinces but Québec and Ontario, these spillover effects are relatively small. Accordingly, the multipliers provide a close approximation of industry impacts within each province. This is not the case for Québec and Ontario; the multipliers for these provinces benefit disproportionately from aquaculture activity in the rest of Canada.
2. Quantifying the impacts – the Input-Output Model
Economists rely on economic models to quantify impacts. Models provide a simplified view of the economy, expressing the myriad demand and supply transactions in the productive process as a set of coefficients or quantitative relationships. These coefficients, including the level of employment and income generated per dollar of expenditure, are based on empirical measurement of flows in the real economy with data compiled through industry surveys conducted annually by Statistics Canada.
This study uses the Statistics Canada Inter-provincial Input-Output Model (2008 version) to generate the economic impacts. The use of an input-output (I-O) model is considered most appropriate for this study because this type of model:
- produces direct, indirect and induced impact results – the direct, indirect and induced impacts, provided it has “open” and “closed” versions. Running the open version allows labour income to “leak” out of the economy, with impacts confined to indirect effects. Running the closed version forces labour income to flow through the economy, resulting in an aggregate measure of indirect and induced impacts. The difference between the two runs represents the measure of induced impact.
- produces results at a high level of resolution – the I-O model is a matrix capturing inter-industry flows of purchases and sales, thus allowing impacts to be measured and reported at the highest resolution. Other types of models (e.g., general equilibrium and economic base) are structured at an aggregate economic level, lacking the sensitivity to accept industry-specific “shocks” and unable to produce industry-specific results.
Two disadvantages of using an I-O model are commonly cited: linearity of results and fixed inter-industry coefficients.
- linearity of results implies that the economy does not encounter production constraints since the model will produce constant results according to the fixed coefficients embedded in it. This is a valid concern, though not one that affects this study given its scope and objectives (the study is not trying to measure the impact of a major change in expenditures that would be inconsistent with inter-industry relationships embodied in the I-O model).
- fixed coefficients imply lack of technological innovation and no shifts in the mix of spending on inputs. This is a valid concern if the model is not up-dated regularly. But given how slowly structural change occurs in an economy, as long as the model relies on industry data no more than 3-4 years old, such dynamic effects would be reflected in the coefficients. The Statistics Canada Inter-provincial Input-Output Model meets this test since the model is updated each year and is generally only 2-3 years behind the data.
3. Data requirement, sources and limitations
The study requires data for two main reasons: to drive the I-O Model to generate economic impact estimates; and, to describe the aquaculture industry in sufficient detail to allow the reader to develop a clear understanding of the nature of the activity and the extent of its economic significance.
Quantifying economic impacts begins with data on the gross value of output for the aquaculture industry in each province. Gross value of output means revenues generated through sales of final product. Final product value is used rather than farm gate because it accurately captures the integrated structure of the industry and provides a complete indicator of overall activity. Using the aquaculture industry coefficients, the I-O Model breaks down the revenues to specific expenditure categories including purchased inputs, wages and salaries and profit. As these expenditures work their way through the economy (as captured by the I-O Model), they generate the GDP, employment and labour income impacts the study aims to quantify.
The data used in this study to drive the I-O Model and produce impact estimates are obtained from Statistics Canada sources, with corroboration (where possible) by the consultants of output values and input costs from industry sources and provincial government sources. Notwithstanding the general reliability of the data, some points of clarification may be useful in understanding what the numbers mean and how they are applied in the analysis. This may also serve as a guide for future analyses of this kind.
- Industry structure: Aquaculture falls under NAICS #1125 – “establishments engaged in farm raising and production of aquatic animals in controlled environments and using various forms of intervention (e.g., net pens, cages, various suspension systems) to enhance production including stocking, feeding and protecting from predators and disease.” Under this definition, the industry includes both hatcheries and grow-out facilities.
Many growers also process their output. This is generally the case with finfish; by contrast, a high proportion of shellfish producers grow only, selling their output to processors (most often growers themselves) for final production and marketing. Whether Statistics Canada classifies an enterprise as an aquaculture company or a processing company (NAICS #3117) depends on how the enterprise is structured and where most of the value is created. In an integrated company, if more than 50% of the final product value is created in grow-out, then it is classified under NAICS #1125 (aquaculture); if more than 50% of the value is created in processing, then it is classified under NAICS #1137 (processing). The trouble is that it is not obvious from the data how the companies classify themselves.
To add to the confusion, the companies themselves do not necessarily conform to the Statistics Canada classification approach. In discussions with west coast salmon farming companies, it emerged that all classified themselves under NAICS #1125, regardless of corporate structure (i.e., even where processing assets may have been held in a different company or where processing is contracted out to a separate company on a fee for service basis).Footnote 2 By contrast, at least one salmon company on the east coast divides its reporting between NAICS #1125 and #3117, so the farm-gate value of output is reported under Aquaculture and the final product value is reported under Fish Processing. This has created a discontinuity in the annual value added account data set, making it appear that aquaculture production declined sharply in 2007.
- Aquaculture statistics: Statistics Canada publishes annual production (tonnes and value at the farm gate), and value added data by province (Cat. No. 23-222-X). Production data are given by species; the value added account gives revenue data by species group, but aggregates input expenditures at the industry level. Data confidentiality is not an issue at the national level, though can be for some species in some years at the provincial level.
Statistics Canada does not collect farm gate data directly from the companies, but obtains them from the provinces. The provinces use a uniform approach to compiling data, with production figures obtained directly from the companies as part of routine annual reporting.
The way aquaculture data are collected and reported presents some challenges for estimating impacts. This is because the data as reported do not necessarily capture all the aquaculture activity (hatchery, grow-out and processing) defining the industry. As noted above, depending on how companies are structured and report their results, some of the aquaculture value may found in fish processing.
- Running the I-O Model: running the Model would be a straightforward matter if the aquaculture industry were represented under a single NAICS classification, with production and financial data capturing hatchery, grow-out and processing activities. The analyst would then be confident that the model coefficients represent all direct activity and the corresponding multipliers would produce reliable impact estimates for all aspects of industry activity. In these circumstances, final product value (rather than farm-gate value) would be used to run the Model, targeting NAICS 1125. Based on discussions with Statistics Canada and aquaculture companies on the east and west coasts, this would appear to be the appropriate approach in all provinces except New Brunswick and Newfoundland and Labrador.
These provinces are exceptions because the dominant producer reports farm-gate value under NAICS 1125 and its final output value under fish processing, NAICS 3117. If the version of the Model used in the analysis reflects this reporting approach, then it would have to be run for both Aquaculture (using farm-gate value) and Fish Processing (using final product value), with adjustments at the indirect level to eliminate double counting.Footnote 3
| Aquaculture NAICS 1125 (2) | Fish Processing 3117 (3) | Total | |||||||||||
|---|---|---|---|---|---|---|---|---|---|---|---|---|---|
| Indicator | Newfoundland and Labrador | Prince Edward Island | Nova Scotia | New Brunswick | Quebec | Ontario | British Columbia | Other provinces | Total | Newfoundland and Labrador | New Brunswick | Total | Aquaculture industry |
| Gross output | |||||||||||||
| Direct impact (output value) | 84,223 | 57,846 | 45,740 | 164,738 | 14,000 | 19,400 | 593,910 | 0 | 979,857 | 32,087 | 101,607 | 133,694 | 1,113,551 |
| Direct + indirect impact | 137,119 | 82,192 | 118,581 | 273,560 | 133,280 | 169,168 | 1,058,720 | 150,109 | 2,122,730 | 64,381 | 142,098 | 206,479 | 2,329,209 |
| Direct + indirect + induced impact | 149,523 | 99,657 | 136,858 | 305,347 | 180,600 | 252,782 | 1,204,082 | 189,461 | 2,518,309 | 71,276 | 158,375 | 229,651 | 2,747,960 |
| Indirect impact multiplier | 1.63 | 1.42 | 2.59 | 1.66 | 9.52 | 8.72 | 1.78 | 2.01 | 1.40 | ||||
| Indirect + induced impact multiplier | 1.78 | 1.72 | 2.99 | 1.85 | 12.90 | 13.03 | 2.03 | 2.22 | 1.56 | ||||
| GDP at basic prices | |||||||||||||
| Direct impact | 37,340 | 42,825 | 16,990 | 28,679 | 0 | 0 | 184,764 | 0 | 310,598 | 9,505 | 19,218 | 28,723 | 339,321 |
| Direct + indirect impact | 57,418 | 54,737 | 41,107 | 64,149 | 0 | 0 | 357,473 | 65,519 | 640,403 | 22,474 | 31,507 | 53,981 | 694,384 |
| Direct + indirect + induced impact | 65,170 | 65,917 | 51,511 | 82,054 | 0 | 0 | 452,047 | 86,286 | 802,985 | 26,760 | 40,579 | 67,340 | 870,325 |
| Indirect impact multiplier | 1.54 | 1.28 | 2.42 | 2.24 | 7.41 | 8.87 | 1.93 | 2.36 | 1.64 | ||||
| Indirect + induced impact multiplier | 1.75 | 1.54 | 3.03 | 2.86 | 11.01 | 14.37 | 2.45 | 2.82 | 2.11 | ||||
| Labour income | |||||||||||||
| Direct impact | 11,004 | 24,830 | 6,417 | 28,449 | 0 | 0 | 91,923 | 0 | 162,623 | 7,351 | 16,307 | 23,658 | 186,282 |
| Direct + indirect impact | 23,554 | 32,473 | 23,177 | 51,369 | 0 | 0 | 207,317 | 27,140 | 365,030 | 16,504 | 24,805 | 41,309 | 406,339 |
| Direct + indirect + induced impact | 27,512 | 38,720 | 29,045 | 61,457 | 0 | 0 | 261,306 | 37,863 | 455,903 | 18,756 | 29,925 | 48,681 | 504,584 |
| Indirect impact multiplier | 2.14 | 1.31 | 3.61 | 1.81 | 9.53 | 12.36 | 2.26 | 2.25 | 1.52 | ||||
| Indirect + induced impact multiplier | 2.50 | 1.56 | 4.53 | 2.16 | 14.32 | 19.97 | 2.84 | 2.55 | 1.84 | ||||
| Jobs - full-time equivalent (FTE) | |||||||||||||
| Direct impact | 0 | 0 | 0 | 0 | 0 | 0 | 0 | 0 | 0 | 0 | 0 | 0 | 0 |
| Direct + indirect impact | 590 | 1,055 | 584 | 1,436 | 635 | 825 | 4,760 | 470 | 10,356 | 374 | 736 | 1,110 | 11,466 |
| Direct + indirect + induced impact | 674 | 1,193 | 713 | 1,652 | 930 | 1,299 | 5,707 | 643 | 12,811 | 422 | 846 | 1,268 | 14,079 |
| Indirect impact multiplier | 1.58 | 1.22 | 2.93 | 1.58 | (4) | (4) | 1.92 | 1.53 | 1.35 | ||||
| Indirect + induced impact multiplier | 1.80 | 1.38 | 3.58 | 1.82 | (4) | (4) | 2.30 | 1.72 | 1.56 | ||||
1. Indirect and induced impacts in each province include spillover effects from exports of goods and services to other provinces. These spillover impacts are relativey small for all provinces except Québec and Ontario.
2. Impact results for Aquaculture (NAICS 1125) based on output value according to industry classification of enterprises (integrated operations except for NL and NB).
3. Impact results for Fish Processing (NAICS 3117) based on value added of aquaculture output where industry separates grow-out and processing enterprises for reporting purposes.
4. Direct and indirect impacts are due mainly to spillover demand from other provinces, not to the industries in Québec and Ontario; hence, industry-specific multipliers are not available.
5. Figures may not sum to totals due to rounding.
Source: Statistics Canada Interprovincial Input-Output Model, 2008 version
Appendix 2: 2009 impact tables
| Finfish | Shellfish | Total | |
|---|---|---|---|
| British Columbia | 522,600 | 37,100 | 559,700 |
| Ontario | 17,000 | - | 17,000 |
| Québec | 12,700 | 1,000 | 13,700 |
| New Brunswick | 272,900 | 7,000 | 279,900 |
| Nova Scotia | 43,000 | 10,000 | 53,000 |
| Prince Edward Island | 1,900 | 56,000 | 57,900 |
| Newfoundland and Labrador | 38,800 | 5,600 | 44,400 |
| Total | 908,900 | 116,700 | 1,025,600 |
Source: Statistics Canada, Cat. No. 23-222-X; .
British Columbia Ministry of Environment, British Columbia Seafood Industry Year in Review, 2007;
New Brunswick Department of Agriculture, Fisheries and Aquaculture, special tabulation;
Nova Scotia Department of Fisheries and Aquaculture; Aquaculture Statistics, 2007;
Prince Edward Island Department of Fisheries and Aquaculture, Fishery Statistics, 2007;
Newfoundland and Labrador Department of Fisheries and Aquaculture, Aquaculture Highlights, 2007.
| Value of output $1,025.6 million | Newfoundland and Labrador |
Nova Scotia | Prince Edward Island |
New Brunswick | Québec | Ontario | British Columbia |
Canada |
|---|---|---|---|---|---|---|---|---|
| GDP ($000s) | ||||||||
| Direct | 20,000 | 22,800 | 42,800 | 69,100 | 8,200 | 7,480 | 151,100 | 321,480 |
| Indirect | 8,400 | 10,600 | 6,400 | 47,200 | 2,500 | 4,080 | 167,900 | 450,400 |
| Induced | 6,200 | 8,500 | 10,400 | 30,800 | 3,700 | 4,250 | 106,300 | 233,300 |
| Total | 34,600 | 41,900 | 59,600 | 147,100 | 14,400 | 15,810 | 425,300 | 1,005,180 |
| Jobs (FTE) | ||||||||
| Direct | 215 | 380 | 790 | 1,100 | 80 | 110 | 2,220 | 4,895 |
| Indirect | 120 | 170 | 125 | 790 | 35 | 55 | 2,330 | 6,400 |
| Induced | 70 | 120 | 250 | 530 | 45 | 51 | 1,410 | 3,200 |
| Total | 405 | 670 | 1,165 | 2,420 | 160 | 216 | 5,960 | 14,495 |
| Income ($000s) | ||||||||
| Direct | 6,200 | 12,200 | 22,000 | 32,700 | 2,600 | 2,720 | 78,400 | 156,820 |
| Indirect | 4,900 | 6,400 | 2,900 | 28,300 | 1,200 | 2,040 | 95,100 | 241,200 |
| Induced | 2,200 | 4,800 | 6,400 | 16,800 | 1,230 | 1,530 | 50,400 | 107,900 |
| Total | 13,300 | 23,400 | 31,300 | 77,800 | 5,030 | 6,290 | 223,900 | 505,920 |
Note: Provincial direct impacts capture only impacts of activities occurring within the boundaries of the province. The national indirect and induced impacts include impacts spilling over to other provinces.
- Date modified: