
Discovery Islands
2011-2019/2020 compliance and performance, marine finfish
On this page
- Introduction
- Production
- Fish health - mortality
- Mortality events
- Fish health events
- Fish health audits
- Sea lice
- Sea lice audits
- Fish health and sea lice treatments
- Benthic performance
- Incidental catch and wild mortalities
- Marine mammals
- Escapes
- Health Management Plan (HMP) compliance
- Conclusion
- Appendix I: Marine finfish aquaculture public reporting in British Columbia
Introduction
This report provides an overview of the environmental and fish health performance of marine finfish facilities in the geographical region of the Discovery Islands, based on industry-submitted Conditions of Licence reports. The data are summarized by year and compare the performance of facilities in the Discovery Islands to all other marine finfish facilities operating in British Columbia waters.
In 2010, the Commission of Inquiry into the Decline of Sockeye Salmon in the Fraser River (Cohen Commission) made several recommendations pertaining to the management of aquaculture in the Discovery Islands, Fish Health Zone (FHZ) 3-2. It should be noted that these recommendations do not apply to facilities located in FHZ 3-3, three of which were included in DFO’s risk assessments and are included in this summary.
For the purposes of this report, the Discovery Islands facilities are the 18 farms identified in the Discovery Islands risk assessments and illustrated on the map (Figure 1). The two facilities culturing Chinook salmon (Yellow Island and Doctor Bay), three farms that are currently licensed but inactive (Dunsterville, Read Island and Young Passage), and one decommissioned experimental Chinook farm (Middle Point Bay) are not included. Additionally, two farms that are no longer licensed but were active since 2012 (Far Side and Frederick Arm), and three farms located in Fish Health Zone 3-3 (Shaw, Hardwicke and Althorpe) are included. The farms producing Atlantic salmon in the Discovery Passage area, as identified in the risk assessments, and included in the analysis in this report are:
- Althorpe (MOWI Canada West, FHZ 3-3)
- Barnes Bay (Grieg Seafood)
- Bickley Bay (MOWI Canada West)
- Brent Island (Cermaq Canada)
- Brougham Point (MOWI Canada West)
- Chancellor Channel (MOWI Canada West)
- Cyrus Rock (MOWI Canada West)
- Far Side (MOWI Canada West, no longer licensed)
- Frederick Arm (MOWI Canada West, no longer licensed)
- Hardwicke (MOWI Canada West, FHZ 3-3)
- Lees Bay (MOWI Canada West)
- Okisollo (MOWI Canada West)
- Phillips Arm (MOWI Canada West)
- Raza Island (Cermaq Canada)
- Shaw Point (MOWI Canada West, FHZ 3-3)
- Sonora Point (MOWI Canada West)
- Thurlow (MOWI Canada West)
- Venture Point (Cermaq Canada)

Long description
BC marine finfish aquaculture facilities, Discovery Islands
1:750,000
Coordinate system: NAD 1983 BC Environment Albers.
Produced by DFO Aquaculture Management Division.
Data: DFO licensed facilities as of August 26, 2020.
Map published: Sept 22, 2020.
This map is for information only and is not to be used for navigational purposes. For current list of licence holders, visit Aquaculture licensing in British Columbia.
| Facility reference number | Licence holder | Facility common name | Latitude | Longitude | Fish health zone | 2020 production |
|---|---|---|---|---|---|---|
| 1300 | MOWI Canada West | Althorpe | 50.47531 | -125.81 | 3.3 | Active |
| 871 | Grieg Seafood BC | Barnes Bay | 50.32437 | -125.26 | 3.2 | Active |
| 377 | MOWI Canada West | Bickley Bay | 50.45308 | -125.396 | 3.2 | Fallow |
| 1401 | Cermaq Canada | Brent Island | 50.28613 | -125.349 | 3.2 | Active |
| 388 | MOWI Canada West | Brougham Pt | 50.37192 | -125.38 | 3.2 | Fallow |
| 790 | MOWI Canada West | Chancellor | 50.41723 | -125.663 | 3.2 | Active |
| 733 | MOWI Canada West | Cyrus Rock | 50.25682 | -125.21 | 3.2 | Fallow |
| 456 | Saltstream Engineering | Doctor Bay | 50.2521 | -124.82 | 3.2 | Active |
| 138 | MOWI Canada West | Dunsterville | 50.14512 | -125.152 | 3.2 | Fallow |
| 1164 | MOWI Canada West | Far Side | 50.48576 | -125.274 | 3.2 | Decommissioned |
| 553 | Mowi Canada West | Frederick Arm | 50.46975 | -125.261 | 3.2 | Decommissioned |
| 1581 | MOWI Canada West | Hardwicke | 50.41339 | -125.77 | 3.3 | Active |
| 100 | MOWI Canada West | Lees Bay | 50.41063 | -125.7 | 3.2 | Active |
| 1770 | Agrimarine Industries Inc. | Middle Point Bay | 50.09242 | -125.313 | 3.2 | Decommissioned |
| 211 | MOWI Canada West | Okisollo | 50.30946 | -125.316 | 3.2 | Active |
| 78 | MOWI Canada West | Philips Arm | 50.48825 | -125.357 | 3.2 | Active |
| 304 | Cermaq Canada | Raza Island | 50.32159 | -125.009 | 3.2 | Active |
| 547 | MOWI Canada West | Read Island | 50.15363 | -125.147 | 3.2 | Fallow |
| 1136 | MOWI Canada West | Shaw Point | 50.48527 | -125.89 | 3.3 | Active |
| 380 | MOWI Canada West | Sonora Point | 50.42362 | -125.305 | 3.2 | Active |
| 378 | MOWI Canada West | Thurlow | 50.40808 | -125.341 | 3.2 | Fallow |
| 306 | Cermaq Canada | Venture Point | 50.30241 | -125.338 | 3.2 | Active |
| 216 | Yellow Island Aquaculture | Yellow Island | 50.13274 | -125.333 | 3.2 | Active |
| 769 | MOWI Canada West | Young Pass | 50.35014 | -125.342 | 3.2 | Fallow |
The Discovery Islands area is one of the main Atlantic salmon producing areas in BC with farms operated by MOWI Canada West, Cermaq Canada and Grieg Seafood BC. This area is generally quite good and consistent year-to-year with respect to environmental and fish health performance.
DFO conducts up to 120 randomized farm audits annually under the Fish Health Audit and Intelligence Program (FHAIP). These audits ensure the veracity of industry reported data, and compliance with Conditions of Licence (COL). DFO biologists and veterinarians collect samples to independently determine the fish health status of the farm at the time of audit, and ensure that any disease is being identified, mitigated and reported correctly by industry. Targeted audits have been added to the FHAIP in 2020 and are triggered at discretion of DFO biologists and veterinarians. These audits may or may not occur with advance warning to the company/facility.
Additional public information on the regulation and compliance of the marine finfish industry in British Columbia can be found through public reports on DFO’s Open Data Portal or the Pacific Region Aquaculture website (Appendix I).
Production
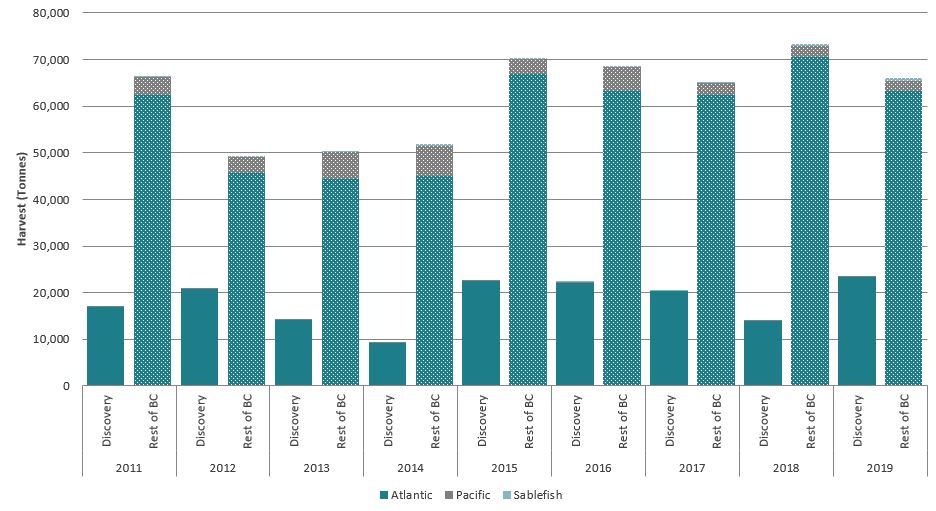
Farms in the Discovery Islands account for approximately 20% of Atlantic Salmon Production in British Columbia. There are 18 licensed facilities in the Discovery Islands with an average of 11 active facilities in a calendar year.
Long description
| Year | Area | Atlantic | Pacific | Sablefish |
|---|---|---|---|---|
| 2011 | Discovery | 16897.6 | 19.6 | 0 |
| Rest of BC | 62456.0 | 3790.2 | 292.5 | |
| 2012 | Discovery | 20743.52773 | 2.553496164 | 0 |
| Rest of BC | 45642.8 | 3501.3 | 23.9 | |
| 2013 | Discovery | 14138.70223 | 11.9150416 | 0 |
| Rest of BC | 44277.3 | 5983.3 | 101.3 | |
| 2014 | Discovery | 9248.936958 | 64.759038 | 0 |
| Rest of BC | 45005.5 | 6396.1 | 532.5 | |
| 2015 | Discovery | 22599.391 | 5.079 | 0 |
| Rest of BC | 66902.5 | 3118.2 | 206.4 | |
| 2016 | Discovery | 22168.82484 | 25.771 | 2.772 |
| Rest of BC | 63197.1 | 5119.1 | 258.7 | |
| 2017 | Discovery | 20444.1795 | 11 | 12 |
| Rest of BC | 62350.2 | 2544.5 | 262.5 | |
| 2018 | Discovery | 13902.804 | 19.125 | 0 |
| Rest of BC | 70430.3 | 2501.0 | 332.7 | |
| 2019 | Discovery | 23304.988 | 3.725 | 0 |
| Rest of BC | 63133.4 | 2348.6 | 573.2 |
This graph shows the production farmed fish in the Discovery Islands (DI) compared to the rest of BC. The left vertical axis shows the amount (weight) of fish harvested from each area by species(illustrated by the coloured columns/bars). Annual production has ranged between 9000-23,000 tonnes between 2011-2019.
A large majority of production in the Discovery Islands is Atlantic salmon, and all facilities identified in the risk assessments produce Atlantic salmon. There are two small facilities, Yellow Island and Doctor Bay, which produce other species. Yellow Island is a very small facility, with its own hatchery on land, which focusses mainly on research and harvests only small numbers of large Chinook salmon each year. Doctor Bay also produces small amounts of Chinook salmon, and has historically cultured small numbers of sablefish (Anoplopoma fimbria). The production of Chinook salmon and sablefish in the Discovery Islands is so small that it is difficult to display on the graph
Fish health - mortality
The average monthly mortality at fish farms in the Discovery Islands is about half that of other farms in British Columbia.

Long description
| Year | Area | Environmental | Disease | Handling/ transport | Mature | Old | Poor performer/ cull | Predation |
|---|---|---|---|---|---|---|---|---|
| 2013 | Discovery | 0.0% | 0.2% | 0.0% | 0.0% | 0.2% | 0.1% | 0.1% |
| Rest of BC | 0.1% | 0.3% | 0.2% | 0.0% | 0.2% | 0.1% | 0.1% | |
| 2014 | Discovery | 0.1% | 0.2% | 0.1% | 0.0% | 0.1% | 0.1% | 0.1% |
| Rest of BC | 0.2% | 0.3% | 0.1% | 0.0% | 0.2% | 0.1% | 0.0% | |
| 2015 | Discovery | 0.1% | 0.2% | 0.0% | 0.0% | 0.1% | 0.2% | 0.0% |
| Rest of BC | 0.3% | 0.3% | 0.1% | 0.1% | 0.3% | 0.2% | 0.0% | |
| 2016 | Discovery | 0.0% | 0.2% | 0.0% | 0.1% | 0.2% | 0.1% | 0.0% |
| Rest of BC | 0.5% | 0.3% | 0.1% | 0.1% | 0.3% | 0.2% | 0.0% | |
| 2017 | Discovery | 0.1% | 0.2% | 0.1% | 0.0% | 0.1% | 0.1% | 0.0% |
| Rest of BC | 0.3% | 0.3% | 0.1% | 0.0% | 0.2% | 0.1% | 0.0% | |
| 2018 | Discovery | 0.0% | 0.2% | 0.2% | 0.0% | 0.1% | 0.1% | 0.0% |
| Rest of BC | 0.7% | 0.7% | 0.2% | 0.1% | 0.3% | 0.2% | 0.0% | |
| 2019 | Discovery | 0.0% | 0.3% | 0.2% | 0.1% | 0.1% | 0.2% | 0.0% |
| Rest of BC | 0.7% | 0.3% | 0.2% | 0.0% | 0.3% | 0.2% | 0.0% |
This graph shows the average percent monthly mortality in DI compared to other farming regions of BC. It also shows the causes of death. Mortality rates in DI are generally less than 1% per month Farms in the DI typically experience lower mortalities than other regions of BC. Generally water quality is good (few instances of low dissolved oxygen events and harmful algal blooms) and disease is less frequent given the area and production practices.
A production practice which is unique to the Discovery Islands is that salmon smolts are generally not entered into any of the DI farms directly from freshwater hatcheries. This practice is in place due to the Myxozoan parasite Kudoa thyrsites. Kudoa infects salmon (both farmed and wild) and creates intramuscular cysts without resulting disease or compromise in the salmon host. However, post-mortem enzyme degradation of the cysts results in muscular liquefaction and therefore significant fillet quality downgrades. This parasite is ubiquitous in BC marine waters, but the degree of infection pressure seems much higher in the Discovery Islands. Industry has learned that by introducing smolts to areas outside the DIs first, and then months later transferring those fish into DI farms results in lower levels of infection, reducing subsequent cyst formation, and resulting in substantially fewer fillet downgrades. The exact mechanism of this protective effect is unclear, and is the subject of ongoing research.
This production practice means that without smolt entries occurring in the DI there is very little of the early mortality and production disease which often occur in the first months when smolts are at sea. The primary production disease affecting farmed Atlantic salmon in BC is Mouthrot which is caused by the ubiquitous marine bacteria Tenacibaculum maritimum. Mouthrot does not occur in Pacific salmon species, and only occurs in Atlantic salmon within their first 6-8 months at sea. This disease is treated with in-feed antibiotics and is responsible for the vast majority of antibiotic use in BC aquaculture.
Mortality events
The majority of mortality events in the Discovery Passage are caused by environmental conditions. In recent years, there has been more impact of handling and treatment, and improved auditing and reporting of events by industry.

Long description
| Year | Area | Predation | Physiological | Environmental | Mechanical | Disease | Other/ unknown |
|---|---|---|---|---|---|---|---|
| 2011 | Discovery | 0 | 0 | 5 | 0 | 0 | 0 |
| Rest of BC | 0 | 0 | 8 | 0 | 0 | 0 | |
| 2012 | Discovery | 0 | 0 | 0 | 0 | 0 | 0 |
| Rest of BC | 0 | 1 | 13 | 0 | 4 | 0 | |
| 2013 | Discovery | 0 | 0 | 0 | 0 | 0 | 0 |
| Rest of BC | 0 | 2 | 4 | 0 | 1 | 0 | |
| 2014 | Discovery | 0 | 0 | 5 | 0 | 0 | 0 |
| Rest of BC | 0 | 1 | 11 | 1 | 4 | 0 | |
| 2015 | Discovery | 0 | 0 | 3 | 0 | 0 | 0 |
| Rest of BC | 0 | 1 | 21 | 0 | 0 | 2 | |
| 2016 | Discovery | 0 | 0 | 4 | 0 | 0 | 1 |
| Rest of BC | 0 | 0 | 24 | 1 | 3 | 1 | |
| 2017 | Discovery | 0 | 0 | 3 | 1 | 0 | 0 |
| Rest of BC | 2 | 0 | 28 | 8 | 0 | 0 | |
| 2018 | Discovery | 0 | 0 | 6 | 4 | 1 | 0 |
| Rest of BC | 0 | 0 | 45 | 11 | 10 | 0 | |
| 2019 | Discovery | 0 | 1 | 3 | 7 | 0 | 0 |
| Rest of BC | 0 | 0 | 58 | 13 | 0 | 1 |
A Mortality Event occurs when the number (or "biomass") of dead fish at a facility growing Atlantic or Pacific salmon exceeds the thresholds outlined by conditions of licence for 24hrs (4,000kg or 2% inventory) or five days (10,000kg or 5% inventory).
This graph shows the number of mortality events per active facility. Farms in the Discovery Islands typically experience a similar rate of mortality events to other areas of BC.
The increase in Mortality Events in 2018 is attributed mainly to unfavourable environmental conditions, but also to an increase in reporting due to increased compliance auditing efforts by DFO biologists beginning in 2016, which enforced reporting requirements. In 2012 and 2013, there were no reported Mortality events in DI. In 2011, 2014, 2015 there was a low number of mortality events reported and all were attributed to environmental conditions.
Mortality Events due to environmental factors are increased by the higher-than-normal presence of poor gill health issues which predispose fish to die when water conditions are adverse, such as during low dissolved oxygen or harmful algae bloom events.
| Date | Licence holder | Facility | Species | Probable cause or diagnosis |
|---|---|---|---|---|
| 21-Jun-11 | Marine Harvest Canada | Conville Bay | Atlantic Salmon | Algae bloom |
| 30-Jun-11 | Cermaq Canada | Brent Island | Atlantic Salmon | Algae bloom |
| 30-Jun-11 | Marine Harvest Canada | Far Side | Atlantic Salmon | Algae bloom |
| 30-Jun-11 | Marine Harvest Canada | Frederick Arm | Atlantic Salmon | Algae bloom |
| 04-Jul-11 | Marine Harvest Canada | Brougham Point | Atlantic Salmon | Algae bloom |
| 07-Jul-14 | Cermaq Canada | Brent Island | Atlantic Salmon | Low Dissolved Oxygen |
| 16-Sep-14 | Cermaq Canada | Venture Point | Atlantic Salmon | Low Dissolved Oxygen |
| 18-Sep-14 | Cermaq Canada | Brent Island | Atlantic Salmon | Low Dissolved Oxygen |
| 23-Sep-14 | Marine Harvest Canada | Lees Bay | Atlantic Salmon | Algae bloom |
| 16-Oct-14 | Marine Harvest Canada | Okisollo | Atlantic Salmon | Low Dissolved Oxygen |
| 24-Jul-15 | Marine Harvest Canada | Lees Bay | Atlantic Salmon | Algae bloom |
| 24-Jul-15 | Marine Harvest Canada | Phillips Arm | Atlantic Salmon | Algae bloom |
| 24-Jul-15 | Marine Harvest Canada | Hardwicke | Atlantic Salmon | Algae bloom |
| 3-Feb-16 | Cermaq Canada | Brent Island | Atlantic Salmon | Other - explain |
| 11-Sep-16 | Cermaq Canada | Brent Island | Atlantic Salmon | Low Dissolved Oxygen |
| 14-Sep-16 | Grieg Seafood BC | Barnes Bay | Atlantic Salmon | Low Dissolved Oxygen |
| 26-Sep-16 | Cermaq Canada | Venture Point | Atlantic Salmon | Low Dissolved Oxygen |
| 11-Oct-16 | Marine Harvest Canada | Okisollo | Atlantic Salmon | Low Dissolved Oxygen |
| 24-Aug-17 | Marine Harvest Canada | Hardwicke | Atlantic Salmon | Algae bloom |
| 31-Aug-17 | Marine Harvest Canada | Althorpe | Atlantic Salmon | Handling |
| 8-Sep-17 | Marine Harvest Canada | Althorpe | Atlantic Salmon | Algae bloom |
| 25-Sep-17 | Marine Harvest Canada | Hardwicke | Atlantic Salmon | Low Dissolved Oxygen |
| 9-Mar-18 | Cermaq Canada | Raza Island | Atlantic Salmon | Algae bloom |
| 1-Jun-18 | Marine Harvest Canada | Phillips Arm | Atlantic Salmon | Treatment |
| 6-Jun-18 | Grieg Seafood BC | Barnes Bay | Atlantic Salmon | Non-infectious disease |
| 6-Aug-18 | Marine Harvest Canada | Okisollo | Atlantic Salmon | Low Dissolved Oxygen |
| 22-Aug-18 | Cermaq Canada | Venture Point | Atlantic Salmon | Low Dissolved Oxygen |
| 28-Aug-18 | Grieg Seafood BC | Barnes Bay | Atlantic Salmon | Low Dissolved Oxygen |
| 06-Sep-18 | Cermaq Canada | Brent Island | Atlantic Salmon | Handling |
| 1-Oct-18 | Cermaq Canada | Venture Point | Atlantic Salmon | Low Dissolved Oxygen |
| 8-Oct-18 | Grieg Seafood BC | Barnes Bay | Atlantic Salmon | Handling |
| 9-Oct-18 | Marine Harvest Canada | Lees Bay | Atlantic Salmon | Treatment |
| 19-Nov-18 | Grieg Seafood BC | Barnes Bay | Atlantic Salmon | Low Dissolved Oxygen |
| 11-Jun-19 | MOWI Canada West | Sonora Point | Atlantic Salmon | Handling |
| 27-Jun-19 | MOWI Canada West | Phillips Arm | Atlantic Salmon | Handling |
| 08-Jul-19 | MOWI Canada West | Sonora Point | Atlantic Salmon | Handling |
| 12-Jul-19 | MOWI Canada West | Chancellor Channel | Atlantic Salmon | Handling |
| 16-Jul-19 | MOWI Canada West | Phillips Arm | Atlantic Salmon | Handling |
| 31-Jul-19 | MOWI Canada West | Sonora Point | Atlantic Salmon | Handling |
| 16-Aug-19 | MOWI Canada West | Althorpe | Atlantic Salmon | Low Dissolved Oxygen |
| 19-Aug-19 | MOWI Canada West | Chancellor Channel | Atlantic Salmon | Maturation |
| 28-Aug-19 | MOWI Canada West | Lees Bay | Atlantic Salmon | Low Dissolved Oxygen |
| 2-Sep-19 | MOWI Canada West | Hardwicke | Atlantic Salmon | Low Dissolved Oxygen |
| 30-Oct-19 | MOWI Canada West | Okisollo | Atlantic Salmon | Treatment |
Fish health events
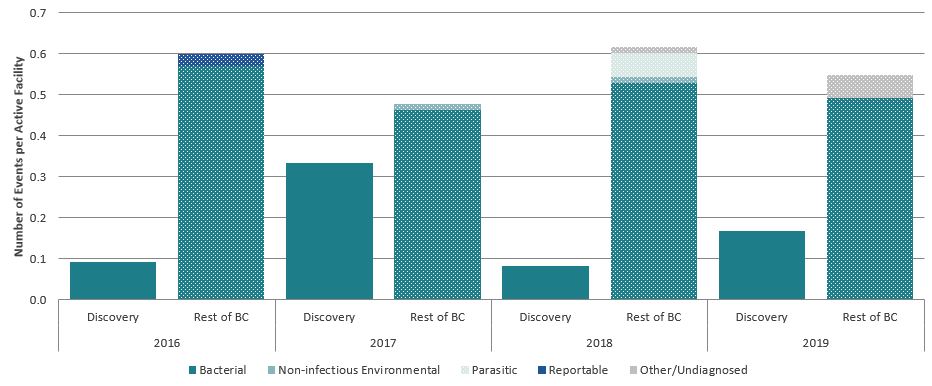
The occurrence of fish health events at farms in the Discovery Islands is generally lower than in other areas of British Columbia.
Long description
| Year | Area | Parasitic | Bacterial | Non-infectious environmental | Reportable | Other/ undiagnosed |
|---|---|---|---|---|---|---|
| 2016 | Discovery | 0 | 1 | 0 | 0 | 0 |
| Rest of BC | 0 | 40 | 0 | 2 | 0 | |
| 2017 | Discovery | 0 | 4 | 0 | 0 | 0 |
| Rest of BC | 0 | 32 | 1 | 0 | 0 | |
| 2018 | Discovery | 0 | 1 | 0 | 0 | 0 |
| Rest of BC | 4 | 36 | 1 | 0 | 1 | |
| 2019 | Discovery | 0 | 2 | 0 | 0 | 0 |
| Rest of BC | 0 | 35 | 0 | 0 | 4 |
A Fish Health Event(FHE) occurs when veterinary intervention is required due to a suspected or diagnosed disease at a facility and mitigation is applied. Mitigation most often takes the form of antibiotic treatments, but could also be any of: culling, accelerated harvest, quarantine, enhanced biosecurity, disease investigation or reducing stress. Fish Health Events are sometimes, but not always, associated with a Mortality Event.
This graph shows the number of FHEs per active facility. Farms in the Discovery Islands typically experience a lower rate of FHEs than in other areas in BC. There have been eight treatment events since 2016 and most of these were attributed to mouthrot.
| Date | Licence holder | Facility | Species | Veterinary diagnosis |
|---|---|---|---|---|
| Jan-16 | Cermaq Canada | Raza Island | Atlantic Salmon | Mouthrot |
| 26-Jun-17 | Grieg Seafood BC | Barnes Bay | Atlantic Salmon | Mouthrot |
| Jul-17 | Cermaq Canada | Brent Island | Atlantic Salmon | Mouthrot |
| 18-Oct-17 | Marine Harvest Canada | Okisollo | Atlantic Salmon | Furunculosis |
| 04-Nov-17 | Cermaq Canada | Raza Island | Atlantic Salmon | Mouthrot |
| 14-May-18 | Marine Harvest Canada | Shaw Point | Atlantic Salmon | Mouthrot |
| 13-Apr-19 | MOWI Canada West | Shaw Point | Atlantic Salmon | Mouthrot |
| 01-Nov-19 | Cermaq Canada | Raza Island | Atlantic Salmon | Mouthrot |
Fish health audits
DFO conducts at least 120 marine farm audits annually under the Fish Health Audit and Intelligence Program (FHAIP). Approximately 850 fish are sampled and submitted for diagnostic testing annually. From 2011-2018 DFO conducted 118 audits at Atlantic salmon farms in the Discovery Islands. These farms generally have less disease diagnosed than the industry average.

Long description
| Year | Area | No significant disease(s) identified | Undiagnosed | Non-infectious environmental or bacterial disease(s) identified | Reportable disease |
|---|---|---|---|---|---|
| 2011 | Discovery | 12 | 1 | 0 | 0 |
| Rest of BC | 32 | 6 | 12 | 0 | |
| 2012 | Discovery | 22 | 1 | 1 | 0 |
| Rest of BC | 68 | 11 | 11 | 0 | |
| 2013 | Discovery | 11 | 2 | 0 | 0 |
| Rest of BC | 71 | 8 | 22 | 0 | |
| 2014 | Discovery | 16 | 0 | 0 | 0 |
| Rest of BC | 74 | 6 | 12 | 0 | |
| 2015 | Discovery | 17 | 0 | 1 | 0 |
| Rest of BC | 66 | 6 | 27 | 0 | |
| 2016 | Discovery | 15 | 3 | 3 | 0 |
| Rest of BC | 60 | 13 | 19 | 0 | |
| 2017 | Discovery | 13 | 2 | 1 | 0 |
| Rest of BC | 81 | 6 | 13 | 0 | |
| 2018 | Discovery | 17 | 2 | 1 | 0 |
| Rest of BC | 62 | 4 | 32 | 0 |
DFO biologists and veterinarians conduct randomized routine audits of marine salmon farms. In 2020, targeted audits were also added to the FHAIP which are triggered at the discretion of DFO veterinarians when there may be elevated risk, or suspected/confirmed non-compliance. During these audits, all aspects of fish health and husbandry are reviewed, as well as compliance with the conditions of licence and Health Management Plan (HMP). Samples of moribund and/or recently dead fish are taken by DFO auditors on site and sent to a certified diagnostic laboratory for analysis including: bacteriology, virology, PCR, and histopathology. Additional molecular diagnostics and special staining (for histopathology) may be used at the discretion of the veterinarian and veterinary pathologist(s). DFO veterinarians review the results of the diagnostic testing; along with the field notes on fish behavior and appearance, recent mortality, handling and treatment events, and gross necropsy notes, to make a farm-level diagnosis.

Long description
| - | Not Infectious | Infectious | |||||||||
|---|---|---|---|---|---|---|---|---|---|---|---|
| Year | Area | Low D.O - hypoxia | Mixed etiology | No disease | Open - no known cause/ no significant lesions | Predation - seal/ sea lion | Bacterial kidney disease | Mouth rot (filamentous myxobacteriosis) | Salmonid rickettsial septicaemia | Winter ulcer | Amoebic gill disease |
| 2012 | Other | 1.16% | 2.33% | 11.63% | 52.33% | 9.30% | 6.98% | 5.81% | 2.33% | 1.16% | 0.00% |
| Discovery | 0.00% | 0.00% | 0.00% | 77.27% | 4.55% | 9.09% | 0.00% | 0.00% | 0.00% | 0.00% | |
| 2013 | Other | 1.00% | 7.00% | 8.00% | 44.00% | 7.00% | 8.00% | 10.00% | 6.00% | 0.00% | 0.00% |
| Discovery | 0.00% | 0.00% | 0.00% | 77.78% | 22.22% | 0.00% | 0.00% | 0.00% | 0.00% | 0.00% | |
| 2014 | Other | 0.00% | 2.11% | 82.11% | 4.21% | 0.00% | 3.16% | 7.37% | 0.00% | 0.00% | 1.05% |
| Discovery | 0.00% | 0.00% | 87.50% | 0.00% | 0.00% | 0.00% | 6.25% | 0.00% | 0.00% | 0.00% | |
| 2015 | Other | 0.00% | 1.96% | 74.51% | 2.94% | 0.00% | 1.96% | 4.90% | 8.82% | 0.98% | 2.94% |
| Discovery | 0.00% | 0.00% | 94.44% | 0.00% | 0.00% | 0.00% | 5.56% | 0.00% | 0.00% | 0.00% | |
| 2016 | Other | 0.00% | 3.33% | 63.33% | 11.11% | 0.00% | 0.00% | 11.11% | 7.78% | 1.11% | 0.00% |
| Discovery | 0.00% | 0.00% | 78.95% | 5.26% | 0.00% | 0.00% | 0.00% | 15.79% | 0.00% | 0.00% | |
| 2017 | Other | 3.96% | 5.94% | 67.33% | 7.92% | 0.00% | 1.98% | 2.97% | 0.99% | 1.98% | 0.00% |
| Discovery | 6.25% | 0.00% | 75.00% | 12.50% | 0.00% | 0.00% | 0.00% | 0.00% | 0.00% | 0.00% | |
| 2018 | Other | 0.00% | 4.12% | 59.79% | 4.12% | 0.00% | 0.00% | 9.28% | 8.25% | 2.06% | 2.06% |
| Discovery | 0.00% | 0.00% | 88.89% | 5.56% | 0.00% | 0.00% | 5.56% | 0.00% | 0.00% | 0.00% | |
This graph displays the farm-level diagnoses made by DFO veterinarians from 2012- 2018. The bar charts on the top half show data from all salmon farming regions in BC except for Discovery Islands. The bottom half shows the data from Discovery Islands only.
The left axis lists the different diagnoses that have been made during this period. The light-blue bars indicate that the diagnosis was not an infectious disease, and the dark blue bars indicate where an infectious disease was present.
In all areas of BC (including Discovery Islands), the majority of farm-level diagnoses are ‘open’ or ‘no disease’. An ‘open’ diagnosis indicates that there is no know or obvious disease present. Between 2013 and 2014, a change in reporting categories saw a change in language from ‘open’ to ‘no disease’.
Sea lice
Since 2011 there have been 14 incidents of sea lice threshold exceedances during the juvenile salmon outmigration period (March- June) in the Discovery Islands.

Long description
| Year | Area | Season | Discovery | DI outmigration | Rest of BC | BC Outmigration |
|---|---|---|---|---|---|---|
| 2011 | Discovery | Jan-Feb | 0.444444444 | - | - | - |
| Mar-Jun | - | 0.753191489 | - | - | ||
| July-Sep | 1.363636364 | - | - | - | ||
| Oct-Dec | 1.209090909 | - | - | - | ||
| Rest of BC | Jan-Feb | - | - | 0.888372093 | - | |
| Mar-Jun | - | - | - | 0.406741573 | ||
| July-Sep | - | - | 1.461111111 | - | ||
| Oct-Dec | - | - | 1.713274336 | - | ||
| 2012 | Discovery | Jan-Feb | 1.391304348 | - | - | - |
| Mar-Jun | - | 1.761764706 | - | - | ||
| July-Sep | 0.954545455 | - | - | - | ||
| Oct-Dec | 3.285 | - | - | - | ||
| Rest of BC | Jan-Feb | - | - | 0.690410959 | - | |
| Mar-Jun | - | - | - | 0.696296296 | ||
| July-Sep | - | - | 1.341666667 | - | ||
| Oct-Dec | - | - | 2.169444444 | - | ||
| 2013 | Discovery | Jan-Feb | 2.325 | - | - | - |
| Mar-Jun | - | 0.3625 | - | - | ||
| July-Sep | 1.342857143 | - | - | - | ||
| Oct-Dec | 3.666666667 | - | - | - | ||
| Rest of BC | Jan-Feb | - | - | 1.945614035 | - | |
| Mar-Jun | - | - | - | 1.033834586 | ||
| July-Sep | - | - | 2.005813953 | - | ||
| Oct-Dec | - | - | 3.730769231 | - | ||
| 2014 | Discovery | Jan-Feb | 1.43 | - | - | - |
| Mar-Jun | - | 0.775 | - | - | ||
| July-Sep | 1.988888889 | - | - | - | ||
| Oct-Dec | 2.218181818 | - | - | - | ||
| Rest of BC | Jan-Feb | - | - | 1.948648649 | - | |
| Mar-Jun | - | - | - | 0.635064935 | ||
| July-Sep | - | - | 1.466981132 | - | ||
| Oct-Dec | - | - | 2.488392857 | - | ||
| 2015 | Discovery | Jan-Feb | 2.592857143 | - | - | - |
| Mar-Jun | - | 2.272 | - | - | ||
| July-Sep | 1.368421053 | - | - | - | ||
| Oct-Dec | 2.395454545 | - | - | - | ||
| Rest of BC | Jan-Feb | - | - | 1.987654321 | - | |
| Mar-Jun | - | - | - | 2.249723757 | ||
| July-Sep | - | - | 3.418446602 | - | ||
| Oct-Dec | - | - | 2.065833333 | - | ||
| 2016 | Discovery | Jan-Feb | 0.893333333 | - | - | - |
| Mar-Jun | - | 0.98 | - | - | ||
| July-Sep | 0.673076923 | - | - | - | ||
| Oct-Dec | 4.97037037 | - | - | - | ||
| Rest of BC | Jan-Feb | - | - | 1.285897436 | - | |
| Mar-Jun | - | - | - | 1.081528662 | ||
| July-Sep | - | - | 1.165 | - | ||
| Oct-Dec | - | - | 2.42020202 | - | ||
| 2017 | Discovery | Jan-Feb | 2.498333333 | - | - | - |
| Mar-Jun | - | 0.50204335 | - | - | ||
| July-Sep | 1.111378385 | - | - | - | ||
| Oct-Dec | 3.468557099 | - | - | - | ||
| Rest of BC | Jan-Feb | - | - | 3.858915778 | - | |
| Mar-Jun | - | - | - | 1.332788092 | ||
| July-Sep | - | - | 1.261411476 | - | ||
| Oct-Dec | - | - | 2.142982321 | - | ||
| 2018 | Discovery | Jan-Feb | 0.166412037 | - | - | - |
| Mar-Jun | - | 0.214928102 | - | - | ||
| July-Sep | 1.216722222 | - | - | - | ||
| Oct-Dec | 2.19094736 | - | - | - | ||
| Rest of BC | Jan-Feb | - | - | 1.467702636 | - | |
| Mar-Jun | - | - | - | 2.936815179 | ||
| July-Sep | - | - | 4.497252757 | - | ||
| Oct-Dec | - | - | 1.376120194 | - | ||
| 2019 | Discovery | Jan-Feb | 1.751446324 | - | - | - |
| Mar-Jun | - | 1.612489791 | - | - | ||
| July-Sep | 1.973250784 | - | - | - | ||
| Oct-Dec | 2.348405556 | - | - | - | ||
| Rest of BC | Jan-Feb | - | - | 0.986444654 | - | |
| Mar-Jun | - | - | - | 1.233499041 | ||
| July-Sep | - | - | 2.062111405 | - | ||
| Oct-Dec | - | - | 3.043685448 | - | ||
| 2020 | Discovery | Jan-Feb | 1.997142857 | - | - | - |
| Mar-Jun | - | 1.755932863 | - | - | ||
| July-Sep | Not available | - | - | - | ||
| Oct-Dec | Not available | - | - | - | ||
| Rest of BC | Jan-Feb | - | - | 1.591093365 | - | |
| Mar-Jun | - | - | - | 1.388650465 | ||
| July-Sep | - | - | Not available | - | ||
| Oct-Dec | - | - | Not available | - |
This graph shows the average monthly sea lice abundance in the Discovery Islands and in the rest of BC. The bold, black horizontal line indicates the sea lice threshold as set out in the Conditions of Licence (i.e. 3 motile L. salmonis per fish). The coloured bars are grouped by sets of months, with the bright green bars indicating the juvenile salmon outmigration period in the Discovery Islands, and the bright yellow bars indicating the outmigration for the other farming regions of BC. Additional details on the abundance during the juvenile salmon outmigration period are shown in Figure 9.

Long description
| Year | Area | Month | Discovery | Rest of BC |
|---|---|---|---|---|
| 2011 | Discovery | March | 0.541666667 | - |
| April | 0.466666667 | - | ||
| May | 0.790909091 | - | ||
| June | 1.216666667 | - | ||
| Rest of BC | March | - | 0.341463415 | |
| April | - | 0.313333333 | ||
| May | - | 0.431914894 | ||
| June | - | 0.533333333 | ||
| 2012 | Discovery | March | 1.592307692 | - |
| April | 2.2 | - | ||
| May | 1.5 | - | ||
| June | - | - | ||
| Rest of BC | March | - | 0.621212121 | |
| April | - | 0.841176471 | ||
| May | - | 0.626315789 | ||
| June | - | 0.766666667 | ||
| 2013 | Discovery | March | 0.56 | - |
| April | 0.35 | - | ||
| May | 0.25 | - | ||
| June | 0.2 | - | ||
| Rest of BC | March | - | 1.424242424 | |
| April | - | 1.212121212 | ||
| May | - | 0.763888889 | ||
| June | - | 0.741935484 | ||
| 2014 | Discovery | March | 0.68 | - |
| April | 0.557142857 | - | ||
| May | 0.816666667 | - | ||
| June | 1.066666667 | - | ||
| Rest of BC | March | - | 0.819444444 | |
| April | - | 0.837837838 | ||
| May | - | 0.497560976 | ||
| June | - | 0.4225 | ||
| 2015 | Discovery | March | 3.6 | - |
| April | 3.5 | - | ||
| May | 1.08 | - | ||
| June | 1.0875 | - | ||
| Rest of BC | March | - | 1.854761905 | |
| April | - | 2.47 | ||
| May | - | 2.276086957 | ||
| June | - | 2.351162791 | ||
| 2016 | Discovery | March | 0.985714286 | - |
| April | 1.533333333 | - | ||
| May | 0.825 | - | ||
| June | 0.744444444 | - | ||
| Rest of BC | March | - | 1.317948718 | |
| April | - | 1.235 | ||
| May | - | 0.88974359 | ||
| June | - | 0.879487179 | ||
| 2017 | Discovery | March | 0.239477513 | - |
| April | 0.44525463 | - | ||
| May | 0.718583333 | - | ||
| June | 0.776041667 | - | ||
| Rest of BC | March | - | 2.809222978 | |
| April | - | 0.910695562 | ||
| May | - | 1.158072165 | ||
| June | - | 0.682009399 | ||
| 2018 | Discovery | March | 0.126311728 | - |
| April | 0.297569444 | - | ||
| May | 0.198670635 | - | ||
| June | 0.231556153 | - | ||
| Rest of BC | March | - | 2.240916989 | |
| April | - | 2.657649035 | ||
| May | - | 3.391604047 | ||
| June | - | 3.453644299 | ||
| 2019 | Discovery | March | 2.388502135 | - |
| April | 1.507333333 | - | ||
| May | 1.206820988 | - | ||
| June | 1.217152778 | - | ||
| Rest of BC | March | - | 1.044873723 | |
| April | - | 1.047032307 | ||
| May | - | 2.009120753 | ||
| June | - | 0.676960691 | ||
| 2020 | Discovery | March | 2.137380051 | - |
| April | 1.839662162 | - | ||
| May | 1.110429293 | - | ||
| June | 1.870587607 | - | ||
| Rest of BC | March | - | 1.477328591 | |
| April | - | 1.121431684 | ||
| May | - | 1.746564937 | ||
| June | - | 1.185063034 |
This graph shows the average monthly sea lice abundance, during the juvenile salmon outmigration period, in the Discovery Islands and in the rest of BC. The bold, black horizontal line indicates the sea lice threshold as set out in the Conditions of Licence (i.e. 3 motile L. salmonis per fish).
As a condition of licence (COL), all farms have been required to regularly sample and report sea lice numbers on farms. The licence also sets out a threshold of three motile lice per fish as a precautionary management threshold to trigger mitigation and/or increased sampling/reporting depending on the time of year. This licence requirement ensures that sea lice numbers are at their lowest during the outmigration period of wild juvenile salmon (March 1st –June 30th annually). DFO audits 50% of all active facilities during the outmigration period, and approximately 15% of active facilities per quarter during the remainder of the year. These sea lice audits involve a comprehensive review of sea lice sampling technique, counting methodology and sea lice classification. DFO auditor counts are compared to industry counts statistically to identify any error in the counting and classification methodology.
New licence conditions came into effect in March 2020 which increased sampling and reporting requirements around sea lice management on farms. These changes were made with contributions and feedback from First Nations, non-government environmental groups, industry and stakeholders. With the new licence conditions, there is mandatory reporting of pre- and post-treatment sea lice numbers to allow DFO to monitor treatment efficacy and thereby detect and mitigate emerging resistance to sea lice treatments. There is a requirement for all lice removed mechanically to be captured, and the language of the licence has been improved to increase enforceability.
Farms in the Discovery Islands typically experience high lice infections in the fall as wild adult salmon return to spawn and carry with them high lice loads. Generally DI farms have performed better than industry average for sea lice management during the critical outmigration period. The number of facilities which have an exceedance, and the time spent in exceedance of the threshold are typically fewer and shorter than other farming areas. The DI farms have not had widespread occurrence of SLICE resistance, which have been seen in other farming areas resulting in significant sea lice management challenges. On the farms, sea lice mitigation efforts have generally resulted in reducing lice loads prior to the juvenile salmon outmigration period. Details on the mitigation treatments can be found in the Therapeutants section below.
| Year/month | Licence holder | Facility | Maximum sea lice abundance | Number of months over threshold |
|---|---|---|---|---|
| June 2011 | Marine Harvest Canada | Chancellor Channel | 4.0 | 1 |
| March 2012 | Marine Harvest Canada | Hardwicke | 9.2 | 1 |
| April 2012 | Marine Harvest Canada | Brougham Point | 5.9 | 1 |
| April 2012 | Marine Harvest Canada | Okisollo | 4.4 | 1 |
| April 2012 | Marine Harvest Canada | Sonora Point | 4.2 | 1 |
| May 2012 | Marine Harvest Canada | Thurlow | 4.9 | 1 |
| May 2014 | Marine Harvest Canada | Sonora Point | 3.5 | 2 |
| March 2015 | Marine Harvest Canada | Hardwicke | 10.1 | 2 |
| March 2015 | Marine Harvest Canada | Lees Bay | 15.8 | 1 |
| June 2015 | Cermaq Canada | Brent Island | 4.9 | 1 |
| April 2016 | Marine Harvest Canada | Okisollo | 4.0 | 1 |
| March 2019 | MOWI Canada West | Hardwicke | 7.9 | 2 |
| March 2019 | MOWI Canada West | Shaw Point | 5.7 | 3 |
| June 2019 | MOWI Canada West | Chancellor Channel | 3.1 | 1 |
| March 2020 | MOWI Canada West | Lees Bay | 13.8 | 2 |
| March 2020 | MOWI Canada West | Shaw Point | 20.9 | 4 |
| April 2020 | Grieg Seafood BC | Barnes Bay | 3.3 | 1 |
| April 2020 | Cermaq Canada | Brent Island | 5.4 | 1 |
| June 2020 | MOWI Canada West | Lees Bay | 6.8 | 1 |
| June 2020 | MOWI Canada West | Okisollo | 7.0 | 1 |
| June 2020 | Cermaq Canada | Venture Point | 3.2 | 1 |
Sea lice audits
Within the 120 marine farm audits conducted annually; 50% of all active facilities will be subject to a sea lice audit during the outmigration period, and approximately 25% of facilities will be audited during the remainder of the year for a total of approximately 40 sea lice audits annually. From 2011-2019 DFO conduced 60 sea lice audits at DI farms.

Long description
| Year | Area | Statistical agreement | Statistical difference, methodology meets requirements | Statistical difference, follow-up action taken | Number of audits |
|---|---|---|---|---|---|
| 2011 | Discovery | 7 | 0 | 0 | 7 |
| Rest of BC | 27 | 1 | 0 | 28 | |
| 2012 | Discovery | 10 | 0 | 0 | 10 |
| Rest of BC | 29 | 2 | 0 | 31 | |
| 2013 | Discovery | 6 | 0 | 0 | 6 |
| Rest of BC | 31 | 0 | 1 | 32 | |
| 2014 | Discovery | 5 | 0 | 0 | 5 |
| Rest of BC | 27 | 3 | 0 | 30 | |
| 2015 | Discovery | 8 | 0 | 0 | 8 |
| Rest of BC | 30 | 3 | 5 | 38 | |
| 2016 | Discovery | 6 | 1 | 0 | 7 |
| Rest of BC | 31 | 2 | 1 | 34 | |
| 2017 | Discovery | 5 | 1 | 0 | 6 |
| Rest of BC | 34 | 1 | 5 | 40 | |
| 2018 | Discovery | 6 | 1 | 0 | 7 |
| Rest of BC | 36 | 6 | 0 | 42 | |
| 2019 | Discovery | 7 | 0 | 0 | 7 |
| Rest of BC | 40 | 4 | 0 | 44 |
During a sea lice audit, DFO auditors conduct a comprehensive review of sea lice sampling technique, counting methodology and sea lice classification. Farm staff count sea lice on 10 fish from at least three pens (at least 30 fish total), which is the minimum required for a ‘counting event’ as defined in the licence. DFO auditors observe the counting technique and lice identification, and conduct an independent count of 10 fish from each of the same pens. DFO auditor counts are compared to industry counts statistically to identify any error in the counting and classification methodology. If a deficiency in sampling technique, counting rigor, sea lice life stage or species ID is identified, the company is issued a deficiency letter and this is deficiency is noted and checked for resolution at the next audit. A repeated deficiency may be classified as a non-compliance, and referred to DFO Conservation and Protection for possible prosecution.
Fish health and sea lice treatments
Farms in the Discovery Islands perform about ¼ of the antibacterial treatments compared to the rest of BC. Mechanical and bath treatments for sea lice are on par with the rest of the province and SLICE© treatments are slightly higher than other regions.

Long description
| Year | Area | Antibacterial | Hydrogen Peroxide | Slice | Hydrolicer | FW bath |
|---|---|---|---|---|---|---|
| 2013 | Discovery | 3 | 0 | 8 | 0 | 0 |
| Rest of BC | 51 | 0 | 32 | 0 | 0 | |
| 2014 | Discovery | 1 | 0 | 9 | 0 | 0 |
| Rest of BC | 48 | 1 | 33 | 0 | 0 | |
| 2015 | Discovery | 3 | 0 | 12 | 0 | 0 |
| Rest of BC | 66 | 8 | 45 | 0 | 0 | |
| 2016 | Discovery | 1 | 3 | 9 | 0 | 0 |
| Rest of BC | 51 | 10 | 30 | 0 | 0 | |
| 2017 | Discovery | 4 | 1 | 5 | 0 | 0 |
| Rest of BC | 48 | 19 | 42 | 0 | 0 | |
| 2018 | Discovery | 0 | 3 | 6 | 0 | 0 |
| Rest of BC | 61 | 19 | 28 | 0 | 0 | |
| 2019 | Discovery | 3 | 0 | 6 | 2 | 3 |
| Rest of BC | 58 | 15 | 48 | 7 | 3 |
This graph shows the number of treatments per active facility in the Discovery Islands and in the rest of BC. A tabular summary of the treatments in the Discovery Islands can be found below.
‘Antibacterial’ indicates a treatment with antibiotics for a specific reason (infection). Antibiotics are always prescribed by a licensed veterinarian. Fish are usually medicated by adding the antibiotic to the fish food and feeding it to the fish. The rate of antibacterial treatments is generally lower than in other regions, as farms in this area tend to have much less Mouthrot due to the production practice of not stocking smolts into the area directly from the hatchery.
‘Hydrogen peroxide’ refers to a sea lice bath treatment, where fish are taken from their sea pens and placed into a large boat filled with a special type of hydrogen peroxide compound for a few hours. This kills the sea lice so they fall off the fish. The fish are then placed back into their sea pens, and the lice are captured and composted in land-based facilities. Hydrogen Peroxide treatments have been successfully utilized in the Discovery Islands since 2015. No hydrogen peroxide treatments were applied in 2019.
‘SLICE’ refers to a medication given to fish that kills sea lice and prevents them from reattaching for some period of time. Like antibiotic treatments, the medication is added to the fish feed. This medication can only be prescribed by a licensed veterinarian.
‘FW bath’ refers to a sea lice bath treatment, where fish are taken from their sea pens and placed into a large boat filled with freshwater for a few hours. This causes the sea lice to then fall off the fish. The fish are placed back into their sea pens and the lice are captured and composted in a land-based facility. The use of freshwater baths were first implemented in the Discovery Islands in 2019.
‘Hydrolicer’ refers to a mechanical sea lice treatment, where fish are removed from their sea pens and travel through a system on a boat that sprays pressurized water at the fish, and removes the lice. The fish are then placed back into their sea pens and the lice are captured and composted in a land-based facility. Hydrolicer treatments are a new method of sea lice mitigation in BC and were implemented in 2019. These treatments have been applied in the Discovery Islands farms as a successful method of lice removal.
Many novel techniques (e.g. hydrolicer, hydrogen peroxide, freshwater) to manage sea lice have been implemented in the Discovery Islands and elsewhere beginning in 2015. The adoption of alternative methods for sea lice control, and their rotational use is part of an Integrated Pest Management approach which helps to prevent the development of medication resistance and allows for improved control.
| Year | Treatment | Number of treatments |
|---|---|---|
| 2013 | SLICE © | 8 |
| Florfenicol | 3 | |
| 2014 | SLICE © | 9 |
| Florfenicol | 1 | |
| 2015 | SLICE © | 12 |
| Florfenicol | 3 | |
| 2016 | SLICE © | 9 |
| Florfenicol | 1 | |
| Hydrogen Peroxide | 3 | |
| 2017 | SLICE © | 5 |
| Florfenicol | 4 | |
| Hydrogen Peroxide | 4 | |
| 2018 | SLICE © | 6 |
| Hydrogen Peroxide | 3 | |
| 2019 | SLICE © | 6 |
| Florfenicol | 3 | |
| FW bath treatment | 3 | |
| Hydrogen Peroxide | 2 |
Benthic performance
Since 2011, 96% of marine finfish aquaculture sites monitored in the Discovery Islands were below regulatory thresholds, compared to 84% in other areas of BC.

Long description
| Year | Area | Above regulatory thresholds | Below regulatory thresholds |
|---|---|---|---|
| 2011 | Discovery | 1 | 6 |
| Rest of BC | 12 | 43 | |
| 2012 | Discovery | 0 | 11 |
| Rest of BC | 9 | 37 | |
| 2013 | Discovery | 1 | 4 |
| Rest of BC | 6 | 40 | |
| 2014 | Discovery | 0 | 3 |
| Rest of BC | 3 | 38 | |
| 2015 | Discovery | 0 | 7 |
| Rest of BC | 10 | 44 | |
| 2016 | Discovery | 0 | 6 |
| Rest of BC | 7 | 38 | |
| 2017 | Discovery | 0 | 6 |
| Rest of BC | 7 | 38 | |
| 2018 | Discovery | 0 | 5 |
| Rest of BC | 4 | 34 | |
| 2019 | Discovery | 0 | 5 |
| Rest of BC | 5 | 10 |
Conditions of Licence require industry to conduct monitoring of the sea floor at peak production to ensure that thresholds for indication of harm are not exceeded. The presence of free sulphides in sediments are monitored for soft bottom sites, and the presence of sulphide oxidizing bacteria (e.g. Beggiatoa sp.) and OPC (polychaetes) are monitored for hard bottom sites. If thresholds are exceeded, the facility may not be stocked again until further monitoring indicates that the sea floor has adequately recovered. Overall, benthic impact at farms has been decreasing, likely due to better food conversion and digestibility of feed, decreased stocking densities, and moving containment arrays further offshore in deeper water and faster currents.
| Date | Licence holder | Facility | Sea bed type | Survey results |
|---|---|---|---|---|
| 28-Mar-11 | Marine Harvest Canada | Shaw Point | Soft Substrate | 1 of 8 sediment sampling stations had chemical changes to the seabed which require additional monitoring |
| 28-Mar-13 | Marine Harvest Canada | Phillips Arm | Soft Substrate | 1 of 4 sediment sampling stations had chemical changes to the seabed which require additional monitoring |
Incidental catch and wild mortalities
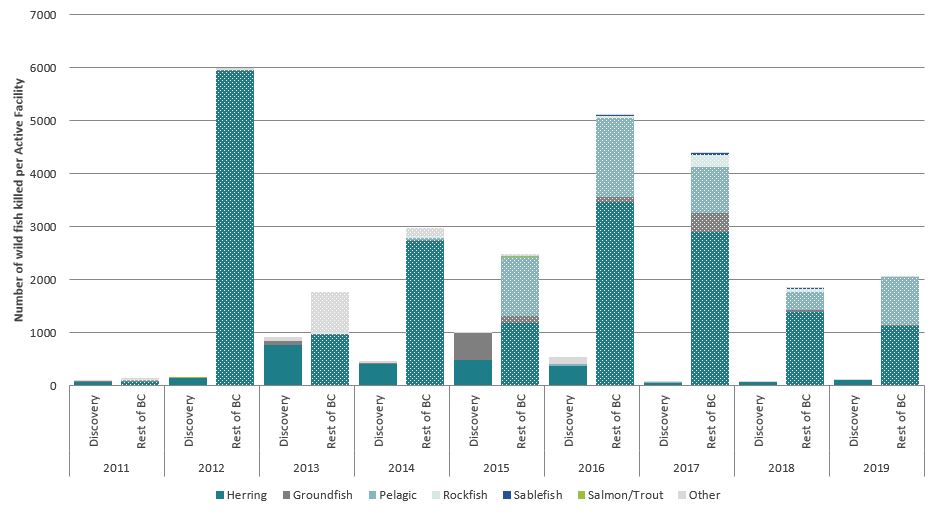
The number of wild fish killed at fish farms in the Discovery Islands is significantly lower than in other areas of British Columbia, accounting for only 2% of all dead wild fish captured at marine fish farms since 2011.
Long description
| Year | Area | Other | Groundfish | Herring | Pelagic | Rockfish | Sablefish | Salmon/ trout |
|---|---|---|---|---|---|---|---|---|
| 2011 | Discovery | 7 | 69 | 1457 | 21 | 2 | 1 | 30 |
| Rest of BC | 60 | 281 | 6376 | 1296 | 1751 | 5 | 28 | |
| 2012 | Discovery | 0 | 58 | 2000 | 44 | 0 | 43 | 19 |
| Rest of BC | 208 | 2119 | 415490 | 164 | 38 | 0 | 68 | |
| 2013 | Discovery | 655 | 549 | 6209 | 0 | 1 | 0 | 0 |
| Rest of BC | 52150 | 1546 | 66110 | 259 | 2527 | 50 | 43 | |
| 2014 | Discovery | 359 | 186 | 4230 | 0 | 1 | 2 | |
| Rest of BC | 10660 | 748 | 197423 | 2138 | 3758 | 0 | 20 | |
| 2015 | Discovery | 83 | 5009 | 4988 | 15 | 4 | 1 | 8 |
| Rest of BC | 2979 | 9474 | 88027 | 82579 | 532 | 59 | 63 | |
| 2016 | Discovery | 1464 | 136 | 4079 | 351 | 0 | 28 | 5 |
| Rest of BC | 1428 | 6278 | 242801 | 104241 | 3688 | 1139 | 20 | |
| 2017 | Discovery | 12 | 91 | 679 | 151 | 2 | 48 | 4 |
| Rest of BC | 349 | 24228 | 200582 | 59821 | 15332 | 2565 | 2 | |
| 2018 | Discovery | 16 | 23 | 798 | 5 | 8 | 5 | 2 |
| Rest of BC | 616 | 1845 | 94958 | 23487 | 3993 | 1044 | 9 | |
| 2019 | Discovery | 76 | 34 | 1411 | 11 | 4 | 0 | 0 |
| Rest of BC | 1105 | 972 | 80936 | 63587 | 437 | 124 | 6 |
‘Incidental catch’ are any wild fish that are captured as a result of aquaculture activities including harvest, transfer or net removal. Licence holders are required to report both dead and released incidental catch, but only dead fish are publicly reported.
Wild mortalities are any wild fish that died or were captured within an aquaculture facility, where the cause of death or capture cannot be directly attributed to aquaculture activities. These are fish that are brought up in routine mortality uplifts, or scooped out of pens when harvest or transfer activities are not being performed.
Licence holders are required to release all fish with least harm whenever possible. More than 70% of wild fish that are captured in aquaculture facilities are released back into the surrounding environment without harm.
DFO conducts inspections of harvest and transfer events at farm sites on an opportunistic basis. In addition, in 2018 and 2019, inspections occurred at fish processing plants to observe wild fish presence. This work ensures mitigation is followed at farms, and that wild fish are properly identified, recorded and reported to DFO.
Marine mammals
Since 2011, there have been 17 accidental drownings of marine mammals at fish farms in the Discovery Islands. Authorized fatalities are no longer allowed.

Long description
| Year | Area | California sea lion | Harbour seal | Humpback whale | Stellar sea lion | Unknown |
|---|---|---|---|---|---|---|
| 2011 | Discovery | 8 | 48 | 0 | 0 | 0 |
| Rest of BC | 224 | 22 | 0 | 2 | 0 | |
| 2012 | Discovery | 0 | 10 | 0 | 0 | 0 |
| Rest of BC | 10 | 8 | 0 | 0 | 1 | |
| 2013 | Discovery | 0 | 0 | 0 | 0 | 0 |
| Rest of BC | 4 | 3 | 1 | 0 | 0 | |
| 2014 | Discovery | 0 | 3 | 0 | 0 | 0 |
| Rest of BC | 6 | 6 | 0 | 0 | 0 | |
| 2015 | Discovery | 0 | 5 | 0 | 0 | 0 |
| Rest of BC | 25 | 12 | 0 | 0 | 0 | |
| 2016 | Discovery | 1 | 0 | 0 | 0 | 0 |
| Rest of BC | 4 | 1 | 3 | 0 | 0 | |
| 2017 | Discovery | 0 | 0 | 0 | 0 | 0 |
| Rest of BC | 0 | 2 | 0 | 0 | 0 | |
| 2018 | Discovery | 1 | 0 | 0 | 0 | 0 |
| Rest of BC | 1 | 1 | 1 | 0 | 0 | |
| 2019 | Discovery | 0 | 0 | 0 | 0 | 0 |
| Rest of BC | 0 | 0 | 0 | 0 | 0 |
Marine mammal deaths at marine fish farms have declined. Anti-predator netting, above water fencing and electric wires are effective when properly employed and maintained. As marine mammal populations grow in BC, new strategies to manage interactions with fish farms will be particularly important. These new technologies include improved net materials, non-harmful acoustic tools, and olfactory deterrents.
This graph shows the number of marine mammal fatalities per active facility at farms in the Discovery Islands and in other areas in BC.
The decrease in mortalities since 2012 coincides with the use of a new net material and with public reporting of marine mammal kills. Recently, the marine finfish aquaculture industry adopted a no-kill policy and DFO has retracted the authorization to dispatch pinnipeds.
| Facility | Licence holder | Year | Marine mammal | Interaction |
|---|---|---|---|---|
| Barnes Bay | Grieg Seafood | 2012 | Harbour seal | 1 accidental drowning |
| 2014 | Harbour seal | 3 accidental drowning | ||
| 2015 | Harbour seal | 3 accidental drowning | ||
| 2016 | California sea lion | 1 authorized fatality | ||
| 2018 | California sea lion | 1 accidental drowning | ||
| Bickley Bay | Marine Harvest Canada | 2011 | Harbour seal | 6 authorized fatalities |
| Brent Island | Cermaq Canada | 2011 | Harbour seal | 3 authorized fatalities |
| 2012 | Harbour seal | 1 authorized fatality | ||
| Brougham Point | Marine Harvest Canada | 2012 | Harbour seal | 4 accidental drowning |
| Chancellor Channel | Marine Harvest Canada | 2011 | Harbour seal | 9 authorized fatalities |
| Far Side | Marine Harvest Canada | 2011 | California sea lion | 3 authorized fatalities |
| Frederick Arm | Marine Harvest Canada | 2011 | California sea lion | 2 authorized fatalities |
| Harbour seal | 1 authorized fatality | |||
| Hardwicke | Marine Harvest Canada | 2011 | California sea lion | 1 authorized fatality |
| Harbour seal | 7 authorized fatality | |||
| Lees Bay | Marine Harvest Canada | 2011 | California sea lion | 2 authorized fatalities |
| Harbour seal | 11 authorized fatalities | |||
| Okisollo | Marine Harvest Canada | 2015 | Harbour seal | 2 accidental drownings |
| Phillips Arm | Marine Harvest Canada | 2011 | Harbour seal | 11 authorized fatalities |
| Raza Island | Mainstream Canada | 2012 | Harbour seal | 1 authorized fatality |
| Sonora Point | Marine Harvest Canada | 2012 | Harbour seal | 2 accidental drowning |
| Thurlow | Marine Harvest Canada | 2012 | Harbour seal | 1 authorized fatality |
Escapes
Between 2011- 2019, there has been only one major escape of Atlantic salmon from facilities in the Discovery Islands

Long description
| Year | Area | Atlantic | Pacific |
|---|---|---|---|
| 2011 | Discovery | 0 | 0 |
| Rest of BC | 12 | 0 | |
| 2012 | Discovery | 0 | 0 |
| Rest of BC | 8 | 2746 | |
| 2013 | Discovery | 0 | 0 |
| Rest of BC | 0 | 250 | |
| 2014 | Discovery | 0 | 0 |
| Rest of BC | 20 | 0 | |
| 2015 | Discovery | 0 | 0 |
| Rest of BC | 2 | 1 | |
| 2016 | Discovery | 0 | 0 |
| Rest of BC | 1 | 0 | |
| 2017 | Discovery | 0 | 0 |
| Rest of BC | 2 | 0 | |
| 2018 | Discovery | 0 | 0 |
| Rest of BC | 13 | 0 | |
| 2019 | Discovery | 0 | 0 |
| Rest of BC | 21031 | 0 |
This graph shows the number of escaped salmon in the Discovery Islands since 2011. There have been two significant escape events of Chinook salmon in this area. The first occurred in 2012 at an experimental semi-closed containment facility, Middle Bay, that capsized in a storm event. The second occurred during a transfer of fish from a transport truck to a vessel at Discovery Harbour. Approximately 200-300 small fish spilled off the deck of the transport vessel.
Technological improvements in containment material and anchoring systems along with more diligent inspections and maintenance of infrastructure have decreased escape events from marine finfish facilities in BC. Additionally, improvements and deployments of anti-predator technologies have reduced marine mammal interactions, which can cause damage to infrastructure leading to escapes. DFO conducts opportunistic inspections of marine finfish facilities to ensure compliance with conditions of licence aimed at preventing escapes including having and complying with an Escape Prevention and Response Plan and review of net maintenance records.
| Date | Licence holder | Facility | Species | Number of fish | Cause of escape |
|---|---|---|---|---|---|
| 12-Mar-12 | Agrimarine Industries | Middle Bay | Chinook salmon | 2745 alive | Extreme weather event, equipment failure |
| 13-Jan-13 | Grieg Seafood | n/a | Coho salmon | 250 live | Equipment failure |
| 15-Sept-17 | Cermaq Canada | Venture Point | Atlantic salmon | 5 dead | Equipment failure |
| 24-May-20 | MOWI Canada West | Shaw Point | Atlantic salmon | 1066 alive | Hole in net caused by equipment; Unexplained inventory discrepancy |
Health Management Plan (HMP) compliance
A Health Management Plan is a requirement in the marine aquaculture licence. The HMP outlines fish health and biosecurity principles which the licence holder must meet. The company develops Standard Operating Procedures (SOPs) which specify how they will meet the principles of the HMP. An review of compliance with HMP principles is conducted at every site audit, and company SOPs are reviewed annually. DI farms have slightly above industry average HMP compliance.
A total of 1034 HMP site inspections were completed between 2011 2019. All facilities are in compliance with the licence in that they have implemented an HMP; however, there may be need for improvement. The FH team performs audits on site to assess adherence to the HMP and DFO communicates any need for improvement (deficiencies) to the facility. A total number of 30,788 HMP elements were scored between 2011 2019, of these 587 deficiencies were noted . During 670 of those facility visits, no deficiencies were observed.

Long description
| Category of Deficiency | Deficiencies observed |
|---|---|
| Carcass retrieval protocol or record keeping needs improvement | 13 |
| Current licence was not posted at facility | 5 |
| Disease contingency or mass mortality information or records needs improvement | 6 |
| Fish handling, euthanasia protocol or records | 3 |
| Footbaths or sanitizers needs improvement | 7 |
| Husbandry or record keeping as per COL Appendix VIII-A or VIII-B needs improvement | 15 |
| Lice protocol or lice records as per COL Appendix VII or VII-A needs improvement | 22 |
| Mooring signage needs improvement | 12 |
| Mortality assessment or classification needs improvement | 1 |
| Nutritional or medicated feed protocol concerns | 1 |
| Training documentation is not up-to-date | 1 |
| Transfer records are not complete or up-to-date | 18 |
| Visitor protocol communication needs improvement | 0 |
| Water quality monitoring, equipment or record keeping needs improvement | 4 |
| Wild fish mortality records need clarification | 2 |
A total of 154 HMP site inspections were completed between 2011 2019 in the Discovery Islands area. All facilities are in compliance with the licence in that they have implemented an HMP; however, there may be need for improvement. The FH team performs audits on site to assess adherence to the HMP and DFO communicates any need for improvement (deficiencies) to the facility. A total number of 4903 HMP elements were scored between 2011 2019, of these 78 deficiencies were noted. During 100 of those facility visits, no deficiencies were observed.

Long description
| Category of Deficiency | Deficiencies observed |
|---|---|
| Carcass retrieval protocol or record keeping needs improvement | 5 |
| Current licence was not posted at facility | 4 |
| Disease contingency or Mass mortality information or records needs improvement | 5 |
| Fish handling, euthanasia protocol or records | 3 |
| Footbaths or sanitizers needs improvement | 7 |
| Husbandry or record keeping as per COL Appendix VIII-A or VIII-B needs improvement | 2 |
| Lice protocol or lice records as per COL Appendix VII or VII-A needs improvement | 21 |
| Mooring signage needs improvement | 11 |
| Mortality assessment or classification needs improvement | 0 |
| Nutritional or medicated feed protocol concerns | 1 |
| Training documentation is not up-to-date | 1 |
| Transfer records are not complete or up-to-date | 15 |
| Visitor protocol communication needs improvement | 0 |
| Water quality monitoring, equipment or record keeping needs improvement | 1 |
| Wild fish mortality records need clarification | 2 |
The Health Management Plan (HMP) is a section of the licence which outlines broadly fish health management principles and practices which are necessary to ensure optimal fish health and welfare. The Licence Holders (LHs) are then required to develop and implement Standard Operating Procedures (SOPs) which will dictate how the elements of the HMP are practically met by the LH on site. The LH may choose to meet a given condition of the HMP in any way they choose provided which is reasonable and biologically sound. The SOPs are submitted to DFO annually, along with any changes for review by fish health staff.
During a fish health audit, DFO biologists and veterinarians assess over 60 HMP elements using a standardized checklist. This is in addition to many other aspects of fish health and husbandry which are part of the licence conditions. Any deficiencies noted are recorded and relayed to site staff with an expectation for timely resolution. Past HMP deficiencies are noted during future audits of that facility to ensure they have been resolved. A letter is issued quarterly to each LH outlining the results of these HMP inspections. Any non-compliance with a licence condition identified during an audit will be recorded and relayed to DFO veterinary staff. DFO veterinarians will assess the risk posed by the non-compliance and determine if referral to Conservation and Protection branch for possible prosecution is warranted. At minimum, a letter of non-compliance will be issued with a timeline provided for resolving the non-compliance. These non-compliance letters are legally enforceable and inform the compliance history of the facility and LH. This has significant implications for third party sustainability certifications, and any request for production increases by the facility and/or LH.
Conclusion
The farms in the Discovery Islands are generally very well performing across almost every metric. The area appears to be very conducive to growing fish well, with minimal inputs and interventions as are seen in some other growing areas. The good fish health and sea lice management seen on the DI farms ensures that the risk of disease and pest transfer to wild fish is minimized.
Appendix I: Marine finfish aquaculture public reporting in British Columbia
- Aquaculture Activities Regulations (AAR) Drugs and Pesticides
- Monthly mortality by category, by facility (open data)
- Quarterly Average mortality by category, by zone (figure)
- Fish Health monitoring activities, number of carcasses sampled
- Fish health, sea lice and benthic audits (figures)
- Fish health events, by facility, 2016-ongoing (open data)
- Fish health events, 2016-ongoing (figures)
- Mortality events, by facility, 2011-ongoing (open data)
- Mortality events, 2016-ongoing (figures)
- Fish Health audits, by facility, 2011-ongoing (open data)
- Monthly sea lice abundance, by facility (open data)
- DFO sea lice audits, by facility (open data)
- Average sea lice abundance, by zone (graph)
- Use of Antibacterials (graph)
- Use of Anti-lice Therapeutants (graph)
- DFO benthic audits, by facility (open data)
- Industry benthic monitoring, by facility (open data)
- Benthic performance (graph)
- Incidental catch, by facility (open data)
- Marine mammal fatalities, by year (graph)
- Marine mammal interactions, by facility (open data)
- Escapes, by facility, 2011-ongoing (open data)
- Escapes, by year (graph)
- Atlantic Salmon Watch Program (open data)
- Salmon transfers, 2015-ongoing (open data)
- Date modified: