
Habitat Highlight: Addressing the acidification of watersheds in Nova Scotia
This Habitat Highlight explains acidification and its impacts on fish and fish habitat in Nova Scotia.
On this page
- What is acidification?
- How does acidification impact aquatic species?
- Acidification in Nova Scotia
- Management actions to address acidification in Nova Scotia watersheds
- Partnerships to address acidification in Nova Scotia watersheds
- Nova Scotia Salmon Association West River-Sheet Harbour limiting
- St. Mary's River Association Barren Brook limiting
- References
What is acidification?
The pH scale is used to measure acidity and alkalinity. Neutral substances are 7.0 on the pH scale. The lower the pH of a substance, the more acidic it is. Normal rain has a pH about 5.6 – the slight acidity is from carbon dioxide from the atmosphere dissolved in water which produces a weak acid. The pH of acid rain is generally between 4.2 and 4.4Footnote 1.
The pH of a watercourse (e.g., rivers, streams and lakes) is influenced both by acidic inputs (for example, like acid rain or acid drainage) and the ability of the system to neutralize acid, also called buffering capacity.
Acid rain
Acid deposition, more commonly called “acid rain”, is precipitation (for example, rain, snow or fog) that contains acidic components. Sulphur dioxide and nitrogen oxides are the 2 main pollutants that form acid rain. Sulphur dioxide and nitrogen oxides can come from natural sources, such as volcanoes. However, the majority is released into the atmosphere by burning fossil fuels to generate electricity, in vehicles and heavy equipment, and during manufacturing or other industrial processesFootnote 1. In addition to contributing to the acidification of aquatic environments, acid rain can lead to aluminium and other metals being leached from soils into adjacent aquatic areas.
Significant progress has been made internationally on reducing emissions through domestic regulations and international agreements. For example, emissions of sulphur dioxide in Canada decreased 69% between 1990 and 2017Footnote 2.
Acid drainage
Various land use activities can contribute to the acidification of surface water, including runoff from quarries, highway construction and urban development. These types of acid inputs are referred to as acid drainage and are caused by oxidation of sulphur-rich mineralsFootnote 3.
Buffering capacity
Buffering capacity is a measure of the ability of a stream or river to neutralize acidityFootnote 4. The underlying geology of an area, as well as local soil type, influences how much the input of acid will impact a particular area. Some soil types can buffer acid rain by neutralizing acidity in rainwater as it flows through. However, areas where the soil is thin and/or lacks the ability to neutralize acid in rainwater are particularly vulnerable to acid rainFootnote 1. In areas where there is plenty of limestone rock, lakes are better able to neutralize acid. In areas where rock is mostly granite, the lakes cannot neutralize acid. Unfortunately, much of eastern Canada - where most of the acid rain falls - has a lot of granite rock and therefore a very low capacity for neutralizing acids.
How does acidification impact aquatic species?
Acidification of freshwater ecosystems impacts both aquatic and terrestrial productivity through the direct impacts of decreasing pH. Water’s pH level is a limiting factor for many aquatic organisms. Many species can only tolerate a specific pH range for optimal growth and reproductionFootnote 4. As the pH of waterbodies declines, fewer fish species and other aquatic life, like invertebrates, can survive. Acidification also leads to reductions in key nutrients and increases the movement of metals, such as aluminum, cadmium and lead which can be toxicFootnote 3.
Impacts of acidification on Atlantic salmon
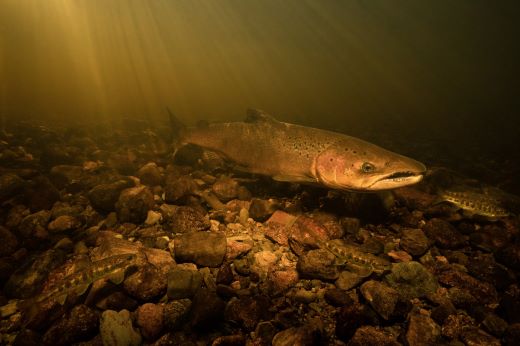
Acidification is of particular concern to Atlantic salmon in Nova Scotia, with the largest impacts being within the Southern Upland region. The Committee on the Status of Endangered Wildlife in Canada (COSEWIC) reported that 22% of rivers in this area are acidified (pH below 4.7) and have lost populations of salmon, while a further 31% of rivers are moderately impacted (pH between 4.7 and 5.0) and maintain small populationsFootnote 5.
Atlantic salmon’s ability to tolerate acid conditions is dependent on life stage, with fry and smolt being the most sensitive. Mortality of fry (19 to 71%) and smolts (1 to 5%) occurs when the pH is below 5.0. When pH declines to the range of 4.6 to 4.7, mortality of parr and smolts is relatively high (72 to 100%). Eggs and alevins experience lethal effects at pH below 4.8Footnote 5.
When water has a pH below 5.0, normal processes are disturbed. Water and molecules (including sodium and chloride) can't move to and from Atlantic salmon and the surrounding water. This can lead to impacts on the circulatory system, which can cause deathFootnote 5.
Increased aluminum concentrations related to acid rain can also be toxic to fish species like Atlantic salmon Footnote 6. The local extirpation, or loss, of Atlantic salmon populations in rivers in Scandinavia, the eastern United States and Nova Scotia has been attributed to many factors, including increased aluminum concentrationsFootnote 7.
Acidification in Nova Scotia
In the 1970s, scientists began to link ecosystem impacts to acid rain. Nova Scotia was particularly vulnerable to acid rain due to its geographic location in relation to areas of higher industrial emissions, with pollutants traveling long distances from their sources by prevailing windsFootnote 2. The province was heavily impacted by sulfur deposition, which primarily came from coal burning in central Canada and the northeastern U.S. It has been estimated that almost half of all rivers in Nova Scotia were severely affected by acid rain through the 1970s and 1980sFootnote 8.
While many areas across Canada saw a decrease in the acidification of freshwater areas following the decrease in emissions in the 1990s, these decreases have not been observed in Nova ScotiaFootnote 9. As of 2007, while Atlantic Canada was receiving some of the lowest acid rain amounts in eastern North America, parts of the region have some of the most acidic surface water on the continentFootnote 10. This chronic acidification is due to a combination of historic acid rain, ongoing acid rock drainage, natural acid inputs from abundant wetlands and poor buffering or acid neutralization capacity due to local bedrock and soilsFootnote 10;Footnote 9.
The Halifax Formation, which is found throughout the southern mainland of Nova Scotia from Yarmouth to Canso, is composed of pyritic slate bedrock. When this slate is exposed to water and oxygen, such as during construction activities, a chemical oxidation process can occur that releases metal oxides and sulphuric acid which can then drain into streams and lakesFootnote 3;Footnote 11. The map below, which is adapted from the Nova Scotia Watershed Assessment ProgramFootnote 12, shows the level of acid rock drainage potential across the province.
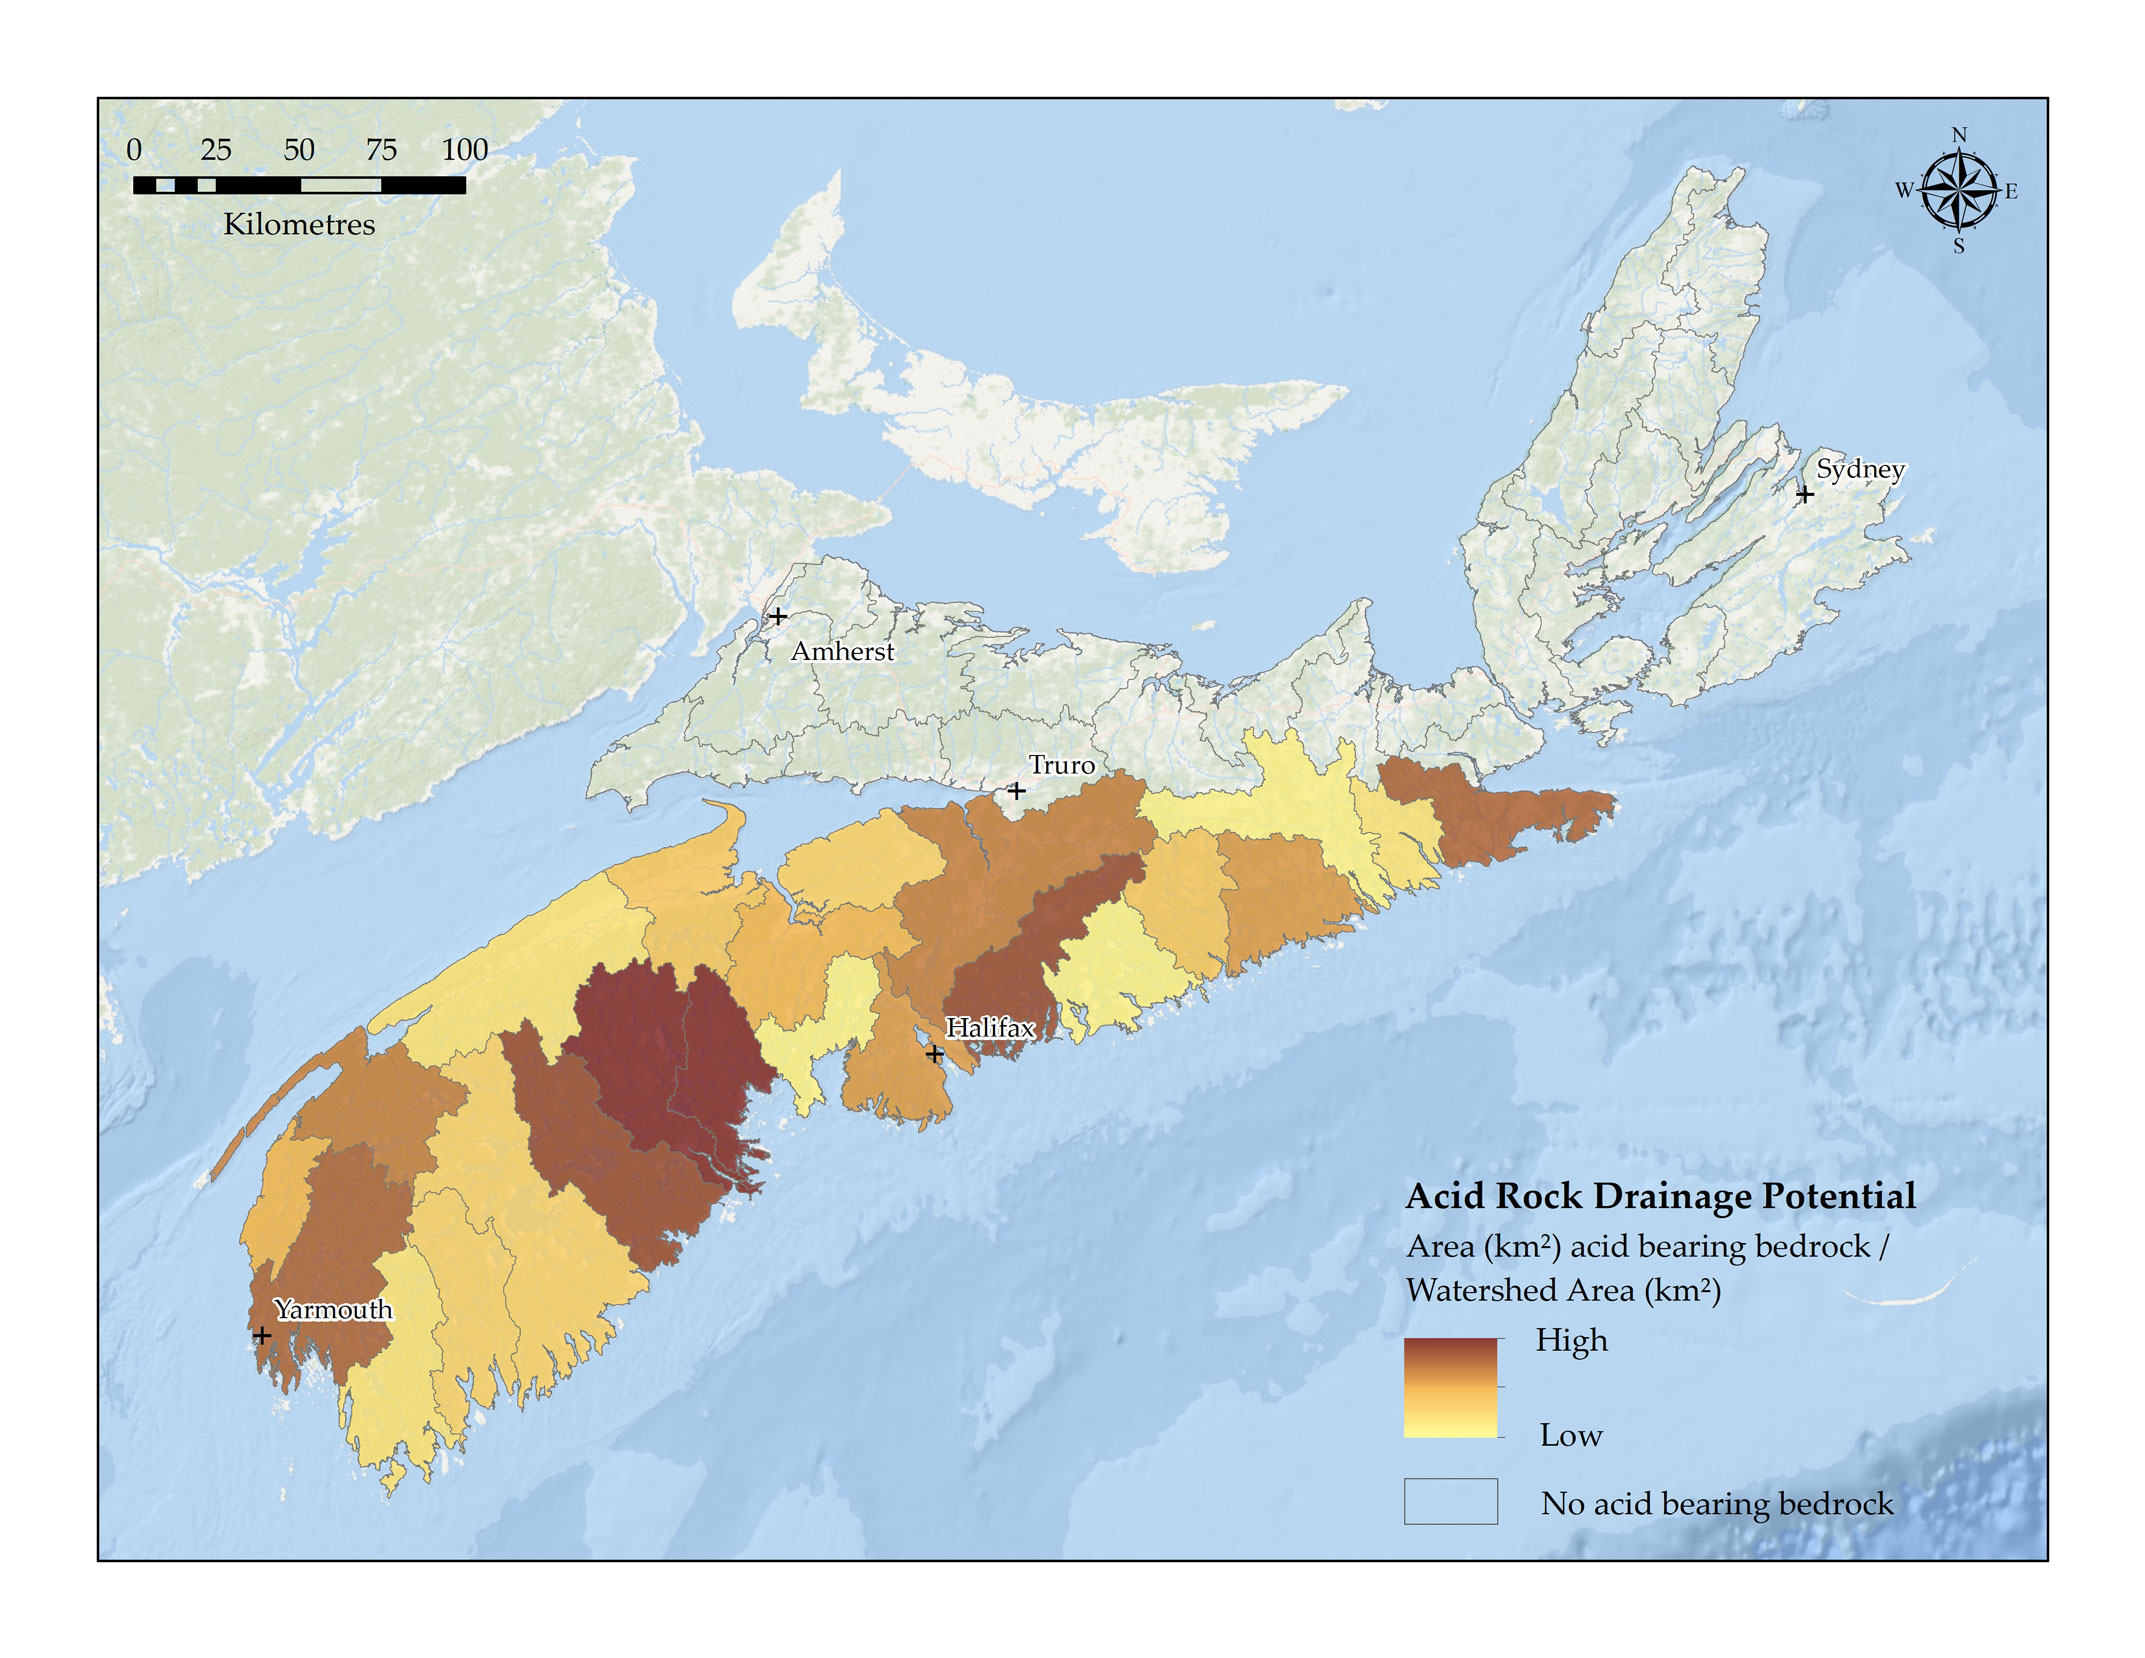
Acid rock drainage potential (area (km2 of potentially exposed acid rock/watershed area (km2) in Nova Scotia – Text version and data sources
Data sources and methods
The acid rock drainage map developed for this report depicts the amount of acid bearing rock in each primary watershed, normalized by the total area of each watershed. Information from the NS Department of Natural Resources (NSDNR) was used to complete this analysis. The information was used to calculate total areas of bedrock in NS watersheds that contain acid bearing rock.
White and Goodwin Footnote 14 completed mapping of bedrock acid rock drainage (ARD) potential in southwest Nova Scotia, ranging from low to high risk of ARD. Areas of high and moderate risk of ARD were extracted from the GIS layers published from this work.
For the remainder of the primary watersheds not captured by this mapping, bedrock geology mapping from NSDNR was utilized to include mapped areas that are included in the Halifax Formation bedrock type. The Halifax Formation, which is found throughout the southern mainland of Nova Scotia from Yarmouth to Canso, is composed of pyritic slate bedrock. When this slate is exposed to water and oxygen, such as during construction activities, a chemical oxidation process can occur that releases metal oxides and sulphuric acid which can then drain into streams and lakes Footnote 3; Footnote 11.
For more a more detailed explanation of the methods used, refer to the Fish and Fish Habitat Report for Nova Scotia: Summary of the threat analysis prepared to support reporting by the Fish and Fish Habitat Protection Program - Maritimes Region (1,801 KB).
| Primary watershed | Acid rock drainage potential (area (km2 of potentially exposed acid rock / watershed area (km2) |
|---|---|
Annapolis |
0.047 |
Barrington / Clyde |
0.057 |
Cheticamp River |
0 |
Clam Harbour / St. Francis |
0 |
Country Harbour |
0.045 |
East / Indian River |
0.035 |
East / Middle / West (Pictou) |
0 |
East / West (Sheet Harbour) |
0.083 |
Economy |
0 |
French |
0 |
Gaspereau |
0.097 |
Gold |
0.290 |
Grand |
0 |
Herring Cove / Medway |
0.277 |
Indian |
0 |
Isle Madame |
0 |
Kelly / Maccan / Hebert |
0 |
Kennetcook |
0.069 |
LaHave |
0.372 |
Liscomb |
0.139 |
Margaree |
0 |
Mersey |
0.078 |
Meteghan |
0.116 |
Missaguash |
0 |
Musquodoboit |
0.201 |
New Harbour / Salmon |
0.192 |
North / Baddeck / Middle |
0 |
Parrsboro |
0 |
Philip / Wallace |
0 |
River Denys / Big |
0 |
River Inhabitants |
0 |
River John |
0 |
Roseway / Sable / Jordan |
0.058 |
Sackville |
0.124 |
Salmon / Debert |
0 |
Salmon / Mira |
0 |
Shubenacadie / Stewiacke |
0.144 |
Sissiboo / Bear |
0.154 |
South / West |
0 |
St. Croix |
0.098 |
St. Mary’s |
0.022 |
Tangier |
0.042 |
Tidnish / Shinimicas |
0 |
Tracadie |
0 |
Tusket River |
0.168 |
Wreck Cove |
0 |
Data source for base map
General Bathymetric Chart of the Oceans GEBCO_08 Grid, National Oceanic and Atmospheric Administration, National Geographic, Garmin, HERE, Geonames.org, and Esri.
A stream’s buffering capacity is influenced by the soil and bedrock the water passes through. The buffering capacity will be low where a stream passes through granite-based soils, while the buffering capacity will be high where a stream passes through limestone-based soilsFootnote 4. Areas with granite and metamorphic bedrock have waters with low levels of conductivity, meaning they are low in dissolved solids. These waters, therefore, have little or no buffering capacity as they have few ions to buffer acidic inputs. It has been estimated that more than 75% of lakes in Nova Scotia have granite or metamorphic bedrockFootnote 3. Alternately, the acidity of water is moderated in areas with higher buffering capacity, such as areas with high concentrations of limestone and the associated presence of calcium carbonate and magnesiumFootnote 3.
Using data from the Nature Conservancy of Canada’s Stream Classification for the Northern Appalachian-Acadian Region of Canada, an analysis was completed to predict the buffering capacity of watersheds in Nova Scotia using several variables based on various soil characteristicsFootnote 4. The buffering capacity is measured as the average mg/L of calcium carbonate in a watershed. Darker colours indicate watersheds with a lower buffering capacity (Herring Cove/Medway, Roseway/Sable/Jordan, Mersey, Meteghan and Gold), while lighter colours are indicative of streams with a higher buffering capacity (Tidnish/Shinimicas, Missaguash, River John, Gaspereau and Cheticamp). Overall, the watersheds of southwestern Nova Scotia have the lowest buffering capacity.
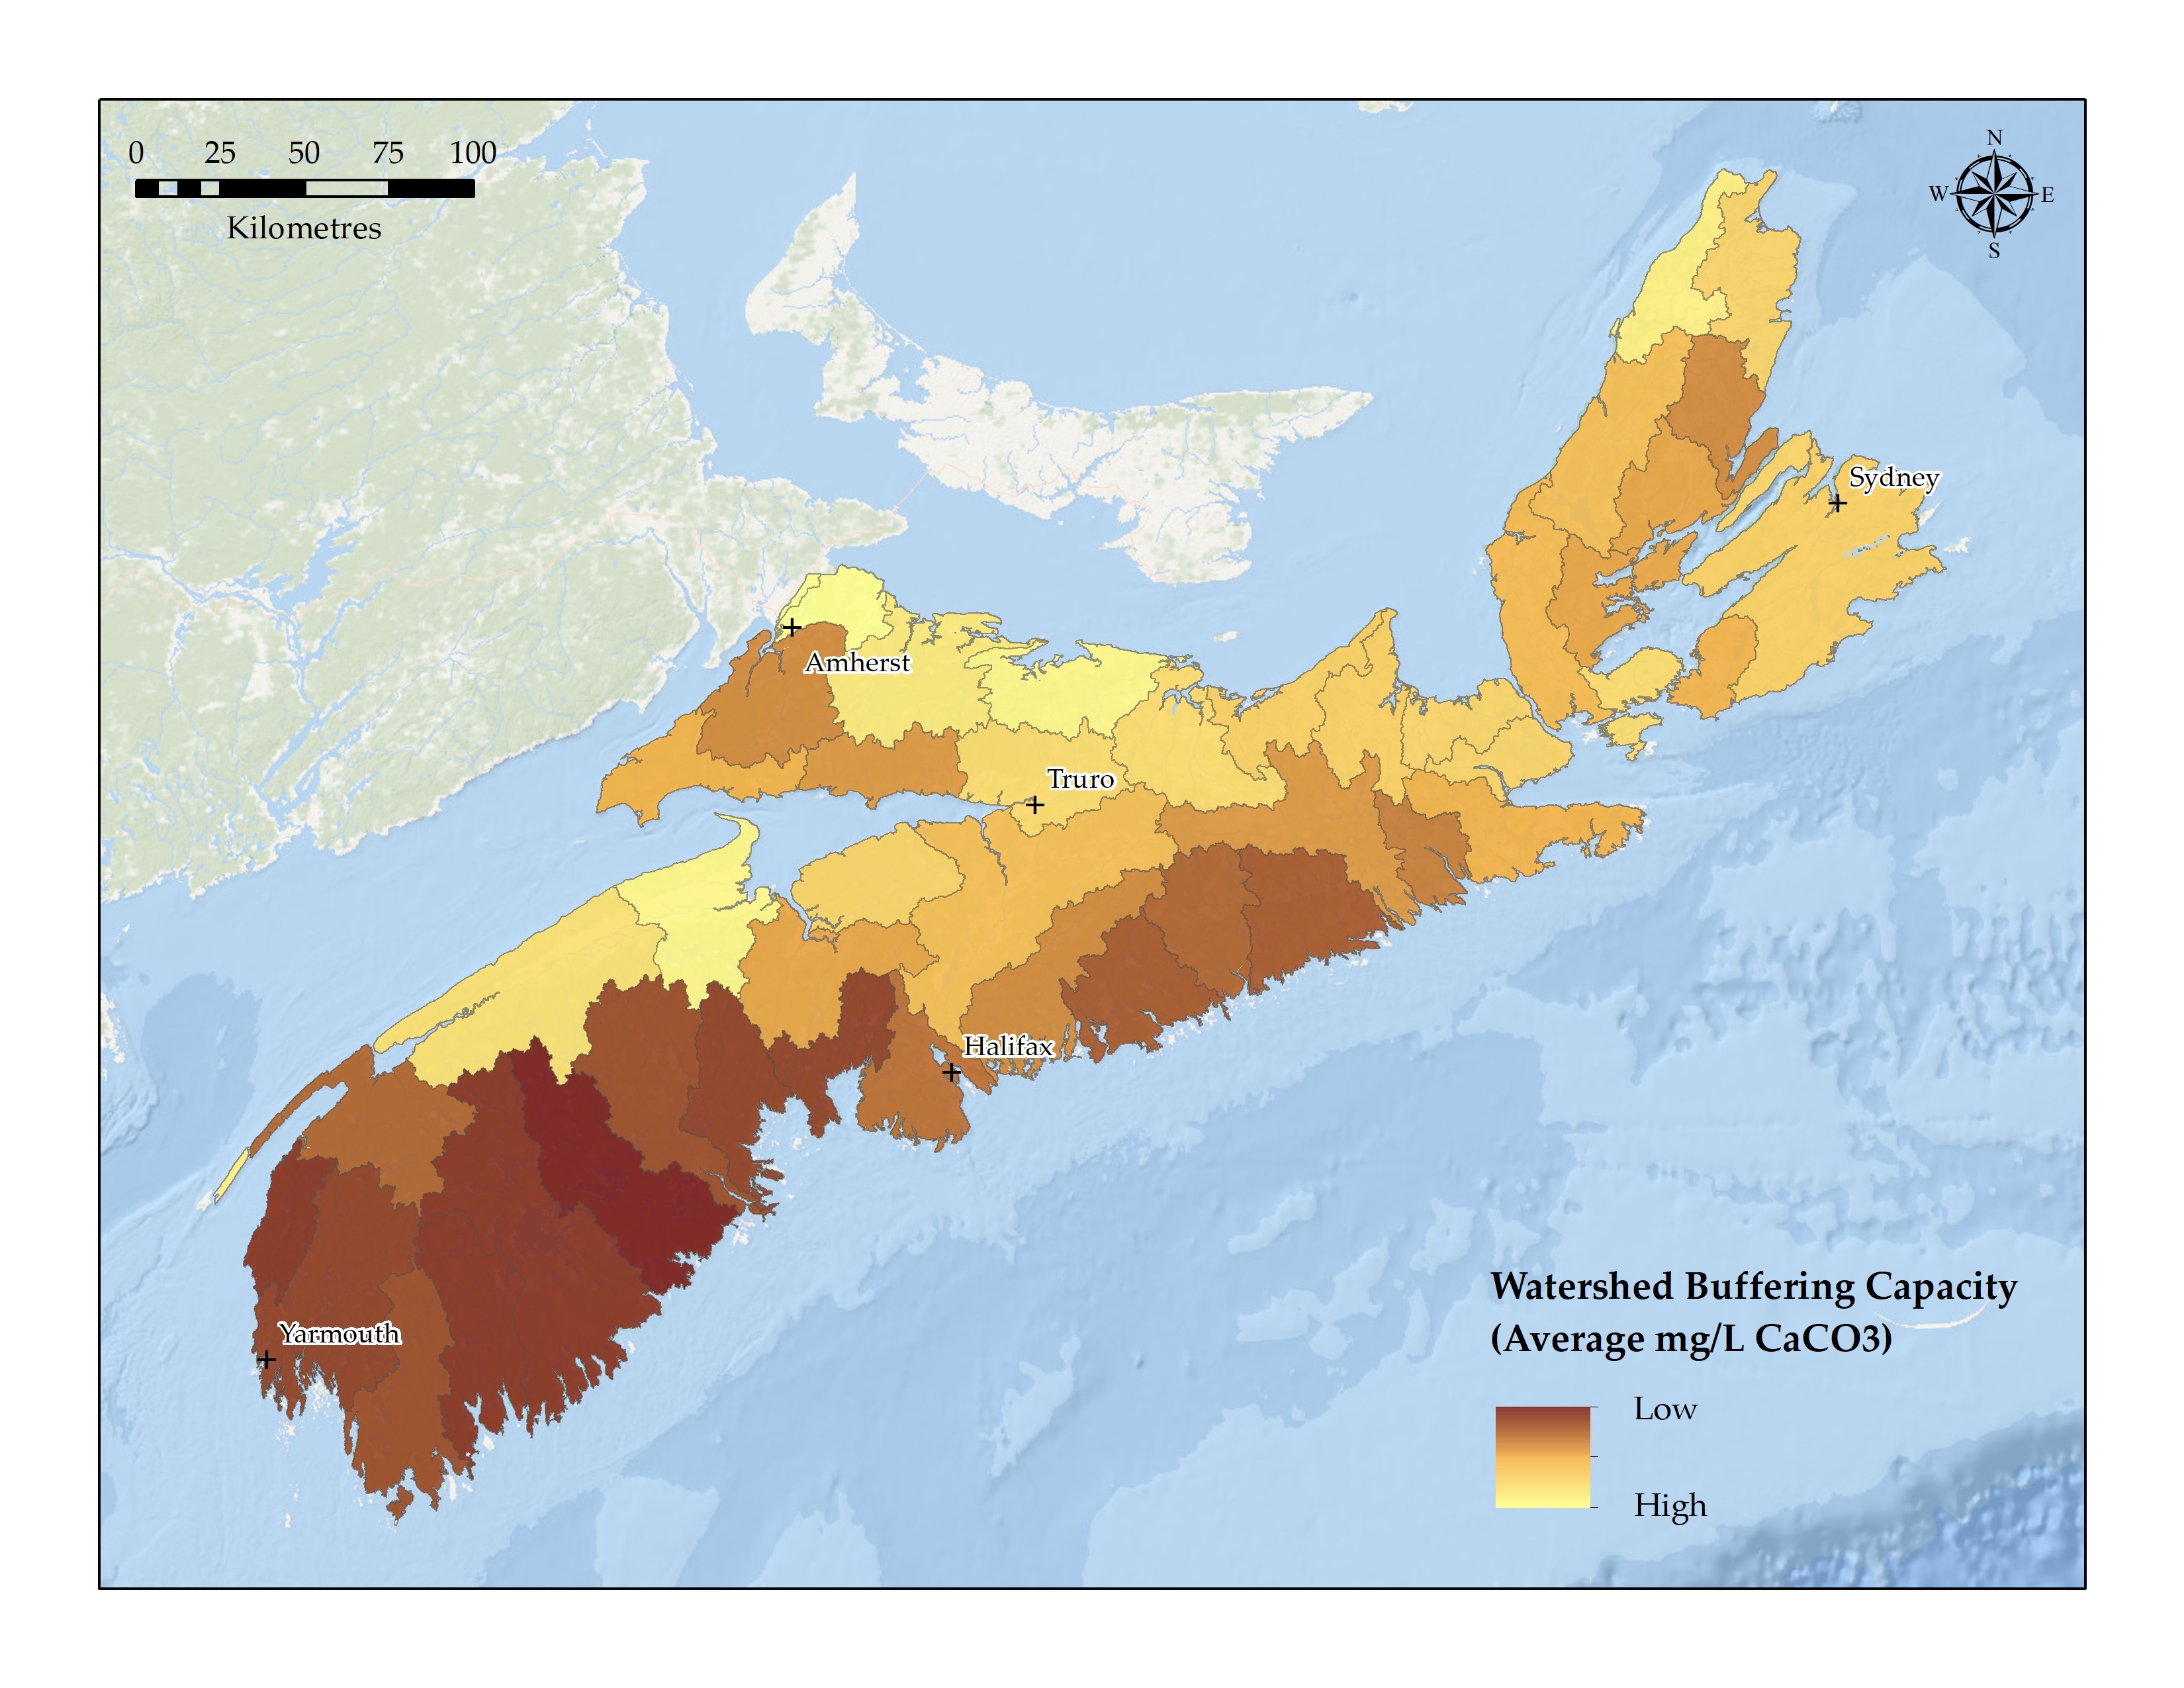
Watershed buffering capacity (average mg/L of calcium carbonate (CaCO3)) in Nova Scotia – Text version and data sources
Data sources and methods
The watershed buffering capacity (i.e., alkalinity) map was produced using data from the Nature Conservancy of Canada’s (NCC) Stream Classification for the Northern Appalachian–Acadian Region of Canada Footnote 4. Using various sources of in-stream field measurements of alkalinity throughout Nova Scotia, Millar et al. made use of a Random Forest statistical packageFootnote 13 with predictor variables to extrapolate the observed alkalinity measurements throughout their study area. A total of 13 predictor variables were used based on various soil characteristics (e.g., soil surface cation exchange capacity, pH), as the buffering capacity of streams is heavily influenced by the soil and bedrock of the areaFootnote 4.
For the primary watershed scale mapping, the NCC stream classification product was first converted from a vector format into a raster in ArcGIS Desktop software, in which cell values were based on the buffering capacity values (mg/L of calcium carbonate (CaCO3)) assigned to the stream networks. This step was necessary to account for the length of stream assigned a given buffering capacity value within a watershed. The Spatial Analyst Zonal Statistics tool was then used to calculate the mean average buffering capacity values of all streams for each primary watershed of Nova Scotia. The final map product presents the spatial distribution of watershed buffering capacity using a 23 class quantile classification, in which each class contains 2 watersheds. For example, the 2 watersheds with the lowest average buffering capacity are in the first class. The 2 watersheds with the highest average buffering capacity are in the last class. Darker colours indicate watersheds with a lower buffering capacity, while lighter colours are indicative of streams with a higher buffering capacity.
| Primary watershed | Buffering capacity (mg/L calcium carbonate (CaCO3)) |
|---|---|
Annapolis |
16.27 |
Barrington / Clyde |
4.58 |
Cheticamp River |
19.02 |
Clam Harbour / St. Francis |
14.18 |
Country Harbour |
8.19 |
East / Indian River |
4.34 |
East / Middle / West (Pictou) |
15.09 |
East / West (Sheet Harbour) |
5.63 |
Economy |
9.73 |
French |
14.14 |
Gaspereau |
22.40 |
Gold |
4.30 |
Grand |
12.57 |
Herring Cove / Medway |
3.09 |
Indian |
9.01 |
Isle Madame |
15.10 |
Kelly / Maccan / Hebert |
9.33 |
Kennetcook |
14.87 |
LaHave |
4.95 |
Liscomb |
5.41 |
Margaree |
12.29 |
Mersey |
3.21 |
Meteghan |
3.59 |
Missaguash |
34.55 |
Musquodoboit |
9.09 |
New Harbour / Salmon |
10.30 |
North / Baddeck / Middle |
9.99 |
Parrsboro |
10.87 |
Philip / Wallace |
17.30 |
River Denys / Big |
10.22 |
River Inhabitants |
11.66 |
River John |
23.93 |
Roseway / Sable / Jordan |
3.16 |
Sackville |
6.07 |
Salmon / Debert |
15.87 |
Salmon / Mira |
14.15 |
Shubenacadie / Stewiacke |
13.64 |
Sissiboo / Bear |
6.17 |
South / West |
14.14 |
St. Croix |
9.84 |
St. Mary’s |
9.56 |
Tangier |
5.22 |
Tidnish / Shinimicas |
35.16 |
Tracadie |
14.18 |
Tusket River |
4.35 |
Wreck Cove |
14.22 |
Data source for base map
General Bathymetric Chart of the Oceans GEBCO_08 Grid, National Oceanic and Atmospheric Administration, National Geographic, Garmin, HERE, Geonames.org, and Esri.
While this map provides an overall picture of the watersheds that may be most impacted by acidification due to a limited buffering capacity, future assessment and modelling would be improved through the incorporation of more broad scale field surveys of freshwater acidification levels across Nova Scotia over a longer time period.
Management actions to address acidification in Nova Scotia watersheds
Regulatory tools
The best approach to managing acid rock drainage is to avoid its development by knowing the location of sulphide-bearing bedrock and avoiding activities that expose or break it up. If disturbance is unavoidable, the Sulphide Bearing Material Disposal Regulations, under the Nova Scotia Environment Act outline how materials with sulphide content are to be managed. For more information on the management of acid rock drainage in Nova Scotia, refer to the Nova Scotia Department of Natural Resources and Renewables.
Restoration
Acid rain has decreased since emission cuts in the early 1990s. However, many areas of Nova Scotia have not seen improvements in water quality. It has been predicted that it may take more than 50 years for water quality to recover naturally from the impacts of acid rainFootnote 8;Footnote 9.
The only long-term mitigation for acidification is the addition of buffering materials to these freshwater environments to offset the acidic inputs and improve water quality. The addition of buffering materials is done through limingFootnote 9. There are different techniques that can be used for liming. Lime dosers are used to add powdered limestone or a slurry limestone mixture directly to streams and rivers. They can treat relatively large quantities of water with relatively low cost, but require ongoing maintenance. An alternate approach is terrestrial or catchment liming, in which powdered limestone is spread on areas of a watershed to increase soil pH and ultimately increase the pH of rivers and streams. This approach can have long-lasting benefits. However, the initial application cost can be high because lime is often spread with helicopters.
The province of Nova Scotia, in collaboration with academic and non-governmental partners, has produced a guide for terrestrial liming in southwestern Nova Scotia (1,935 KB).
Partnerships to address acidification in Nova Scotia watersheds
DFO is supporting partners in using novel solutions to address the threat posed by acidification to native fish species, particularly Atlantic salmon.
Nova Scotia Salmon Association West River-Sheet Harbour liming
The Nova Scotia Salmon Association (NSSA) has been carrying out liming in the West River-Sheet Harbour since 2005 when the first lime doser was installed in the upper watershed. In collaboration with a number of partners and with funding support from the Coastal Restoration Fund and the Canada Nature Fund for Aquatic Species at Risk, the NSSA has continued to build their expertise in liming techniques. A second lime doser was installed on the Killag River in 2016, which uses wind and solar energy to supply limestone to the river. The NSSA is also carrying out catchment liming, using helicopters to apply lime to forest soils within Keef and Tent brooks. An important component of these projects is ongoing monitoring of both water quality and Atlantic salmon populations. This monitoring has shown that the pH is lower at untreated sites than in the treatment area of the lime doser, indicating that the doser is continuing to buffer against the negative effects of acid rain. Data collected by NSSA suggests that Atlantic salmon smolt production has increased in areas treated with lime.
St. Mary’s River Association Barren Brook liming
The St. Mary’s River Association, with support from the Coastal Restoration Fund, is conducting catchment liming in Barren Brook, an acid-impacted tributary of the West Branch of the St. Mary’s River. Agricultural lime is being applied using helicopters and a lime spreader. This area contains suitable Atlantic salmon spawning and rearing habitat, and was selected to support salmon recovery efforts in the watershed. Part of the project includes ongoing monitoring of the area and early water chemistry tests have shown an improvement in pH levels in the treated areas.
- Date modified: