
Rebuilding plan for witch flounder (Glyptocephalus cynoglossus) NAFO Divisions 2J3KL
Foreword

(Glyptocephalus cynoglossus)
Fisheries and Oceans Canada (DFO) has developed “A Fisheries Decision-Making Framework Incorporating the Precautionary Approach” (PA Framework) policy under the auspices of the Sustainable Fisheries Framework. It outlines the departmental methodology for applying the precautionary approach (PA) to Canadian fisheries. A key component of the PA Framework requires that when a stock has reached or fallen below a limit reference point (LRP), a rebuilding plan must be put in place with the aim of having a high probability of the stock growing above the LRP within a reasonable timeframe.
The purpose of this rebuilding plan is to identify stock rebuilding objectives for Witch flounder in Northwest Atlantic Fisheries Organization (NAFO) Divisions 2J3KL, as well as the management measures that will be used to achieve these objectives. This document also serves to communicate basic information about the 2J3KL Witch flounder stock and its management to DFO staff, Indigenous groups, and other fishery interests. This plan provides a common understanding of the basic “rules” for rebuilding this stock. The harvest strategy and decision rules outlined in this plan are applicable when the stock is in the Critical zone and below 50 per cent of the Upper Stock Reference Point (USR), or until an evaluation is triggered or an updated plan is completed (refer to Section 12). Once the stock grows and remains consistently above 50% of the USR, the stock will be managed through the standard Integrated Fisheries Management Plan (IFMP) process. Management measures outlined in this rebuilding plan are mandatory, and may be modified to include additional catch restrictions if they fail to result in stock rebuilding.
This rebuilding plan is not a legally binding instrument which can form the basis of a legal challenge. The plan can be modified at any time and does not fetter the Minister's discretionary powers set out in the Fisheries Act. The Minister can, for reasons of conservation or for any other valid reasons, modify any provision of the rebuilding plan in accordance with the powers granted pursuant to the Fisheries Act.
Where DFO is responsible for implementing a rebuilding plan in an area under a land claim agreement, the rebuilding plan will be implemented in a manner consistent with that agreement.
Tony Blanchard
Regional Director General
Newfoundland and Labrador Region
Preamble
In 2019, a new 2+3KLMNO Groundfish IFMP was developed by DFO and the 2+3KLMNO Groundfish Advisory Committee. The IFMP was updated in 2020 and contains information pertaining to the 2J3KL Witch flounder stock. It will be referenced throughout this document and can be found online.
The last scientific assessment for the Witch flounder stock in NAFO Divisions 2J3KL was completed by DFO Science in May 2018 (SAR 2018/053). Outcomes from the application of this rebuilding plan will be reviewed periodically to determine if changes to the plan might be required (refer to Section 12).
1. Biological synopsis
Species biology
Witch flounder (Glyptocephalus cynoglossus) is a long lived, right-eye flounder found in the western Atlantic that extends from Labrador to North Carolina. In 2J3KL, individuals have been aged to over 30 years old, but the number of age groups in this area was substantially reduced from the mid-1970s to early-1980s, with fish older than 15 years rarely seen in the survey or fishery catch from the early-1980s to the early-1990s. No aging information is available for this species on the Newfoundland and Labrador Shelves after 1993.
Witch flounder form dense spawning aggregations, with spawning in the Northwest Atlantic occurring over a prolonged period from March through to September. The highest intensity spawning in the 2J3KL stock is considered to occur from March to May, across widespread areas of the Northeast Newfoundland shelf and northern Grand Bank. Eggs are pelagic, and following hatching larvae may remain pelagic for up to one year, with the main drift of eggs and larvae occurring north to south.
Population and distribution
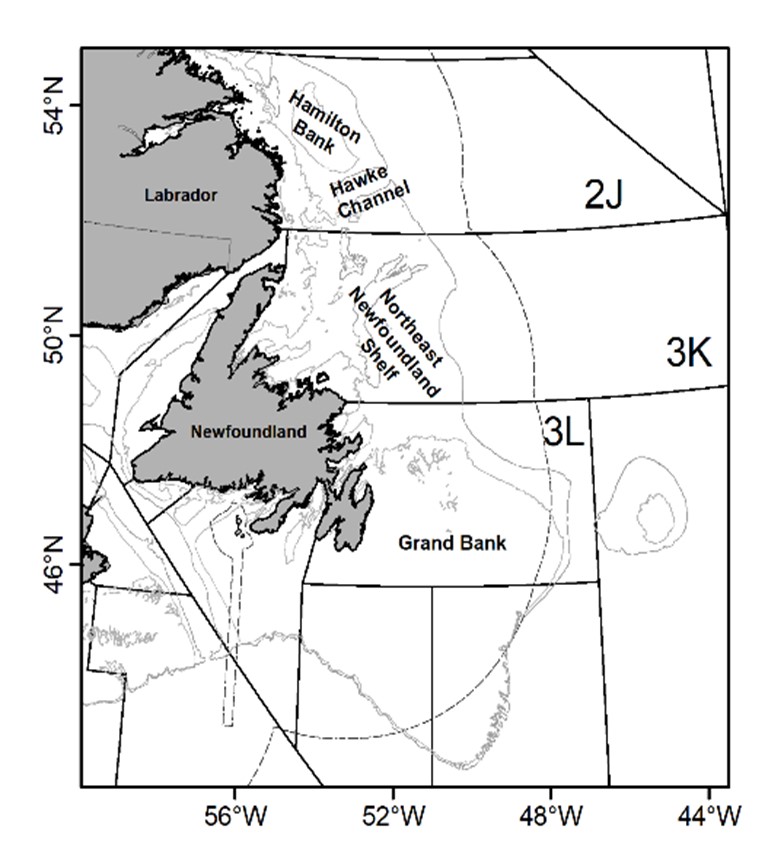
Witch flounder is a deep-water flatfish found in the North Atlantic Ocean. The species reaches its northern limit of distribution in the Northwest Atlantic near Hamilton Bank off Labrador, and extends to the east coast of the southern United States of America. Witch flounder stocks found in Canadian waters include those in NAFO Divisions 4RST (Gulf of St. Lawrence), Sub-Division 3Ps (off the south coast of Newfoundland and around St. Pierre Bank), Divisions 3NO (southern Grand Banks), and Divisions 2J3KL (south coast of Labrador to the northern Grand Banks). The stock area for Witch flounder in NAFO Divisions 2J3KL is shown in Figure 1. This stock is mainly distributed along the shelf edge and in deeper channels around the banks, primarily in Division 3K.
Habitat requirements
Witch flounder are most commonly associated with shelf slope waters and deeper channels, but are present at a wide range of depths, from <100 m to well over 1,000 m. This species prefers soft substrates such as sand, clay, or mud.
Historically, this stock was distributed along the shelf edge and in deep channels, and to a lesser extent onto the banks of the Northeast Newfoundland Shelf and the northern Grand Bank. Following the decline of the stock through the late-1980s to early-1990s, the stock was largely restricted to the shelf edge, showing a preference for deeper water relative to the previous period. Historical changes in depth associations in this stock appear to have been at least partially driven by water temperature associations. Associations were highest for water temperatures averaging around 3.2 to 3.6°C, although Witch flounder can occupy a broad range of temperatures. Generally, this stock has occupied deeper waters towards the northern extent of its range.
Recently, with increases in indices of biomass and abundance, the distribution of survey biomass has been expanding back into the deep channels occupied prior to the early-1990s, and onto areas of the banks.
Ecosystem interactions
Witch flounder mostly rely on benthic invertebrate organisms as a food source. Stomach content samples collected between 2015 and 2019 show amphipods and polychaetes as the main food items for fish smaller than 25cm length, and polychaetes becoming the dominant prey in the stomachs of larger individuals. This is supported by at sea observations across the DFO fall multispecies survey time series identifying polychaetes as the most commonly observed dominant prey item. Other prey items included bivalves and brittle/basket stars.
This stock extends across two ecosystem production units on the Newfoundland and Labrador Shelves bioregion: the Newfoundland shelf (2J3K) and the Grand Bank (3LNO). These ecosystem units in the Newfoundland and Labrador Shelves bioregion were historically dominated by groundfish, which were also the main target of fisheries prior to 1992. Fishing pressure on these ecosystems was high by both foreign and domestic fleets from the 1960s until the early 1990s, with total catches around 1 million tonnes per year in the 1960s and early 1970s, and 500 kt since the mid-late 1970s to the early 1990s. During this period, overall fishing removals were above current estimates of the capacity of these ecosystems to sustain (Koen-Alonso et al., 2013, NAFO, 2019).
During the late 1980s and early 1990s, the entire bioregion underwent an abrupt shift in community structure associated with extreme environmental conditions. These changes involved major declines in commercial and non-commercial species, including flatfishes like Witch flounder, and pelagic fishes. The combined impact of a history of overfishing, believed to have weakened the ability of these ecosystems to tolerate perturbations, and the extreme environmental conditions during the late 1980s and early 1990s led to a reduction in productivity of many groundfish species (Witch flounder included) (Koen-Alonso et al., 2010, 2013, Dempsey et al. 2017, 2018, Pedersen et al. 2017, 2020, Koen-Alonso and Cuff, 2018, NAFO, 2019). During this period, the cold environmental conditions together with the reduced predation pressure from groundfish allowed the build-up of shellfish species.
By the mid-to-late 2000s, warmer environmental conditions, coupled with some modest improvements in capelin levels, prompted an overall build-up of groundfish biomass while shellfish declined. Although total biomass has improved since the mid-1990s, current levels are still well below the total biomasses observed in the 1980s (Koen-Alonso and Cuff, 2018). From 2016 to 2017, ecosystem units in this bioregion showed noticeable reductions in total biomasses compared to levels reached from 2010 to 2015, and while there have since been some signals of improvement, total biomasses have not yet recovered.
Through this period of ecosystem changes, the Witch flounder biomass has shown a gradual and steady improvement from the very low levels of the mid-1990s. However, the improvement at the scale of medium benthivores, the fish functional group that includes Witch flounder, has been slower, and its biomass remains largely unchanged since 2010. This suggests reallocations in the utilization of resources within, and potentially resource limitations for the functional group as a whole.
Overall, the available information suggests the conditions that promoted groundfish build-ups since the mid-to-late 2000s have eroded, with current ecosystem conditions still indicating limited productivity of the fish community. While fishing has undoubtedly been an important driver of changes for commercial groundfish species in the Newfoundland and Labrador Shelves bioregion, bottom-up processes and species interactions (e.g. capelin availability) have also been major driving forces over the past three decades, which is expected to continue. Despite these processes, the Witch Flounder stock continues to rebuild at a faster rate than other ecosystem components in a similar trophic position.
2. Overview of the fishery
History of the fishery
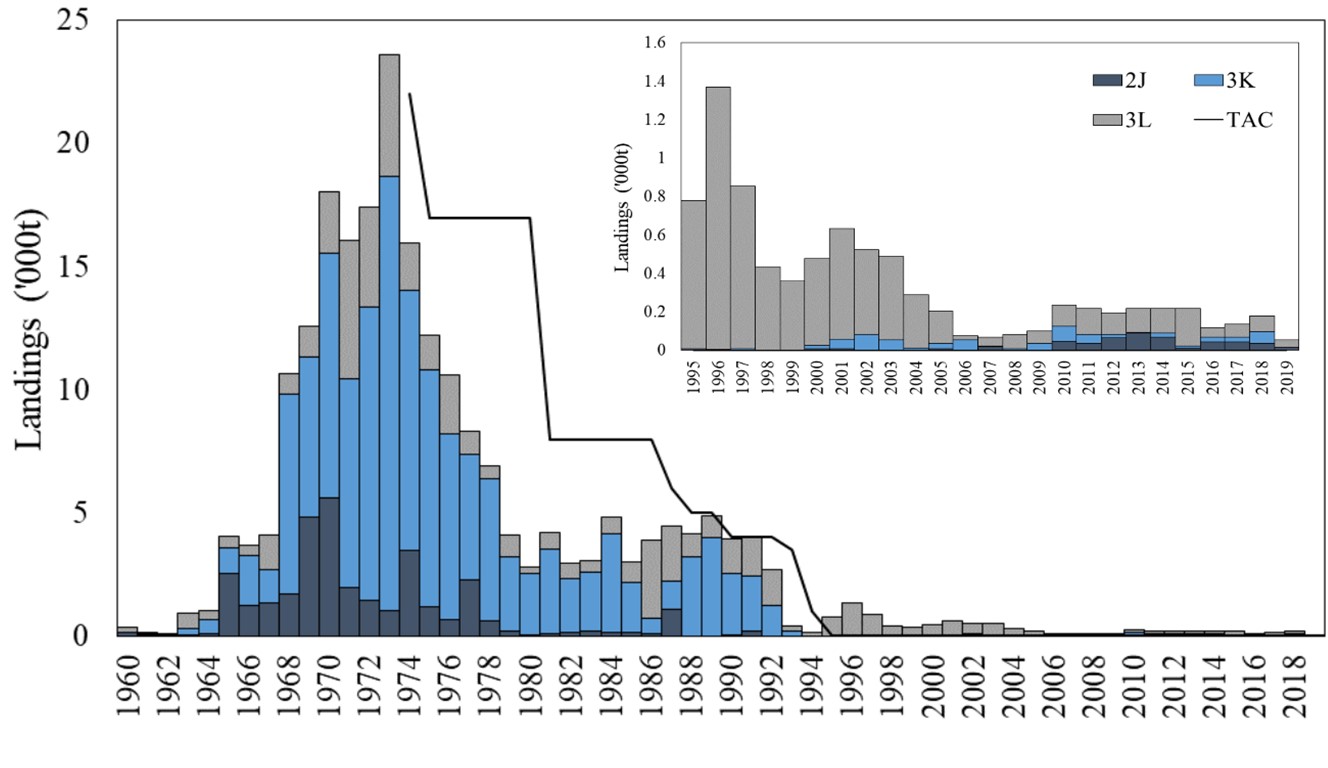
The fishery for Witch flounder in 2J3KL began in the early 1960s, with landings increasing from approximately 1,000t in 1963 to a peak of approximately 24,000t in 1973 (Figure 2). A total allowable catch (TAC) was first established for this fishery in 1974 at a level of 22,000t, upon which annual catches began to rapidly decline to 2,800t by 1980, after which it fluctuated between 3,000t and 4,500t until the early 1990s. During the height of the fishery from the mid-1960s to the late 1980s, fishing was conducted mainly in Division 3K primarily by vessels from Poland, the Union of Soviet Socialist Republics (USSR), and Canada.
Landings declined to 137t by 1994. In 1995, Canada established a moratorium on directed fishing of 2J3KL Witch flounder in Canadian waters (within 200 nm). At the request of Canada, in 1998 NAFO introduced a moratorium on directed fishing which limited the bycatch of Witch flounder in the NAFO Regulatory Area (NRA), the portion of the stock in Division 3L outside 200 nm, to the greater of 5 percent of catch retained onboard or 1250kg for all NAFO Contracting Party vessels. The introduction of this bycatch limit by NAFO coincided with a reduction in catches of Witch flounder in the NRA in 3L and stock growth.
Bycatch in other fisheries
Description
| Year | Division 2J | Division 3K | Division 3L | TAC (thousands of tonnes) |
|---|---|---|---|---|
| 1960 | 146 | 14 | 194 | NA |
| 1961 | 35 | 51 | 46 | NA |
| 1962 | 25 | 13 | 40 | NA |
| 1963 | 38 | 263 | 644 | NA |
| 1964 | 92 | 560 | 392 | NA |
| 1965 | 2547 | 1049 | 464 | NA |
| 1966 | 1268 | 2000 | 429 | NA |
| 1967 | 1357 | 1322 | 1422 | NA |
| 1968 | 1716 | 8119 | 831 | NA |
| 1969 | 4852 | 6457 | 1276 | NA |
| 1970 | 5604 | 9961 | 2465 | NA |
| 1971 | 1978 | 8462 | 5613 | NA |
| 1972 | 1443 | 11911 | 4074 | NA |
| 1973 | 1048 | 17624 | 4949 | NA |
| 1974 | 3497 | 10550 | 1916 | 22 |
| 1975 | 1185 | 9621 | 1399 | 17 |
| 1976 | 683 | 7533 | 2409 | 17 |
| 1977 | 2267 | 5091 | 960 | 17 |
| 1978 | 640 | 5761 | 503 | 17 |
| 1979 | 188 | 3027 | 882 | 17 |
| 1980 | 41 | 2496 | 286 | 17 |
| 1981 | 110 | 3436 | 648 | 8 |
| 1982 | 149 | 2198 | 634 | 8 |
| 1983 | 200 | 2412 | 476 | 8 |
| 1984 | 155 | 4000 | 658 | 8 |
| 1985 | 160 | 1998 | 845 | 8 |
| 1986 | 95 | 637 | 3184 | 8 |
| 1987 | 1100 | 1141 | 2234 | 6 |
| 1988 | 8 | 3189 | 957 | 5 |
| 1989 | 5 | 3987 | 914 | 5 |
| 1990 | 62 | 2494 | 1411 | 4 |
| 1991 | 216 | 2241 | 1558 | 4 |
| 1992 | 1 | 1259 | 1442 | 4 |
| 1993 | 0 | 208 | 194 | 3.5 |
| 1994 | 0 | 8 | 129 | 1 |
| 1995 | 9 | 1 | 769 | 0 |
| 1996 | 2 | 2 | 1367 | 0 |
| 1997 | 2 | 6 | 846 | 0 |
| 1998 | 2 | 0 | 432 | 0 |
| 1999 | 0 | 1 | 358 | 0 |
| 2000 | 8 | 19 | 449 | 0 |
| 2001 | 7 | 51 | 575 | 0 |
| 2002 | 1 | 82 | 442 | 0 |
| 2003 | 2 | 51 | 437 | 0 |
| 2004 | 0 | 11 | 279 | 0 |
| 2005 | 10 | 27 | 166 | 0 |
| 2006 | 0 | 53 | 24 | 0 |
| 2007 | 19 | 3 | 46 | 0 |
| 2008 | 0 | 7 | 77 | 0 |
| 2009 | 2 | 34 | 64 | 0 |
| 2010 | 47 | 78 | 111 | 0 |
| 2011 | 37 | 47 | 136 | 0 |
| 2012 | 66 | 17 | 109 | 0 |
| 2013 | 90 | 3 | 124 | 0 |
| 2014 | 68 | 21 | 131 | 0 |
| 2015 | 13 | 9 | 195 | 0 |
| 2016 | 43 | 27 | 47 | 0 |
| 2017 | 43 | 27 | 66 | 0 |
| 2018 | 36 | 60 | 82 | 0 |
| 2019 | 17 | 0 | 39 | 0 |
Since 1998, landings of 2J3KL Witch flounder caught as bycatch in other fisheries (including bycatch in the NRA) ranged from 68t to 633t, averaging 141t annually over the last five years (2015 to 2019). From 2010 to 2019, an average of 70% of the total landings from bycatch are caught in Canadian fisheries, primarily Greenland halibut. Logbook records indicate that recent catches have been predominantly from the slope of the Northeast Newfoundland Shelf in Division 2J and the northeast slope of the Grand Bank (Division 3L). Available length measurements from at-sea observers and port sampling of commercial otter trawl fisheries show Witch flounder from 30-60 cm comprise the bulk of recent bycatch landings. However, sampling effort is low, with 0-20 length frequencies recorded annually since 2000.
Governance and approval process
The 2J3KL Witch flounder stock is a transboundary stock straddling Canada’s 200-mile limit, and occurs in both Canadian domestic waters and the NRA. While the NAFO Convention Area includes the 200-mile exclusive economic zones of coastal states jurisdiction, its regulatory action is limited to the NRA, defined as those parts of the Convention Area beyond areas of national jurisdiction. Following the dissolution of the International Commission for the Northwest Atlantic Fisheries and both the establishment of the Canadian Exclusive Economic Zone (EEZ) and the formation of NAFO in 1979, this stock has been managed exclusively by Canada.
Canadian groundfish fisheries are governed by the Fisheries Act, regulations made pursuant to the Act, and DFO policies. The Fisheries Licensing Policy of Newfoundland and Labrador Region provides details on the various licensing policies that govern the commercial fishing industry in the Newfoundland and Labrador Region (please note that DFO should be consulted for all purposes of interpreting this document). Other key regulations and policies that apply include, but are not limited to:
- Aboriginal Communal Fishing Licences Regulations
- Atlantic Fishery Regulations 1985
- Fishery (General) Regulations
- Commercial Fisheries Licensing Policy for Eastern Canada, 1996
In 2019, DFO established a 2+3KLMNO Groundfish Advisory Committee as a forum to discuss issues with stakeholders and Indigenous groups related to the management of groundfish in 2+3KLMNO, including the 2J3KL Witch flounder stock. The Committee meets annually in the fall to discuss 2+3KLMNO groundfish and to bring forward proposals representing the perspectives of various stakeholders. Based on the science assessment and input from the Advisory Committee, the Minister of Fisheries, Oceans and the Canadian Coast Guard decides upon management measures for 2J3KL Witch flounder and other groundfish in 2+3KLMNO.
3. Stock status
Precautionary approach
In 2003, the Privy Council Office, on behalf of the Government of Canada, published a framework applicable to all federal government departments that set out guiding principles for the application of precaution to decision making about risks of serious or irreversible harm where there is a lack of full scientific certainty.
A fishery decision-making framework incorporating the precautionary approach was developed, and applies where decisions on harvest strategies or harvest rates for a stock must be taken to determine TAC or other measures to control harvests. The framework applies to key harvested stocks managed by DFO: those stocks that are the specific and intended targets of a fishery, whether in a commercial, recreational or subsistence fishery. In applying the framework, all removals of these stocks from all types of fishing must be taken into account.
The following are the primary components of the generalized framework:
- Reference points and stock status zones (Healthy, Cautious and Critical);
- Harvest strategy and harvest decision rules; and
- The need to take into account uncertainty and risk when developing reference points and developing and implementing decision rules.
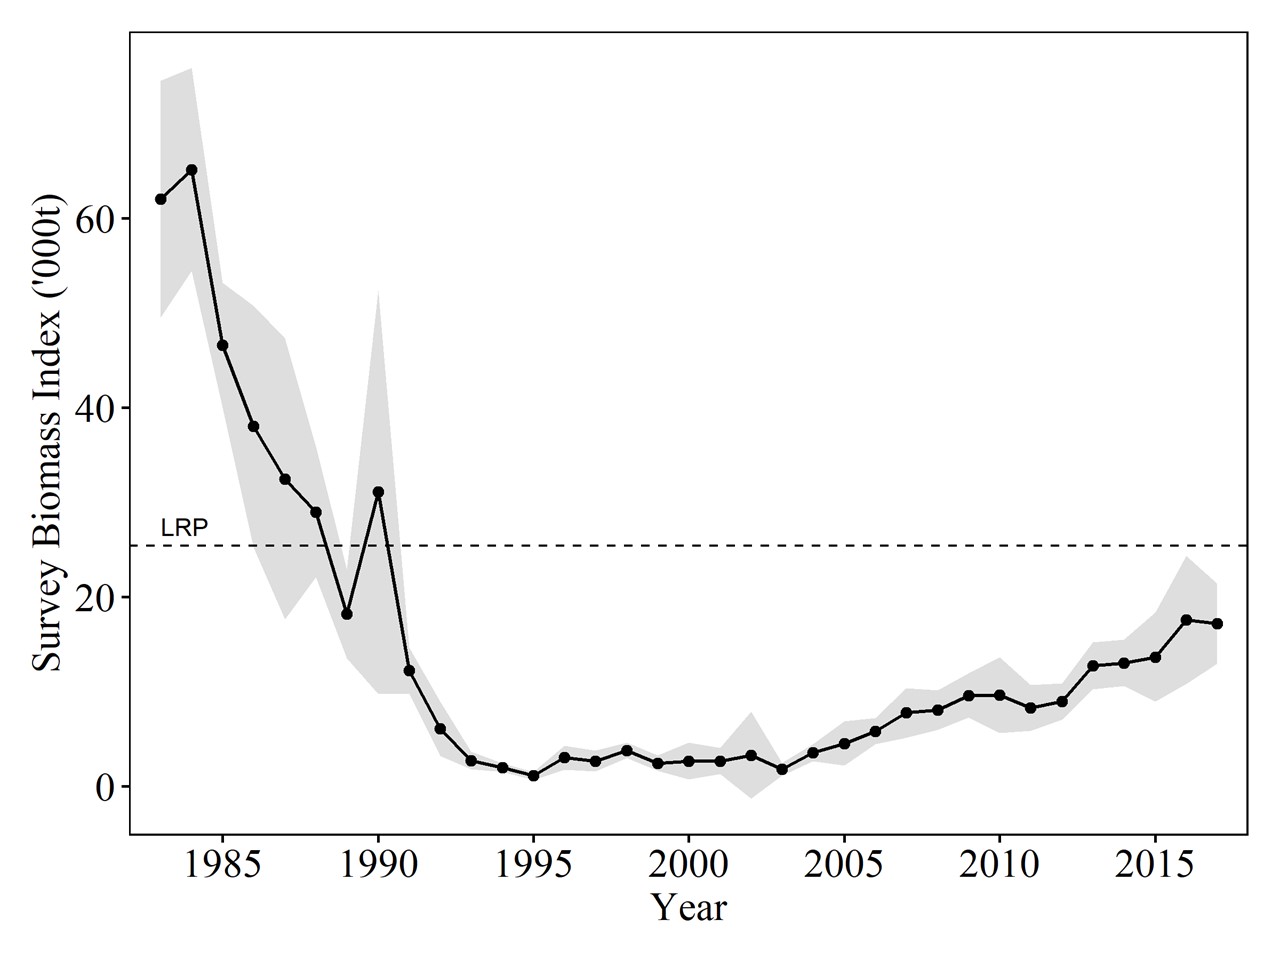
A proxy for biomass at maximum sustainable yield (BMSY) and LRP was established for 2J3KL Witch flounder during a stock assessment process by DFO Science in May 2018 (SAR 2018/053). The BMSY proxy is defined as the mean of the survey biomass indices from the 1983-84 fall Research Vessel (RV) surveys, and consistent with the DFO decision-making framework incorporating the PA, the LRP is defined as 40% BMSY. An USR of 2 x the LRP (80% of the BMSY proxy) has been established for 2J3KL Witch flounder, informed by consultations with stakeholders and with advice and input from Science.
Stock assessment
The assessment of this stock is based on indices from Canadian fall RV surveys of Divisions 2J3KL and commercial catch (bycatch) data. In 2016 and 2017, indices of biomass and abundance reached the highest levels since 1990, but remain below the levels of the mid-1980s and below the LRP. Abundance of fish <23cm indicate improved recruitment since 2013. Following a contraction of the stock to shelf slope areas through the 1990s, the distribution of the stock has expanded in recent years, returning to deep channels occupied in the mid-1980s. Survey biomass has been consistently below the LRP since 1991, with the stock in the Critical zone as of the 2018 assessment of this stock. Consistency with the DFO decision-making framework incorporating the PA requires that removals from all sources must be kept at the lowest possible level until the stock clears the Critical zone.
Description
| Year | Biomass Index ('000t) | Lower Confidence Limit ('000t) | Upper Confidence Limit ('000t) |
|---|---|---|---|
| 1983 | 62.0 | 49.5 | 74.5 |
| 1984 | 65.2 | 54.4 | 75.9 |
| 1985 | 46.6 | 40.0 | 53.2 |
| 1986 | 38.0 | 25.3 | 50.8 |
| 1987 | 32.5 | 17.6 | 47.4 |
| 1988 | 29.0 | 22.1 | 35.9 |
| 1989 | 18.2 | 13.5 | 22.9 |
| 1990 | 31.1 | 9.8 | 52.4 |
| 1991 | 12.2 | 9.8 | 14.6 |
| 1992 | 6.1 | 3.2 | 9.0 |
| 1993 | 2.7 | 1.8 | 3.7 |
| 1994 | 2.0 | 1.5 | 2.4 |
| 1995 | 1.1 | 0.7 | 1.5 |
| 1996 | 3.0 | 1.7 | 4.3 |
| 1997 | 2.7 | 1.6 | 3.8 |
| 1998 | 3.8 | 3.0 | 4.6 |
| 1999 | 2.5 | 1.7 | 3.3 |
| 2000 | 2.7 | 0.7 | 4.6 |
| 2001 | 2.7 | 1.3 | 4.1 |
| 2002 | 3.3 | 1.3 | 7.9 |
| 2003 | 1.8 | 1.2 | 2.5 |
| 2004 | 3.6 | 2.7 | 4.5 |
| 2005 | 4.5 | 2.2 | 6.9 |
| 2006 | 5.8 | 4.5 | 7.2 |
| 2007 | 7.8 | 5.2 | 10.4 |
| 2008 | 8.1 | 6.0 | 10.2 |
| 2009 | 9.6 | 7.3 | 11.9 |
| 2010 | 9.6 | 5.6 | 13.7 |
| 2011 | 8.3 | 5.9 | 10.7 |
| 2012 | 9.0 | 7.1 | 10.9 |
| 2013 | 12.8 | 10.3 | 15.2 |
| 2014 | 13.1 | 10.6 | 15.5 |
| 2015 | 13.7 | 8.9 | 18.4 |
| 2016 | 17.6 | 10.8 | 24.4 |
| 2017 | 17.2 | 13.0 | 21.4 |
Stock scenarios
This stock has shown consistent growth since the early 2000s. If the stock experiences favorable environmental and ecosystem conditions, maintains continued high recruitment, and continues to experience low fishery catches, it is expected that increases in stock biomass should continue. However, in the absence of an analytical population model, projections are not available for this stock.
Aboriginal Traditional Knowledge
Aboriginal traditional knowledge and traditional ecological knowledge from Indigenous groups are considered in science processes and management decisions. Refer to Section 2.3 of the 2+3KLMNO Groundfish IFMP for additional information.
4. Socio-economic and cultural importance
Historical records indicate that the 2J3KL Witch flounder component of the groundfish fishery represented only a small fraction of total harvest value. From mid-1970 to 1991 there were an average of 46 vessels per year with recorded landings of Witch flounder in 2J3KL in Newfoundland and Labrador. While landings were distributed among inshore and offshore fleet sectors, the offshore sector accounted for the largest proportion of landings. Average annual Canadian landings were 2,040t.
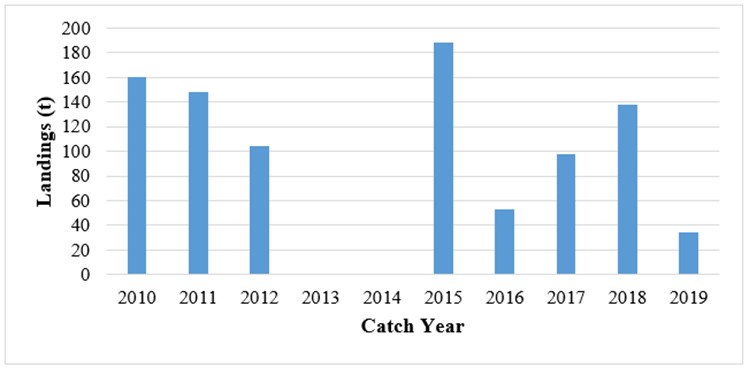
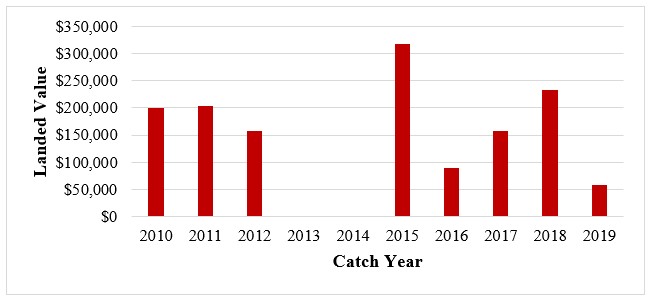
As noted in Section 2, there is currently no directed fishery for Witch flounder in 2J3KL; however, it is caught as bycatch in directed fisheries for other groundfish species, most notably Greenland halibut and Redfish. Over the 2010 to 2019 period, an annual average of 127t (Figure 4) was landed by Canadian enterprises with an estimated annual landed value of less than $200,000 (Figure 5). Given the relatively small bycatch volumes, 2J3KL Witch flounder does not currently represent a significant proportion of the total landed value in the Newfoundland and Labrador Region.
The rebuilding of 2J3KL Witch flounder has a benefit in terms of its continued functional role in the ecosystem. Canadians, including Indigenous peoples, may also place a value on conservation and protection of the species in and of itself, and its value to future generations. The value of these benefits is currently unknown. A recovered stock would also have a significant commercial value. Landings at the historical average of 2,040 t (1970 to 1991) could, at current prices, have a landed value in the range of $5.0M.
Please refer to the 2+3KLMNO Groundfish IFMP for more information about the socio-economic and cultural importance of groundfish in these NAFO divisions.
Description
| Year | Landings (tonnes) |
|---|---|
| 2010 | 160 |
| 2011 | 148 |
| 2012 | 105 |
| 2013 | x |
| 2014 | x |
| 2015 | 188 |
| 2016 | 53 |
| 2017 | 98 |
| 2018 | 138 |
| 2019 | 35 |
| "x" = Data cannot be released due to privacy guidelines | |
Description
| Year | Landed value |
|---|---|
| 2010 | $199,403 |
| 2011 | $203,278 |
| 2012 | $156,984 |
| 2013 | x |
| 2014 | x |
| 2015 | $316,482 |
| 2016 | $89,129 |
| 2017 | $158,285 |
| 2018 | $233,588 |
| 2019 | $58,863 |
| x = Data cannot be released due to privacy guidelines | |
5. Management issues
The incidental catch of 2J3KL Witch flounder in other fisheries is managed using the Policy on Managing Bycatch. The objectives of this policy are: one, to ensure that Canadian fisheries are managed in a manner that supports the sustainable harvesting of aquatic species and that minimizes the risk of fisheries causing serious or irreversible harm to bycatch species; and two, to account for total catch.
Reported bycatch of 2J3KL Witch flounder in other fisheries has remained relatively low since the late 1990s. Between 2010 and 2019, an average of 179 t per year was landed in other groundfish fisheries in NAFO Divisions 2J3KL (of which 70% was landed by Canadian enterprises). Total fishing mortality of 2J3KL Witch flounder is not quantified at this time, however a proxy based on catch and survey indices indicates that fishing mortality in this stock is relatively low (See Appendix 1)
The impact of natural mortality on population dynamics of 2J3KL Witch flounder remains unknown.
6. Objectives
As outlined in the PA Framework, the primary objective of this rebuilding plan is to promote stock growth out of the Critical zone (i.e. grow the stock beyond the LRP), by ensuring removals from all fishing sources are kept to the lowest possible level until the stock has cleared this zone. Within the Critical zone, this objective remains the same whether the stock is declining, stable, or increasing.
Short-term and long-term objectives for the rebuilding plan, as well as an interim milestone, are outlined below. Timelines for meeting these objectives cannot be determined in the absence of an analytical population model and biomass projections for this stock, and as the rate of recovery would depend on future rates of recruitment and productivity.
Long-term objective
The long-term objective is to promote the rebuilding of the biomass of Witch flounder in 2J3KL to the ‘Healthy zone’ (above the USR as described by DFO’s Precautionary Approach), and to maintain biomass at or near BMSY.
Interim milestone
As an interim milestone, increase the biomass of 2J3KL Witch flounder to the mid-point of the Cautious zone.
Short-term objectives
- Promote biomass growth out of the Critical zone (i.e. above the LRP).
- Maintain the number of undersized Witch flounder (less than 30 cm in length) at less than 15 percent of the catch.
- Promote stability in total allowable catch under circumstances of nominal year to year fluctuations in survey biomass index.
- Employ an exploitation rate that promotes a positive biomass trajectory while the stock is in the Cautious zone, and that promotes maintaining biomass at or near BMSY while in the Healthy zone.
7. Management measures
No specific threats to survivorship were identified in recent stock assessments of 2J3KL Witch flounder; however, ecosystem conditions in 2J3KL are indicative of low productivity of the fish community. The measures to be implemented to support the rebuilding objectives are outlined below.
Harvest strategy and decision rules for 2J3KL witch flounder
The Harvest Strategy and Decision Rules for 2J3KL Witch flounder are intended to support the above management objectives and interim milestone. It informs decisions while the stock remains in the Critical zone and while it is below the midpoint of the Cautious zone (i.e. below 50% of the USR) of the PA Framework. It is anticipated that this midpoint will not be reached during the 5 year implementation period for this rebuilding plan.
In the absence of a population model for 2J3KL Witch flounder, stock projections and simulations of catch scenarios cannot be examined. Therefore, the efficacy of any rule for this stock cannot be demonstrated. This is a principle-based approach to provide predictability with respect to harvest decisions for this stock while it is below the midpoint of the Cautious zone. The permitted harvest rates in this rebuilding plan are informed by periods of decline and growth previously observed for 2J3KL Witch flounder. Based on available scientific information, the period of decline was considered to have occurred from 1986 to 1995 and the period of growth was considered to have occurred between 2005 to 2017. During these periods, average harvest rates, calculated as a proxy for fishing mortality based on annual landings as a proportion of exploitable survey biomass, were 0.18 and 0.025, respectively. The permitted harvest rates for the Cautious zone up to 50% of the USR are consistent with levels previously associated with growth, and therefore support the objective of employing an exploitation rate that promotes a positive biomass trajectory while the stock is in this zone.
Harvest strategy
The principles of the Harvest Strategy and Decision Rules are as follows:
- The Harvest Strategy is based on an index of exploitable biomass, defined as the portion of the stock that would be exploited in the fishery (biomass of fish 30 cm or greater). The exploitable biomass index is calculated from the survey abundance at length (from stratified estimates) multiplied by the weight at length.
- A 3-year, uncertainty-weighted smoother of exploitable biomass is applied to the Harvest Strategy. As the variance on the exploitable biomass cannot be directly estimated, the exploitable biomass is weighted inversely by the width of the confidence intervals on the total survey biomass index (see Annex 1 for a detailed description of the calculation and weighting of indices).
- In the case of a missing survey year, a 2-year weighted smoother based on confidence intervals will be applied to the Harvest Strategy for any interval that overlaps with the missing year.
- Stock status relative to the LRP and USR will be determined from estimates of total survey biomass. Once the stock grows out of the Critical zone (above the LRP), permitted harvest levels are to be derived from the weighted index of exploitable biomass.
Harvest decision rules
The decision rules under the harvest strategy are as follows:
- When the stock is in the Critical zone, no directed fishing is permitted and removals from all sources must be kept to the lowest possible level.
- When the stock is between the LRP and 125% of the LRP, the permitted harvest rate is 0.025 (2.5%).
- When the stock is between 125% to 150% of the LRP, the permitted harvest rate is 0.04 (4.0%).¹
Ongoing monitoring of the implementation of the above Harvest Strategy and Decision Rules will occur and adjustments will be considered as necessary (refer to section 12 for more information).
The development of harvest rates beyond the mid-point of the Cautious zone will occur when the performance of the stock can be analyzed further, potentially when the rebuilding plan is reviewed or as the stock approaches the midpoint of the Cautious zone.
Management of incidental catch (Bycatch)
A number of management tools have been established to limit incidental catches of Witch flounder in Divisions 2J3KL. For each fishery, Conservation Harvesting Plans set out measures to reduce incidental catch of non-target species, including incidental catch limits, either per day or per fishing trip, which if exceeded may result in a closure of a fishery for a period of time. For inshore fleets directing for any groundfish species, the daily incidental catch of Witch flounder in Divisions 2J3KL may not exceed 10% or 200 pounds round weight, whichever is greater. For mid-shore and offshore fleets, incidental catch of 2J3KL Witch flounder in other groundfish fisheries may not exceed 1,250 kg or 5% of total catch, on a per trip basis, whichever is greater. Landings of groundfish is mandatory in Newfoundland and Labrador (except where authorized) and any incidental catch of 2J3KL Witch flounder in other fisheries is retained and recorded through the dockside monitoring program (DMP).
As a result of concerns about the level of bycatch of groundfish and other species by the small-meshed shrimp trawls, an exclusion device known as the Nordmore grate was introduced in the Canadian shrimp fishery in 1993. This device sorts out the larger species, allowing them to escape through an opening in the top of the net, while allowing smaller shrimp to pass through and be retained in the cod-end of the net and has been mandatory since 1997. Further information can be found in the Northern shrimp IFMP.
Small fish protocol
Once the 2J3KL Witch flounder stock grows out of the Critical zone and a directed fishery is permitted to occur (in accordance with the harvest decision rules specified in section 7.1), a small fish protocol will apply to the fishery. Under the protocol, catches of Witch flounder in 2J3KL are considered undersized if smaller than 30 cm. This measure is informed by scientific information which indicates that the 30 cm metric is generally consistent with the average length at 50 percent maturity (L50), with the L50 of females and males determined to be near 38 cm and 28 cm, respectively (RD 2019/066). Designated areas may close to individual license holders or a fleet sector when the number of undersized fish reaches or exceeds 15% of the catch. Small fish closures are to be established for a minimum period of 10 days, and a successful, observed, industry-funded test fishery would be required to consider a re-opening of the fishery to an individual license holder or fleet sector. This measure will support the rebuilding plan objective of maintaining the number of undersized Witch flounder at less than 15 percent of the catch, and therefore the long-term objective of promoting further stock rebuilding to the Healthy zone of the PA framework.
Marine conservation areas
Several of the marine conservation areas established to date around Newfoundland and Labrador benefit significant concentrations of groundfish. Specifically, The Funk Island Deep Closure (7,274 km2 in NAFO Division 3K) and Hawke Channel Closure (8,837 km2 in NAFO Division 2J) overlap with the Labrador Marginal Trough Ecologically and Biologically Significant Area (EBSA) and the Notre Dame Channel EBSA respectively. Witch flounder occur in high densities in these EBSAs. The Hawke Channel and Funk Island Closures prohibit fishing by bottom trawl, gillnet, and longline, and therefore help conserve the diverse population of groundfish, including Witch Flounder, that is found in these areas. The Northeast Newfoundland Slope Closure (55,353 km2 in NAFO Divisions 3K and 3L), established to protect corals and sponges, prohibits all bottom contact fishing for all species.
Monitoring
Monitoring tools in use to monitor incidental catches of 2J3KL Witch flounder fishery include the DMP, patrols by DFO fishery officers (air, sea and land), at-sea observer coverage, vessel monitoring system (VMS), daily hails, and completion of logbooks. Coverage by at-sea observers is generally within the range of 5%. Refer to section 7 of the 2+3KLMNO Groundfish IFMP for further details on monitoring.
8. Access and allocation
Sharing arrangements, quotas and allocations
The Minister can, for reasons of conservation or for any other valid reasons, modify access, allocations and sharing arrangements, in accordance with the powers granted pursuant to the Fisheries Act.
Historically and prior to the moratorium, the TAC established by Canada for the 2J3KL Witch flounder fishery was allocated in accordance with a fleet sharing arrangement that provided 82.9% of the Canadian 2J3KL Witch Flounder quota to the offshore sector with the balance to other participating Canadian fleet sectors. No allocations or quotas are in place for this stock while it remains under moratorium.
9. Shared stewardship
Shared stewardship is achieved through the involvement of stakeholders and Indigenous groups in DFO’s advisory committee and science advisory processes. In addition, there is a Fishery Improvement Project for 2J3KL Witch flounder, launched in 2017 and led by the Atlantic Groundfish Council, which focuses on improved sustainability of the stock.
10. Compliance
The Conservation and Protection (C&P) program promotes and maintains compliance with legislation, regulations and management measures implemented to achieve the conservation and sustainable use of Canada’s aquatic resources, and the protection of species at risk, fish habitat and oceans. The program is delivered through a balanced regulatory management and enforcement approach. Specifically:
- promotion of compliance through education and shared stewardship;
- monitoring, control and surveillance activities;
- management of major cases and special investigations in relation to complex compliance issues; and
- use of intelligence data supplied through the National Fisheries Intelligence Service.
Details on the compliance strategy, priorities, and enforcement data can be found in Section 9 of the 2+3KLMNO Groundfish IFMP.
11. Exceptional circumstances
Exceptional Circumstances are intended to respond to an event or observation that is outside the range of possibilities considered within the harvest strategy outlined in section 7. If an Exceptional Circumstance has been deemed to have occurred, the courses of action to take could involve:
- Assessing the Exceptional Circumstance but maintaining the harvest strategy.
- Applying the harvest strategy with adjustments.
- Setting a TAC that departs from the harvest strategy, and reviewing the harvest strategy.
The following constitute Exceptional Circumstances that will trigger one of the above courses of action, depending on the circumstance observed:
- If there are 2 missing surveys in the 3 most recent years.
- If there is a continuous biomass decline over a 3 year period when the stock is in the Cautious zone. Such a decline has not been observed in this stock since 1993 to 1995, prior to the start of stock growth in the early 2000s.
- If the average survey biomass (± 1 SD) of the last three years (y to y-2) falls outside the 95% confidence intervals for the last fitted value of a linear model of the fall 2J3KL biomass index from 2002 to the y-1. This is consistent with the trigger for a stock assessment (SAR 2018/053).
12. Evaluation and performance review
Outcomes from the application of this rebuilding plan will be monitored periodically through the 2+3KLMNO Groundfish Advisory Committee to determine if changes to the plan are warranted. After an implementation period of 5 years, a comprehensive review of the rebuilding plan will be undertaken through the Advisory Committee, unless the following exceptions occur before that time:
- A new scientific assessment is conducted for 2J3KL Witch flounder that results in a significant change in the scientific understanding of the stock, or if the new assessment utilizes an assessment model that produces new information or analytical capabilities for informing the rebuilding plan.
- An exceptional circumstance has been deemed to have occurred that warrants a review of the harvest strategy.
While there is currently no defined scientific assessment cycle established for 2J3KL Witch flounder, the review period will align to the extent possible with the timing of assessments by DFO Science for this stock.
Annex 1 - Calculation and weighting of Exploitable Biomass indices
Exploitable size for Witch flounder was defined as fish 30cm or greater, based on small fish protocol size and examination of commercial length frequencies (see Wheeland et al. 2019). Annual fall RV Surveys of Divisions 2J3KL result in stratified estimates of abundance at length in 2 cm intervals. Exploitable biomass was therefore calculated from abundance at length for length bins including fish 29.5 cm or greater.
As no significant differences in weight at length were observed over time in this stock, all measurements of length and weight across the time series were pooled to calculate a length-weight regression to convert abundance at length to weight at length, as follows:
W_L=αLβ
Where W_L is weight (kg) at length L (cm). For 2J3KL Witch flounder parameters were calculated as follows: α=1.212e-6, β=3.464.
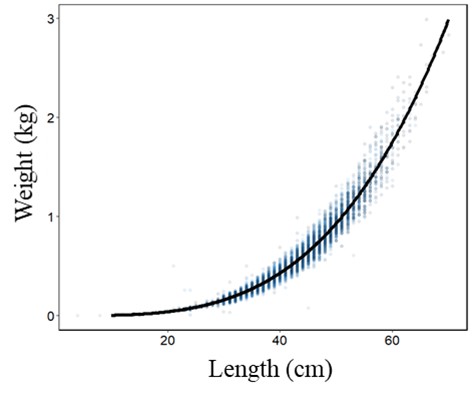
Description
Figure 1: Length weight relationship for Witch flounder in NAFO Divs. 2J3KL. Scatter plot displays all available measurements of weight at length from the RV survey. These cover a range of lengths from <5cm to 70cm and weights near 0 to 3kg. A line shows the length:weight relationship following the equations weight = 1.212e-6 * (Length^3.464.)
Biomass at length was then summed across exploitable sizes to obtain exploitable biomass (Bexploit), as follows:

Where L is the fish total length, AL is the stratified estimate of survey abundance at length in 2cm length bins, α and β are length weight regression parameters described above.
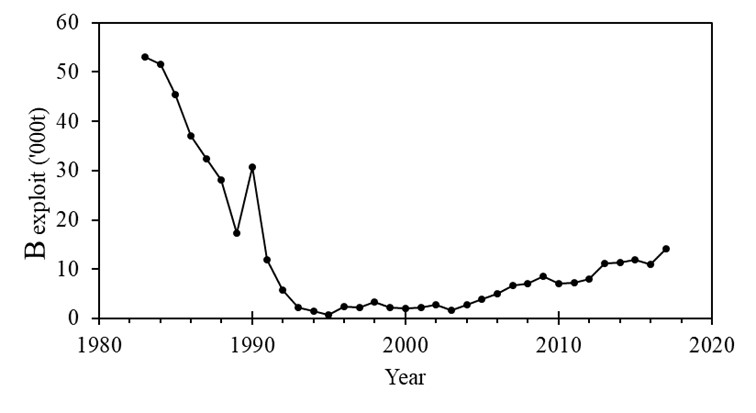
Description
| Year | B exploit (thousand tonnes) |
|---|---|
| 1983 | 53 |
| 1984 | 52 |
| 1985 | 45 |
| 1986 | 37 |
| 1987 | 32 |
| 1988 | 28 |
| 1989 | 17 |
| 1990 | 31 |
| 1991 | 12 |
| 1992 | 6 |
| 1993 | 2 |
| 1994 | 2 |
| 1995 | 1 |
| 1996 | 3 |
| 1997 | 2 |
| 1998 | 2 |
| 1999 | 2 |
| 2000 | 3 |
| 2001 | 2 |
| 2002 | 3 |
| 2003 | 2 |
| 2004 | 3 |
| 2005 | 4 |
| 2006 | 5 |
| 2007 | 7 |
| 2008 | 7 |
| 2009 | 9 |
| 2010 | 7 |
| 2011 | 7 |
| 2012 | 8 |
| 2013 | 11 |
| 2014 | 11 |
| 2015 | 12 |
| 2016 | 11 |
| 2017 | 14 |
A three year weighted average of exploitable biomass was calculated with Bexploit inversely weighted by the width of the confidence intervals on estimates of total survey biomass. Variance on estimates of Bexploit cannot currently be directly estimated, however there was no evidence that variance in total survey biomass estimates were being driven by particular length classes. It was therefore agreed that CIs from these indices were an applicable measure of variance on Bexploit for this weighting.
The weighted average exploitable biomass in each year (Bexploit,y) was therefore calculated as:

Where CI is the width of the confidence interval on the estimate of survey biomass in year y.
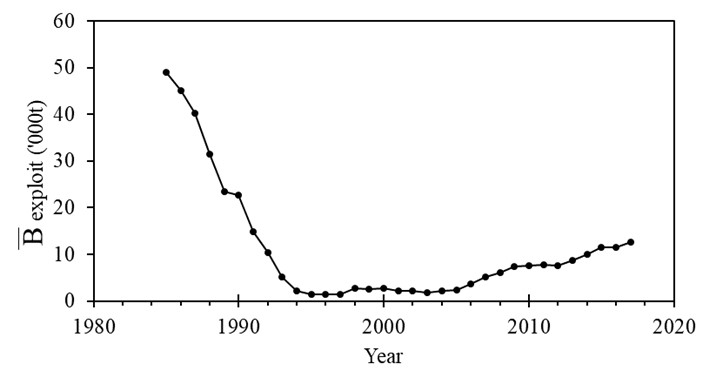
Description
| Year | 3-year average exploitable biomass (thousand tonnes) |
|---|---|
| 1985 | 49 |
| 1986 | 45 |
| 1987 | 40 |
| 1988 | 32 |
| 1989 | 23 |
| 1990 | 23 |
| 1991 | 15 |
| 1992 | 10 |
| 1993 | 5 |
| 1994 | 2 |
| 1995 | 1 |
| 1996 | 1 |
| 1997 | 1 |
| 1998 | 3 |
| 1999 | 3 |
| 2000 | 3 |
| 2001 | 2 |
| 2002 | 2 |
| 2003 | 2 |
| 2004 | 2 |
| 2005 | 2 |
| 2006 | 4 |
| 2007 | 5 |
| 2008 | 6 |
| 2009 | 7 |
| 2010 | 8 |
| 2011 | 8 |
| 2012 | 8 |
| 2013 | 9 |
| 2014 | 10 |
| 2015 | 11 |
| 2016 | 11 |
| 2017 | 13 |
Annual estimates of a proxy for fishing mortality (F) were then calculated as,
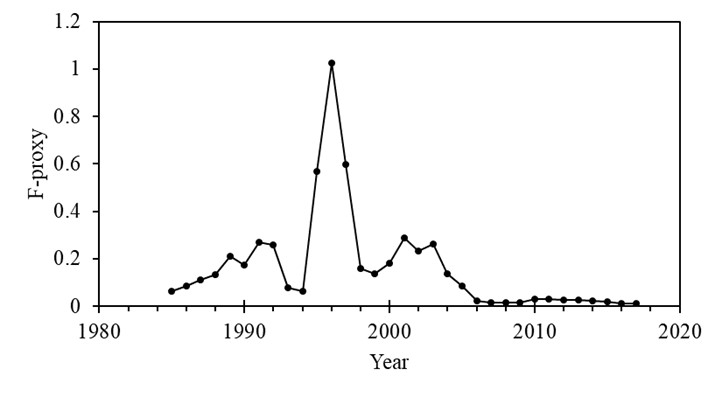
Description
| Year | F-proxy |
|---|---|
| 1985 | 0.06 |
| 1986 | 0.09 |
| 1987 | 0.11 |
| 1988 | 0.13 |
| 1989 | 0.21 |
| 1990 | 0.17 |
| 1991 | 0.27 |
| 1992 | 0.26 |
| 1993 | 0.08 |
| 1994 | 0.06 |
| 1995 | 0.57 |
| 1996 | 1.02 |
| 1997 | 0.60 |
| 1998 | 0.16 |
| 1999 | 0.14 |
| 2000 | 0.18 |
| 2001 | 0.29 |
| 2002 | 0.23 |
| 2003 | 0.26 |
| 2004 | 0.14 |
| 2005 | 0.09 |
| 2006 | 0.02 |
| 2007 | 0.01 |
| 2008 | 0.01 |
| 2009 | 0.01 |
| 2010 | 0.03 |
| 2011 | 0.03 |
| 2012 | 0.03 |
| 2013 | 0.02 |
| 2014 | 0.02 |
| 2015 | 0.02 |
| 2016 | 0.01 |
| 2017 | 0.01 |
References
L. Wheeland, B. Rogers, R. Rideout, D. Maddock Parsons. 2019. Assessment of Witch Flounder (Glyptocephalus cynoglossus) NAFO Divisions 2J3KL. DFO Can. Sci. Advis. Sec. Res. Doc. 2019/066. iv + 57 p.
¹ This is a preliminary harvest rate that will be reviewed as additional information on stock dynamics in relation to harvest rates becomes available.
- Date modified: