
Rebuilding plan: American plaice (Hippoglossoides platessoides) - NAFO Division 4T
Gulf Region
- Date Stock was determined to be at or below LRP: 1993
- Date Stock was prescribed to the Fish Stocks Provisions: April 4, 2022
- Date Rebuilding Plan approved: March 26, 2024
On this page
- Summary
- Acronyms used in this document
- Foreword
- 1.0 Introduction and context
- 2.0 Stock status and stock trends
- 3.0 Probable causes for the stock’s decline
- 4.0 Measurable objectives aimed at rebuilding the stock
- 5.0 Management measures aimed at achieving the objectives
- 6.0 Socio-economic considerations
- 7.0 Method to track progress towards achieving the objectives
- 8.0 Periodic review of the rebuilding plan
- 9.0 References
Summary
American plaice stock of the southern Gulf of St. Lawrence (sGSL), Northwest Atlantic Fisheries Organization (NAFO) Division 4T has remained in the critical zone of the Precautionary Approach (PA) framework since 1993. While overfishing is believed to be the primary cause of initial decline of American plaice, the increasing rate of natural mortality since the mid-1990 appears to be the major cause for the lack of rebuilding, as fishing mortality is currently estimated to be very low.
The natural mortality of American plaice has now been identified as the greatest threat to stock rebuilding in the sGSL, and predation by grey seals is thought to be a major component of the high level of natural mortality (Ricard et al. 2016). The RV biomass index for commercial-sized (≥ 30 cm total length) American plaice in the sGSL indicates that there has been no improvement in status since its last assessment (2016) and, despite a small increase in the index value in 2019 and 2020, the commercial biomass remains near the record low level of 2018 (DFO 2021b).
As outlined in the PA framework, the primary objective of this rebuilding plan is to promote growth of the sGSL American plaice stock out of the critical zone, by ensuring removals from all fishing sources are kept to the lowest possible level until the stock has cleared this zone. The rebuilding target for the plan will be to grow the stock so that it is above the Limit Reference Point (LRP) of 139,135 t, with a high likelihood (≥75%). If the rebuilding target can be reached, the long-term management objective under the Integrated Fisheries Management Plan (IFMP) will be to maintain the stock’s growth toward the healthy zone and maintain the stock’s SSB in that zone. Achieving and maintaining the SSB in the healthy zone would be to the benefit of all Canadians, including:
- harvesters
- sectors closely involved with the fishing industry and Indigenous
- coastal communities who depend on the resource for their livelihood
Unfortunately, at current high level of natural mortality (Ricard et al. 2016), and considering the declining long-term projection for this stock (DFO 2011a), a rebuilding timeline to the rebuilding target cannot be calculated at this time. Outcomes from the application of this rebuilding plan will be monitored and a comprehensive review will be undertaken every 5 years, which corresponds to each science stock assessment. During each review of the plan, the factors limiting the stock’s potential for growth will be reassessed to determine if they are still influencing the stock and if a rebuilding timeline can be calculated. In the meantime, and in compliance to the PA framework, this rebuilding plan still aims at minimizing, to the extent possible, further declines of the stock. This is to preserve the stock such that, should the prevailing conditions limiting the stock’s recovery change, the stock retains the potential to rebuild.
Guided by the PA framework, management actions set out in this rebuilding plan aim to maintain low fishing mortality to support rebuilding while continuing to monitor and assess the stocks. This will be done through:
- Keeping removals from all sources to the lowest possible level by introducing new and/or stricter management measures in all fisheries that intercept American plaice. The main management measures are to maintain the directed fishery closure and reduce bycatch allocation by 5 t annually until the next periodic review of the rebuilding plan (i.e., bycatch allocation of 80 t for the 2028 season).
- Monitoring sources of fishing mortality and enforce compliance of current management measures.
- Advance current scientific knowledge in the fields of monitoring stock status, environmental conditions, and those ecosystem factors that are likely to impact the stock’s growth, habitat and health.
Acronyms used in this document
- AFS - Aboriginal Fisheries Strategy
- COSEWIC - Committee on the Status of Endangered Wildlife in Canada
- CSAS - Canadian Scientific Advisory Secretariat
- DFO - Fisheries and Oceans Canada
- DU - Designated Unit as defined by the COSEWIC (species, subspecies, variety, or geographically or genetically distinct population that may be assessed by COSEWIC, where such units are both discrete and evolutionarily significant)
- F - Fishing mortality
- FSC - Food, Social and Ceremonial fisheries by First Nations and Indigenous organizations
- FSP - Fish Stocks Provisions in the amended Fisheries Act (2019)
- GGAC - Gulf Groundfish Advisory Committee
- IFMP - Integrated Fisheries Management Plan
- kt - kiloton or 1000 x metric tons
- LRP - Biomass Limit Reference Point at the critical-cautious zone boundary of the precautionary approach framework
- M - Natural mortality
- NAFO - Northwest Atlantic Fisheries Organization
- PA - Precautionary Approach
- RR - Removal Reference is the maximum acceptable removal rate for the stock
- RV survey - Research Vessel survey (scientific) conducted annually in September
- SARA - Species at Risk Act
- sGSL - Southern Gulf of St. Lawrence
- SSB - Spawning Stock Biomass
- t - Metric ton
- TAC - Total Allowable Catch
- TRP - Target Reference Point determined by productivity objectives for the stock, broader biological considerations and social and economic objectives for the fishery
- USR - Upper Stock Reference point at the cautious-healthy zone boundary
- VPA - Virtual population analysis (a method of converting the total catch-at-age data into estimates of absolute population size and fishing mortality)
Foreword
In 2009, Fisheries and Oceans Canada (DFO) developed a Fisheries Decision-Making Framework Incorporating the Precautionary Approach (PA Policy)Footnote 1 under the auspices of the Sustainable Fisheries FrameworkFootnote 2. It outlines the departmental methodology for applying the precautionary approach (PA) to Canadian fisheries. A key component of the PA Policy requires that when a stock has declined to or below its limit reference point (LRP), a rebuilding plan must be in place with the aim of having a high probability of the stock growing above the LRP within a reasonable timeframe.
In addition, under section 6.2 of the Fish Stocks provisions (FSP) in the amended Fisheries Act (2019), rebuilding plans must be developed and implemented for prescribed major fish stocks that have declined to or below their LRP. This legislated requirement is supported by section 70 of the Fishery (General) Regulations (FGR), which set out the required contents of those rebuilding plans and establishes a timeline for each rebuilding plan’s development.
The purpose of this plan is to identify the main rebuilding objectives for American plaice in Northwest Atlantic Fisheries Organization (NAFO) Divisions 4T, as well as the management measures that will be used to achieve these objectives. This plan provides a common understanding of the basic “rules” for rebuilding the stock(s). This stock is prescribed in the Fishery (General) Regulations (section 69) and thus is subject to section 6.2 of the Fisheries Act and regulatory requirements.
The objectives and measures outlined in this plan are applicable until the stock has reached its rebuilding target. Once the stock is determined to be at the target, the stock will be managed through the standard Integrated Fisheries Management Plan (IFMP) or other fishery management processes in order to fulfill the requirements of the FSP. Management measures outlined in this rebuilding plan are mandatory, and may be modified or further measures added if they fail to result in stock rebuilding.
This rebuilding plan is not a legally binding instrument which can form the basis of a legal challenge. The plan can be modified at any time and does not fetter the Minister's discretionary powers set out in the Fisheries Act. The Minister can, for reasons of conservation or for any other valid reasons, modify any provision of the rebuilding plan in accordance with the powers granted pursuant to the Fisheries Act.
Decisions flowing from the application of this rebuilding plan must respect the rights of Indigenous peoples of Canada recognized and affirmed by section 35 of the Constitution Act (1982), including those through modern treaties. Where DFO is responsible for implementing a rebuilding plan in an area subject to a modern treaty, the rebuilding plan will be implemented in a manner consistent with that agreement. The plan should also be guided by the 1990 Sparrow decision of the Supreme Court of Canada, which found that where an Aboriginal group has a right to fish for food, social and ceremonial purposes, it takes priority, after conservation, over other uses of the resource.
The Honourable Diane Lebouthillier, P.C., M.P.
Minister of Fisheries, Oceans and the Canadian Coast Guard
1.0 Introduction and context
1.1 Population and distribution
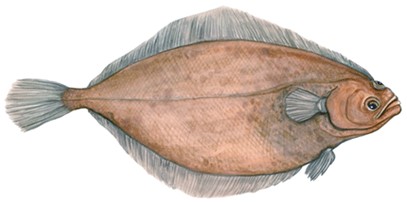
American plaice (Hippoglossoides platessoides) is a flatfish that inhabits all areas of the continental shelves on both sides of the North Atlantic. In the eastern Atlantic, they are found from the northern coasts of Finland and Russia to the English Channel, and in the western Atlantic, they range from southern Greenland and Newfoundland and Labrador down to New England. In Canadian waters, the species is managed as different stocks including the sGSL stock which is defined by North Atlantic Fishing Organization (NAFO) Division 4T (Figure 1).
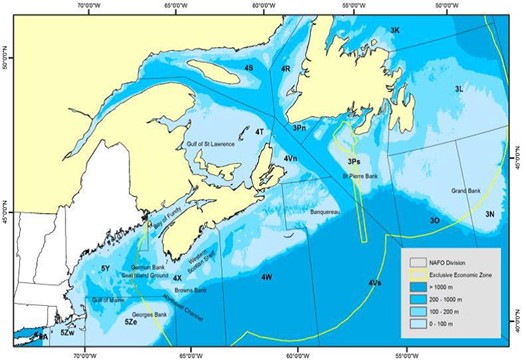
Figure 1 - Text Version
Map showing the the Northwest Atlantic Fishing Organization (NAFO) divisions and subdivisions along the Canadian Atlantic coast from Newfoundland to Nova Scotia. Division 4T is used to define the boundaries of the southern Gulf of St. Lawrence American plaice stock.
American plaice exist as pelagic eggs and larvae for the first few weeks of life. Settled juveniles prefer depths of 50-200 m and small particle sediments that they can use to partially or fully bury themselves. Adult plaice have been collected from areas with a broad range of salinities and temperatures. They are c A fishery decision-making framework incorporating the precautionary approachonsidered a cold water species. Preferred temperatures are between -0.5°C and 4°C, with individuals actively avoiding temperatures colder than - 1°C. Like juveniles, adults prefer areas with sediment suitable for burrowing but the range of suitable particle sizes increases with fish size. American plaice is broadly distributed at all depths in the sGSL.
In the 1970s, American plaice was particularly abundant in the southern Gulf, mainly on the Magdalen Shallows, in Chaleur Bay and off the south-western coast of Cape Breton. The abundance has decreased over time, particularly on the Magdalen Shallows and western parts of 4T (DFO 2011a).
1.2 Biology
American plaice is generally a slow growing and moderately long-lived species (Scott and Scott 1988). However, females grow faster and are larger than the males for any given age. Females can reach an average size of 30 cm (the commercial size limit) by about 8 years of age. It may take males 11 years or more to reach 30 cm. Plaice may live to 30 years of age in the sGSL (last observed in commercial sampling of the late 1980s) but, females generally live 17-20 years. The maximum size and age of plaice have declined over time, such that the oldest plaice in the 2010 and 2011 fisheries were 22 years of age. The decline in size and age at maturity is considered an adaptive response of the population in an attempt to maintain a high reproductive output in the face of high mortality and typically declining population size.
More recent survey data for the sGSL suggest a decline in the size and age at maturity, with median values since 1997 being 6.1 years (26.4 cm) for females and 3.7 years (18.9 cm) for males (DFO 2016). Spawning occurs in spring. American plaice produces large quantities of eggs. For example, a 40 cm plaice is capable of producing between 250,000 and 300,000 eggs, and a 65 - 70 cm plaice can produce approximately 1,500,000 eggs. Eggs float and hatch at the surface (Scott and Scott 1988). American plaice are batch or serial spawners, with only a portion of the total number of potential eggs being spawned in any single batch, and the possibility of spawning as many as 10 egg batches. An individual female can spawn for more than a month.
Eggs and larvae are pelagic. Hatched larvae are nourished by yolk reserves for the first few days after hatching and then feed primarily on copepods and other zooplankton. Larvae metamorphose into juveniles between 20 and 40 mm, with the left eye migrating to the right side of the head and the body becoming laterally flattened. Juveniles inhabit a limited depth range (< 200 m) within the range of the adults (primarily 100-300 m) (COSEWIC 2009).
Generation time for the Maritime population, which comprises the Gulf of St. Lawrence and the Scotian Shelf, was estimated by COSEWIC at 16 years (COSEWIC 2009).
1.3 Habitat requirements
American plaice exists as pelagic eggs and larvae for the first few weeks of life. Settled juveniles prefer depths of 100-200 m and small particle sediments that they can use to partially or fully bury themselves.
Adult plaice have less stringent habitat requirements. They have been collected from areas with a broad range of salinities and temperatures. In the wild, preferred temperatures appear to be between -0.5 and 4°C, with individuals perhaps actively avoiding temperatures much colder than -1°C. Similar to juveniles, adults prefer areas with sediment suitable for burrowing but the range of suitable particle sizes probably increases with fish size. Plaice may occupy non-preferential physical habitats (temperature, sediment type, etc.) in order to gain access to abundant prey (COSEWIC 2009).
1.4 Ecosystem interactions
American plaice are found almost everywhere in the sGSL and prey on a variety of species. They are considered to be opportunistic feeders at all life stages and will feed on any prey items available of appropriate size for ingestion.
The ecosystem in the sGSL has changed dramatically in recent decades. Abundances of many large-bodied demersal fishes (e.g., Atlantic cod, white hake, American plaice, and skates) have declined to very low levels, and continue to decrease. These fishes currently have elevated natural mortality at adult sizes. In contrast, small non-exploited fishes such as alligator fish, capelin and sculpins have increased in abundance (Benoît and Swain 2008). More recently, pelagic forage fish species such as herring (DFO 2022a) and mackerel (DFO 2021a) have also declined. Grey seals (year-round residents) and harp seals (present in winter and early spring) are also at high levels of abundance (DFO 2020, DFO 2022b) and have contributed to important increase of natural mortality of several other bottom-dwelling species (Neuenhoff et al. 2019 and Rossi et al. 2021).
American plaice is a known prey item for harp and grey seals (Benoît and Bowen 1990a, 1990b). Predation mortality imposed by grey seals is now thought to be the likely reason for the increased natural mortality of adult American plaice in the sGSL (Swain and Benoît 2015).
1.5 Fishery
The sGSL groundfish fishery consists of nine major stocks (Table 1), distributed and managed within the North Atlantic Fishing Organization (NAFO) Division 4RST and subdivision 4Vn (Figure 1). Although the present rebuilding plan focuses on American plaice, the management of this stock is closely linked to all other groundfish stocks in NAFO Divisions 4T.
Since the early 1990s, unique management measures have been put in place to address the serious decline of many groundfish populations, and in the worst cases their collapse, resulting in the introduction of moratoria and significant quota reductions. Unfortunately, the outlooks for many of these stocks remain precarious, with 5 out of 9 stocks currently in the critical zone. Of these, 4 are prescribed in the Fishery (General) Regulations (section 69) and therefore subject to section 6.2 of the Fisheries Act and regulatory requirements (Table 1).
Four of these stocks have also been assessed by the Committee on the Status of Endangered Wildlife in Canada (COSEWIC) as potential candidates for listing under the Species at Risk Act (SARA) (Table 1; both Redfish species are being considered as one stock for the purpose of management).
Table 1. Most common groundfish stocks harvested in the southern Gulf of St. Lawrence.
Atlantic Cod 1, Gadus morhua
- Stock area (NAFO divisions): 4T - 4Vn
- Most recent fishery closure/moratorium: Since May 2009
- Stock in critical zone2: Since 1990
- Population assessed by COSEWIC3: Endangered, 2010
Atlantic Halibut, Hippoglossus hippoglossus
- Stock area (NAFO divisions): 4T - 4R - 4S
American plaice1, Hippoglossoides platessoides
- Stock area (NAFO divisions): 4T
- Most recent fishery closure/moratorium: Since May 2017
- Stock in critical zone2: Since 1993
- Population assessed by COSEWIC3: Threatened, 2009
Greenland halibut (turbot or black halibut), Reinhardtius hippoglossoides
- Stock area (NAFO divisions): 4T - 4R - 4S
White Hake1, Urophycis tenuis
- Stock area (NAFO divisions): 4T
- Most recent fishery closure/moratorium: Since January 1995
- Stock in critical zone2: Since 1995
- Population assessed by COSEWIC3: Endangered, 2010
Winter Flounder1, Pseudopleuronectes americanus
- Stock area (NAFO divisions): 4T
- Most recent fishery closure/moratorium: Since February 2023
- Stock in critical zone2: Since 2006
Witch Flounder, Glypocephalus cynoglossus
- Stock area (NAFO divisions): 4T - 4R - 4S
Redfish, Sebastes fasciatus and Sebastes mentalla
- Stock area (NAFO divisions): Unit 1: 4RST and 3Pn4Vn (January to May)
- Population assessed by COSEWIC3:
- S. mentella: Endangered, 2010
- S. fasciatus: Threatened, 2010
Yellowtail Flounder, Pleuronectes ferrugineus
- Stock area (NAFO divisions): 4T
- Most recent fishery closure/moratorium: Since February 2023
- Stock in critical zone2: Since 2009
1 Stock prescribed in the Fishery (General) Regulations (section 69) and thus is subject to section 6.2 of the Fisheries Act and regulatory requirements.
2 Year since the stock has been assessed in the critical zone of the PA Framework.
3 Status as presented in the latest COSEWIC assessment and status report. At the time of publication of this Rebuilding Plan, no decisions regarding listing stocks under the SARA have been made.
Most groundfish stocks managed within NAFO Division 4T overlap in both space and time, which increases the likelihood of species under moratorium or other non-targeted groundfish species being caught incidentally in other directed groundfish fisheries. As management measures are being developed for specific fisheries, it is critical to consider all potential interactions and sources of fishing mortality. Several commercial groundfish fisheries are carried out in the sGSL and bycatch of American plaice can still occur in these fisheries (Table 1). American plaice is also harvested as part of a recreational fishery, and by First Nations for community harvesting, and for Food, Social and Ceremonial (FSC) purposes.
The Gulf Groundfish Advisory Committee (GGAC), which brings together harvesters, processors, Indigenous groups, DFO and provincial government representatives from the 4 Atlantic Provinces and Quebec, provides advice and recommendations to the Department for the management of commercially exploited Gulf of St. Lawrence groundfish stocks (NAFO Divisions 4RST, 3Pn and subdivision 4Vn). The advisory committee meets every 2 years and serves as a forum for sharing results of recent stock assessments, for industry stakeholders and right holders to address issues affecting groundfish fisheries, and, most importantly, for DFO to solicit input from committee members on key management decisions.
In 2017, a Groundfish - Gulf of St. Lawrence NAFO Subdivisions 3Pn, 4Vn and Divisions 4RST Integrated Fisheries Management Plan (IFMP)Footnote 3 was developed by DFO in consultation with the GGAC. The IFMP provides detailed operational management information pertaining to mixed groundfish fisheries in the sGSL, including the American plaice fishery. An update to the Gulf Groundfish IFMP is underway and will account for stocks that are subject to a rebuilding plan, as all management measures outlined in the plan will supersede or will be in addition to those in the IFMP.
1.6 Overview of the fishery socio-economic and cultural importance
American plaice in the southern Gulf of St. Lawrence (NAFO Division 4T) has been under quota management since 1977. It was exploited mainly by longlines in the 1930s, but by the 1960s most landings were made by seines and otter trawls. With the growth of mobile gear fleet sectors during the 1960s, a large proportion of plaice catches in 4T (30-40% by weight) was commercially-undersized and discarded at sea. Since the moratorium in 2017 Plaice have since been caught as a bycatch in various fisheries, either by fixed or mobile gear, with the dominant sector being seines operated by vessels less than 45 feet.
American plaice landings in NAFO Division 4T ranged between 6,000 t and 12,000 t during the 1960s to the late 1980s. The reported landings do not account for discarding that was a common practice in the mobile gear plaice fishery until 1993 (Morin 2012). Starting in 1993, the fishing effort on American plaice and the landings were greatly reduced through the introduction of management measures (quota reduction and increased mesh size for mobile gear). Reduced fishing effort on multiple groundfish stocks, including American plaice, was also observed following the closure of the cod fishery from 1993 to 1998. Since the closure of the cod fishery, American plaice landings have steadily declined and in recent years have been at their lowest historical level (Ricard et al. 2016).
On May 15, 2017, a moratorium was imposed on the directed commercial fishery for 4T American plaice. An allocation of 250 t was also implemented to cover bycatches of American plaice in other commercial groundfish fisheries (note: the allocation was reduced to 100 t in 2024). The mobile gear (otter trawl and Danish/Scottish seine) witch flounder fishery off Cape Breton and the gillnet Greenland halibut fishery off the Gaspé Peninsula have been the main sources of bycatch. Since the moratorium, from 2017 to 2020, American plaice was reported as bycatch when harvesters were directing for Greenland halibut (98% of total American plaice bycatch) and witch flounder (2%). In 2020, 52 commercial groundfish licence holders reported a total of 58 t in landings of American plaice in NAFO Division 4T, with an associated value of $55,109 in 2020 (Table 2).
The landed value of the 4T American plaice harvest in Eastern Canada between 2011 and 2020 was distributed between the provinces of:
- Quebec (79%)
- Prince Edward Island (13%)
- Nova Scotia (8%)
Most groundfish harvesters in the sGSL also have access (i.e., fishing licences) to other species of greater commercial value, such as snow crab, shrimp, and lobster, while a limited number of harvesters have specialized in groundfish fishing only.
Table 2. American plaice landings (directed and bycatch fisheries) in the southern Gulf of St. Lawrence (NAFO Division 4T) from 2011 to 2020
2011
- TAC (t): 500
- Directed landings
- Quantity (t): 39
- Value ($) : 62,146
- Bycatch landings
- Quantity (t): 57
- Value ($): 82, 890
- Total landings
- Quantity (t): 96
- Value ($): 145, 036
- Price ($/kg): 1.51
- Active harvesters: 52
2012
- TAC (t): 250
- Directed landings
- Quantity (t): 33
- Value ($): 52, 034
- Bycatch landings
- Quantity (t): 45
- Value ($): 35, 426
- Total landings
- Quantity (t): 68
- Value ($): 87, 460
- Price ($/kg): 1.29
- Active harvesters: 59
2013
- TAC (t): 250
- Directed landings
- Quantity (t): 15
- Value ($): 16,163
- Bycatch landings
- Quantity (t): 25
- Value ($): 23, 451
- Total landings
- Quantity (t): 40
- Value ($): 39, 614
- Price ($/kg): 0.99
- Active harvesters: 55
2014
- TAC (t): 250
- Directed landings
- Quantity (t): 2
- Value ($): 847
- Bycatch landings
- Quantity (t): 30
- Value ($): 23, 912
- Total landings
- Quantity (t): 32
- Value ($): 24, 759
- Price ($/kg): 0.78
- Active harvesters: 52
2015
- TAC (t): 250
- Directed landings
- Quantity (t): 8
- Value ($): 23, 729
- Bycatch landings
- Quantity (t): 32
- Value ($): 34, 430
- Total landings
- Quantity (t): 40
- Value ($): 58, 159
- Price ($/kg): 1.46
- Active harvesters: 57
2016
- TAC (t): 2
- Directed landings
- Quantity (t): 4, 182
- Value ($): 37
- Bycatch landings
- Quantity (t): 37
- Value ($) : 33, 323
- Total landings
- Quantity (t): 39
- Value ($): 37, 505
- Price ($/kg): 0.96
- Active harvesters: 69
20171
- TAC (t): 250
- Directed landings
- Quantity (t): Closed
- Bycatch landings
- Quantity (t): 69
- Value ($): 71, 967
- Total landings
- Quantity (t): 69
- Value ($): 71, 967
- Price ($/kg): 1.04
- Active harvesters: 45
2018
- TAC (t): 250
- Directed landings
- Quantity (t): Closed
- Bycatch landings
- Quantity (t): 64
- Value ($): 64, 159
- Total landings
- Quantity (t): 64
- Value ($): 64, 159
- Price ($/kg): 1.01
- Active harvesters 40:
2019
- TAC (t): 250
- Directed landings
- Quantity (t): Closed
- Bycatch landings
- Quantity (t): 87
- Value ($): 88, 131
- Total landings
- Quantity (t): 87
- Value ($): 88, 131
- Price ($/kg): 1.02
- Active harvesters: 50
20202
- TAC (t): 250
- Directed landings
- Quantity (t): Closed
- Bycatch landings
- Quantity (t): 58
- Value ($): 55, 109
- Total landings
- Quantity (t): 58
- Value ($): 55, 109
- Price ($/kg): 0.94
- Active harvesters: 52
1 Directed fishery was closed, therefore only bycatch landings are reported since 2017.
2 Preliminary data.
Catches from the recreational and FSC fisheries, and catches from the scientific RV survey and sentinel fishery are not included since removal estimates are not available.
Source: DFO Gulf and Québec Regions.
There is currently an authorized groundfish recreational fishery with potential access to American plaice in the waters adjacent to the Maritime Provinces in the sGSLFootnote 4. This fishery is open for 5 weeks or less annually. Anglers are able to retain, in any day, a bag limit of 15 groundfish of all species, including American plaice. There is also the spring-summer recreational groundfish fishery in the Saguenay Fjord, St. Lawrence Estuary and Gulf of St. Lawrence with potential access to American plaiceFootnote 5.
A winter recreational groundfish fishery, commonly known as ice fishing, is conducted in the province of Quebec and is open for approximately 3 months from January to March in the Saguenay FjordFootnote 6. The fishery is subject to a daily bag limit of 5 groundfish. Although redfish is the main species caught, American plaice may be caught on occasion. No removal estimates are available for American plaice in any of these recreational fisheries, but the amount is likely to be minimal (from qualitative field observations obtained from Conservation and Protection fishery officers).
Under the Aboriginal Community Fishing Licence Regulations and Aboriginal Fisheries Strategy (AFS) agreementsFootnote 7, Indigenous communities can catch American plaice if they hold groundfish licences. American plaice can also be harvested as part of an Indigenous FSC fishery. FSC fisheries are managed, where licensed, under the Aboriginal Community Fishing Licence Regulations and AFS agreements. The species caught under FSC licence conditions are not allowed to be sold and there are no estimates available for removals of American plaice in this fishery. However, the quantity is likely minimal (from qualitative field observations obtained from Conservation and Protection fishery officers).
1.7 Involvement of stakeholder and Indigenous groups in the development of the plan
A first meeting was held on September 24, 2020, with industry stakeholders and Indigenous partners to discuss the rebuilding plan development process and to solicit participation in a Gulf Groundfish Rebuilding Plans Working Group that would assist the department in developing the plans. Due to Covid restrictions limiting face-to-face meetings, DFO developed a questionnaire outlining rebuilding objectives and proposed management measures as an alternative means to solicit input from stakeholders and rights holders. The questionnaire was sent to members of the Gulf Groundfish Rebuilding Plan Working Group on December 15, 2020. An information session with Indigenous partners was also held on January 26, 2021.
The purpose of the questionnaire was to initiate discussions and gather views on rebuilding options for four groundfish stocks, including American plaice. Stakeholders and rights holders were invited to comment on the proposed objectives and rebuilding measures, and to recommend alternative or other rebuilding measures in addition to the management measures presented. Although consolidated comments were sought through the Gulf Groundfish Rebuilding Plan Working Group, any member from the fishing industry, First Nations or Indigenous organizations could submit individual comments in writting.
2.0 Stock status and stock trends
In 2003, the Privy Council Office, on behalf of the Government of Canada, published a framework applicable to all federal government departments that set out guiding principles for the application of precaution to decision-making about risks of serious or irreversible harm where there is a lack of full scientific certainty.
A Fisheries Decision-Making Framework Incorporating the Precautionary Approach was developed (DFO 2009), and applies where decisions on harvest strategies or harvest rates for a stock must be taken to determine TAC or other measures to control harvests. The framework applies to key harvested stocks managed by DFO: those stocks that are the specific and intended targets of a fishery, whether in a commercial, recreational or subsistence fishery. In applying the framework, all removals of these stocks from all types of fishing must be taken into account.
A limit reference point (LRP) as defined by the PA Framework (DFO 2009) was first estimated for NAFO Division 4T American plaice stock in 2012 (DFO 2012) and updated in 2016 (Ricard et al. 2016) (Table 3). Since this stock is currently assessed and managed every 5 years, interim biomass and LRP indicators were later developed to characterize stock status in years between assessments.
Table 3. Summary of the Precautionary Approach (PA) framework reference points and COSEWIC/SARA status for NAFO Division 4T American plaice.
- Limit Reference Point (LRP): 139,135 t of spawning stock biomass or a catch index of 33,700 t (19.53 kg per tow)1. Source: Ricard et al. 2016
- Upper Stock Reference (USR): not available
- Target Reference Point (TRP): not available
- Removal Reference (RR): not available
COSEWIC status: Threatened (COSEWIC 2009)
SARA status: No schedule, no status
1 Catch rate index LRP equivalent: the 3-year moving average of the annual Research Vessel (RV) survey biomass index for commercial-sized American plaice (≥ 30 cm total length) used as the indicator of stock status in the interim years of the multi-year management cycle. This index is to be compared to the LRP value for this stock, adjusted to the scale of the biomass index which is not corrected for survey gear catchability. The re-scaled LRP is 33,700 t of trawlable biomass in September, equivalent to a catch rate from the survey of 19.53 kg per tow (Ricard et al. 2016).
The last full assessment of the American plaice stock of the sGSL was completed in March 2016 with advice for the May 2016 to May 2021 fisheries period (DFO 2016; Ricard et al. 2016). The assessment presented the steady decline of the SSB over the 1974 to 2015 period and indicated that the stock has been in the critical zone of the precautionary approach framework since 1993 (Figure 2). In 2015, the median of the SSB estimate was 55,000 t, representing 40% of the LRP of 139,000 t.
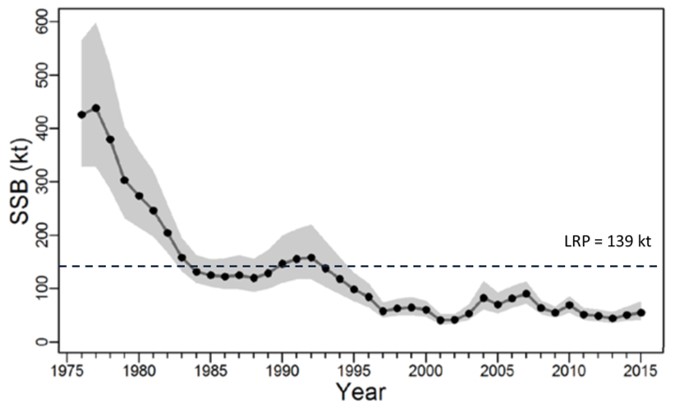
Figure 2 - Text version
Graphic presenting the median estimate of spawning stock biomass (SSB) for the 1976 to 2015 time period. The SSB was about 350 kt in the late 1970s decreasing rapidly to 100 kt or less by 1984. Estimated SSB has varied between 50 and 80 kt since 1995 and was estimated at 55 kt in 2015. The grey band shows the 95% credibility interval; a narrower grey band indicates stronger credibility around the average estimates (black line).
| Year | Mean spawning stock biomass (SSB) in metric tons x 1000 (kt) | Lower value of the 95% credibility interval of the SSB estimate (kt) | Upper value of the 95% credibility interval of the SSB estimate (kt) |
|---|---|---|---|
| 1976 | 426 | 328 | 566 |
| 1977 | 438 | 328 | 600 |
| 1978 | 380 | 286 | 518 |
| 1979 | 303 | 232 | 403 |
| 1980 | 274 | 214 | 358 |
| 1981 | 246 | 197 | 321 |
| 1982 | 204 | 167 | 258 |
| 1983 | 158 | 132 | 196 |
| 1984 | 131 | 110 | 162 |
| 1985 | 125 | 104 | 155 |
| 1986 | 122 | 98 | 157 |
| 1987 | 125 | 99 | 162 |
| 1988 | 120 | 94 | 156 |
| 1989 | 129 | 99 | 172 |
| 1990 | 146 | 111 | 199 |
| 1991 | 155 | 117 | 211 |
| 1992 | 158 | 117 | 221 |
| 1993 | 137 | 103 | 189 |
| 1994 | 118 | 89 | 158 |
| 1995 | 99 | 76 | 129 |
| 1996 | 84 | 65 | 110 |
| 1997 | 58 | 45 | 74 |
| 1998 | 63 | 49 | 80 |
| 1999 | 64 | 50 | 84 |
| 2000 | 60 | 47 | 77 |
| 2001 | 41 | 32 | 53 |
| 2002 | 42 | 34 | 52 |
| 2003 | 53 | 42 | 71 |
| 2004 | 82 | 61 | 114 |
| 2005 | 70 | 53 | 93 |
| 2006 | 81 | 63 | 105 |
| 2007 | 90 | 72 | 114 |
| 2008 | 64 | 52 | 78 |
| 2009 | 55 | 45 | 66 |
| 2010 | 69 | 55 | 86 |
| 2011 | 51 | 41 | 63 |
| 2012 | 48 | 38 | 61 |
| 2013 | 44 | 35 | 57 |
| 2014 | 50 | 39 | 66 |
| 2015 | 55 | 42 | 76 |
In that same 2016 assessment, it was indicated that the 3-year moving average of the September research vessel survey biomass index for commercial-sized plaice (≥ 30 cm) would be used as the indicator of stock status in the interim years of the multi-year management cycle.
The research vessel biomass indices for commercial sizes of American plaice in the sGSL indicate that there has been no improvement in status for this stock since their last 2 updates of indices of abundance (DFO 2019b, DFO 2021b). For 2020, the 3-year (2018 to 2020) average value of the index is 4,665 t of trawlable biomass (equivalent to 2.7 kg per tow). The index value has been increasing slightly since 2018, but is still well below the scaled LRP of 33,770 t trawlable biomass (equivalent to 19.53 kg per tow) (Figure 3).
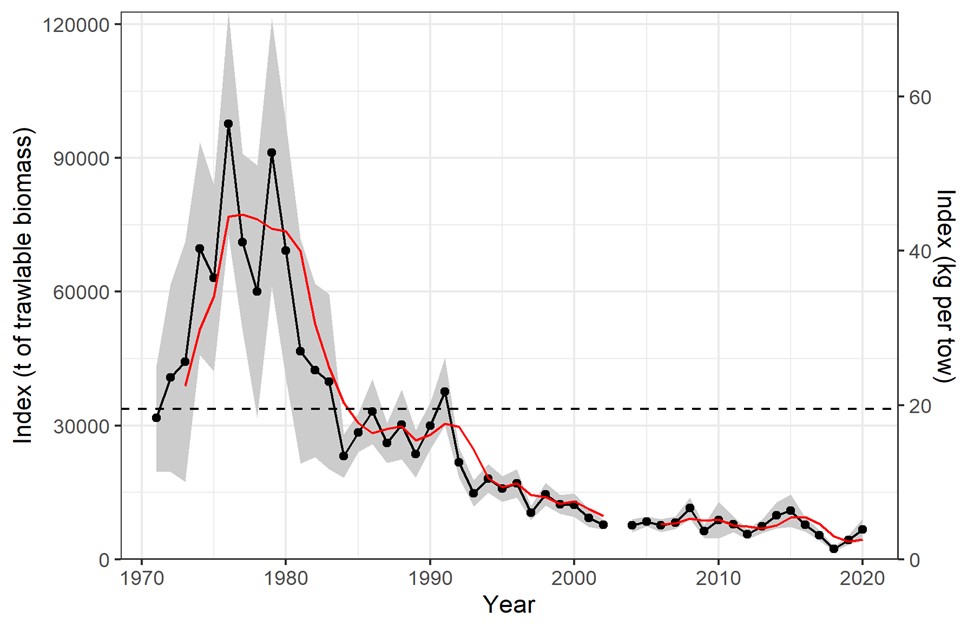
Figure 3 - Text version
For 2020, the three-year (2018 to 2020) average value of the index is 4,665 t of trawlable biomass in September (equivalent to 2.7 kg per tow). The index value increased in 2019 and 2020, but is still well below the re-scaled Limit Reference Point (LRP) of trawlable biomass index in September of 33,770 t (equivalent to 19.53 kg per tow). The grey band shows the 95% confidence interval; a narrower grey band indicates stronger confidence around the average estimates (black line).
| Year | Mean kg per tow (kg/tow) | Lower value of the 95% cconfidence interval (kg/tow) | Upper value of the 95% confidence interval (kg/tow) | Equivalent trawlable biomass in tons (t) | Trawlable biomass lower value of the 95% confidence interval (t) | Trawlable biomass upper value of the 95% confidence interval (t) | Three-year moving average of the trawlable biomass (t) |
|---|---|---|---|---|---|---|---|
| 1971 | 19.12 | 11.90 | 26.34 | 33073 | 20588 | 45559 | |
| 1972 | 24.60 | 11.85 | 37.36 | 42547 | 20493 | 64602 | |
| 1973 | 26.74 | 10.46 | 43.03 | 46248 | 18090 | 74405 | 61522 |
| 1974 | 42.08 | 27.65 | 56.51 | 72769 | 47820 | 97718 | 78908 |
| 1975 | 38.09 | 25.44 | 50.73 | 65869 | 44001 | 87737 | 86620 |
| 1976 | 59.02 | 43.86 | 74.18 | 102062 | 75850 | 128275 | 104576 |
| 1977 | 42.95 | 30.96 | 54.94 | 74276 | 53541 | 95011 | 103674 |
| 1978 | 38.66 | 20.43 | 56.88 | 66850 | 35337 | 98362 | 107216 |
| 1979 | 55.12 | 36.94 | 73.30 | 95321 | 63889 | 126754 | 106709 |
| 1980 | 41.84 | 24.54 | 59.15 | 72362 | 42440 | 102285 | 109134 |
| 1981 | 28.19 | 12.94 | 43.43 | 48746 | 22382 | 75109 | 101382 |
| 1982 | 25.60 | 13.86 | 37.33 | 44264 | 23976 | 64553 | 80649 |
| 1983 | 24.46 | 12.42 | 36.50 | 42302 | 21476 | 63129 | 67597 |
| 1984 | 14.17 | 11.12 | 17.21 | 24496 | 19224 | 29768 | 52483 |
| 1985 | 17.61 | 14.15 | 21.08 | 30462 | 24476 | 36448 | 43115 |
| 1986 | 19.57 | 15.24 | 23.89 | 33837 | 26352 | 41322 | 35846 |
| 1987 | 15.15 | 12.12 | 18.17 | 26193 | 20957 | 31430 | 36400 |
| 1988 | 19.19 | 12.30 | 26.08 | 33181 | 21269 | 45093 | 39282 |
| 1989 | 14.27 | 11.05 | 17.49 | 24678 | 19117 | 30239 | 35587 |
| 1990 | 18.06 | 14.90 | 21.22 | 31231 | 25767 | 36694 | 37342 |
| 1991 | 22.73 | 18.10 | 27.36 | 39304 | 31298 | 47309 | 38081 |
| 1992 | 13.10 | 11.03 | 15.17 | 22653 | 19068 | 26239 | 36747 |
| 1993 | 9.10 | 7.17 | 11.04 | 15741 | 12396 | 19087 | 30878 |
| 1994 | 10.94 | 9.01 | 12.87 | 18923 | 15588 | 22258 | 22528 |
| 1995 | 9.56 | 7.81 | 11.30 | 16528 | 13512 | 19544 | 20296 |
| 1996 | 10.26 | 8.34 | 12.18 | 17743 | 14416 | 21070 | 20957 |
| 1997 | 6.29 | 5.33 | 7.25 | 10876 | 9212 | 12540 | 17718 |
| 1998 | 8.83 | 7.28 | 10.39 | 15275 | 12584 | 17967 | 17192 |
| 1999 | 7.44 | 5.99 | 8.89 | 12869 | 10356 | 15382 | 15296 |
| 2000 | 7.23 | 5.52 | 8.94 | 12500 | 9546 | 15455 | 16268 |
| 2001 | 5.59 | 4.41 | 6.77 | 9675 | 7634 | 11716 | 14185 |
| 2002 | 4.70 | 4.02 | 5.38 | 8129 | 6952 | 9307 | 12160 |
| 2003 | 7.11 | 5.56 | 8.65 | 12291 | 9615 | 14967 | 11997 |
| 2004 | 4.83 | 3.75 | 5.92 | 8360 | 6491 | 10229 | 11501 |
| 2005 | 4.98 | 4.16 | 5.80 | 8610 | 7198 | 10023 | 11740 |
| 2006 | 4.56 | 3.66 | 5.46 | 7888 | 6329 | 9447 | 9900 |
| 2007 | 4.96 | 4.09 | 5.83 | 8581 | 7082 | 10081 | 9850 |
| 2008 | 6.94 | 5.48 | 8.39 | 11995 | 9474 | 14516 | 11348 |
| 2009 | 3.78 | 2.91 | 4.65 | 6538 | 5041 | 8036 | 10878 |
| 2010 | 5.33 | 2.85 | 7.80 | 9216 | 4936 | 13495 | 12016 |
| 2011 | 4.72 | 3.65 | 5.78 | 8156 | 6311 | 10000 | 10511 |
| 2012 | 3.39 | 2.67 | 4.12 | 5870 | 4619 | 7120 | 10205 |
| 2013 | 4.47 | 3.53 | 5.41 | 7733 | 6109 | 9356 | 8826 |
| 2014 | 5.94 | 4.19 | 7.69 | 10277 | 7253 | 13300 | 9925 |
| 2015 | 6.60 | 4.41 | 8.79 | 11414 | 7621 | 15207 | 12621 |
| 2016 | 4.69 | 3.74 | 5.65 | 8118 | 6469 | 9766 | 12758 |
| 2017 | 3.23 | 2.52 | 3.95 | 5591 | 4360 | 6822 | 10599 |
| 2018 | 1.39 | 1.02 | 1.77 | 2410 | 1757 | 3064 | 6551 |
| 2019 | 2.62 | 1.97 | 3.26 | 4524 | 3412 | 5636 | 5174 |
| 2020 | 4.08 | 2.57 | 5.59 | 7060 | 4450 | 9669 | 6123 |
Natural mortality has been higher than fishing mortality since the mid-1990s. Fishing mortality of individuals aged 10 and older peaked in 1991 and has decreased to a negligible level since. Natural mortality of individuals aged 4 to 9 is currently estimated to be lower than in the mid-1990s while it has steadily increased to an elevated level for individuals aged 10 and older (Figure 4). Recruitment started a steep decrease in the late 1970’s and still shows a declining trend (Figure 5) (Ricard et al. 2016).
Based on the latest stock assessment, under the prevailing conditions, the SSB was expected to remain in the critical zone (with >95% chance of being below LRP) during the 2016 to 2021 period, even in the absence of fishing (Ricard et al. 2016). The RV biomass index for commercial-sized (≥ 30 cm total length) American plaice in the sGSL indicates that there has been no improvement in status since its last 2016 assessment and, despite a small increase in the index value in 2019 and 2020, the commercial biomass remains near the record low level of 2018 (DFO 2021b). These results support the projections of the last assessment and suggest that the prospects for rebuilding this stock remain low, even in the absence of fishing (Ricard et al. 2016).
Long term projection was published in 2011 as part of the Maritime DU recovery potential assessment for American plaice (DFO 2011a). The 48-year (2010-2057) projection was done using the results of an age-based population model (Virtual Population Analysis or VPA). Under productivity conditions observed over the 1990-2010 time period and with no harvesting, spawning stock numbers will decline below the reference level with a 55% probability. For the projection, the reference level was defined using the COSEWIC criterion for threatened status, which corresponded to 70% of the 2009 spawning stock numbers (see DFO 2011a for details).
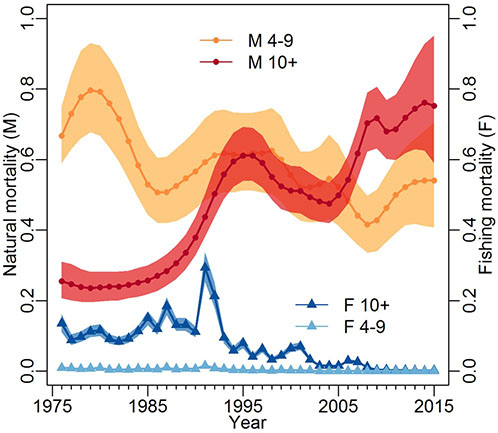
Figure 4 - Text version
Natural mortality (M) for American plaice ages 4 to 9 was estimated to have decreased from about 0.75 (53% per year) in the late 1970s to about 0.50 (39% per year) since 2005. This contrasts with the estimated natural mortality for plaice aged 10+ for which M was estimated to have been about 0.25 (22% per year) in the 1970s and rising rapidly to greater than 0.50 (39% per year) since 1995. Natural mortality for age 10+ plaice is estimated to exceed that for plaice 4 - 9 years, since 2008. Fully recruited fishing mortality on age 10+ was estimated to have peaked in 1992 at just over 0.3 but has been less than 0.01 since 2011. The colored band shows the 95% credibility interval; a narrower colored band indicates stronger credibility around the average estimates (dark colored line).
| Year | Mean natural mortality (M), ages 4 to 9 | Lower value of the 95% credibility interval (M 4-9) | Upper value of the 95% credibility interval (M 4-9) | Mean natural mortality (M), ages 10+ | Lower value of the 95% credibility interval (M 10+) | Upper value of the 95% credibility interval (M 10+) | Mean fishing mortality (F), ages 4 to 9 | Lower value of the 95% credibility interval (F 4-9) | Upper value of the 95% credibility interval (F 4-9) | Mean fishing mortality (F), ages 10+ | Lower value of the 95% credibility interval (F 10+) | Upper value of the 95% credibility interval (F 10+) |
|---|---|---|---|---|---|---|---|---|---|---|---|---|
| 1976 | 0.6668 | 0.5894 | 0.7523 | 0.2546 | 0.2073 | 0.3101 | 0.0096 | 0.0064 | 0.0143 | 0.1355 | 0.1108 | 0.1619 |
| 1977 | 0.7298 | 0.6289 | 0.8433 | 0.2467 | 0.2007 | 0.3037 | 0.0081 | 0.0053 | 0.0125 | 0.0884 | 0.0738 | 0.1044 |
| 1978 | 0.7771 | 0.6597 | 0.9086 | 0.2391 | 0.1972 | 0.2896 | 0.0059 | 0.0038 | 0.0091 | 0.0975 | 0.0831 | 0.1131 |
| 1979 | 0.7963 | 0.6775 | 0.9301 | 0.2356 | 0.1961 | 0.2814 | 0.0076 | 0.0049 | 0.0115 | 0.1126 | 0.0964 | 0.1295 |
| 1980 | 0.7921 | 0.6673 | 0.9231 | 0.2374 | 0.1978 | 0.2825 | 0.0091 | 0.0061 | 0.0135 | 0.1157 | 0.0993 | 0.1330 |
| 1981 | 0.7588 | 0.6343 | 0.8878 | 0.2393 | 0.1999 | 0.2816 | 0.0045 | 0.0030 | 0.0063 | 0.0914 | 0.0786 | 0.1051 |
| 1982 | 0.7150 | 0.5948 | 0.8432 | 0.2399 | 0.2012 | 0.2829 | 0.0057 | 0.0039 | 0.0079 | 0.0840 | 0.0727 | 0.0961 |
| 1983 | 0.6518 | 0.5433 | 0.7745 | 0.2451 | 0.2073 | 0.2849 | 0.0043 | 0.0029 | 0.0058 | 0.0927 | 0.0806 | 0.1053 |
| 1984 | 0.5835 | 0.4911 | 0.6968 | 0.2505 | 0.2114 | 0.2926 | 0.0067 | 0.0046 | 0.0092 | 0.1139 | 0.0996 | 0.1289 |
| 1985 | 0.5295 | 0.4432 | 0.6405 | 0.2571 | 0.2179 | 0.3002 | 0.0061 | 0.0043 | 0.0086 | 0.1501 | 0.1303 | 0.1707 |
| 1986 | 0.5069 | 0.4207 | 0.6052 | 0.2701 | 0.2279 | 0.3145 | 0.0054 | 0.0037 | 0.0079 | 0.1201 | 0.1041 | 0.1367 |
| 1987 | 0.5081 | 0.4194 | 0.6083 | 0.2841 | 0.2426 | 0.3318 | 0.0100 | 0.0068 | 0.0148 | 0.1838 | 0.1592 | 0.2103 |
| 1988 | 0.5251 | 0.4263 | 0.6318 | 0.3059 | 0.2607 | 0.3563 | 0.0056 | 0.0038 | 0.0084 | 0.1315 | 0.1136 | 0.1511 |
| 1989 | 0.5468 | 0.4387 | 0.6547 | 0.3360 | 0.2902 | 0.3876 | 0.0070 | 0.0046 | 0.0105 | 0.1315 | 0.1140 | 0.1506 |
| 1990 | 0.5664 | 0.4605 | 0.6832 | 0.3792 | 0.3284 | 0.4368 | 0.0063 | 0.0042 | 0.0093 | 0.1115 | 0.0964 | 0.1275 |
| 1991 | 0.5929 | 0.4843 | 0.7169 | 0.4367 | 0.3813 | 0.5023 | 0.0153 | 0.0103 | 0.0223 | 0.2937 | 0.2526 | 0.3377 |
| 1992 | 0.6119 | 0.4970 | 0.7374 | 0.5030 | 0.4369 | 0.5797 | 0.0086 | 0.0057 | 0.0126 | 0.2132 | 0.1792 | 0.2513 |
| 1993 | 0.6177 | 0.5076 | 0.7419 | 0.5580 | 0.4879 | 0.6347 | 0.0063 | 0.0043 | 0.0091 | 0.0955 | 0.0793 | 0.1137 |
| 1994 | 0.6136 | 0.5066 | 0.7337 | 0.5942 | 0.5233 | 0.6769 | 0.0035 | 0.0025 | 0.0051 | 0.0589 | 0.0484 | 0.0703 |
| 1995 | 0.6119 | 0.5130 | 0.7313 | 0.6110 | 0.5396 | 0.6926 | 0.0032 | 0.0022 | 0.0046 | 0.0800 | 0.0652 | 0.0954 |
| 1996 | 0.6181 | 0.5114 | 0.7331 | 0.6112 | 0.5398 | 0.6898 | 0.0021 | 0.0014 | 0.0032 | 0.0406 | 0.0330 | 0.0483 |
| 1997 | 0.6182 | 0.5062 | 0.7379 | 0.5910 | 0.5212 | 0.6683 | 0.0029 | 0.0020 | 0.0042 | 0.0634 | 0.0522 | 0.0753 |
| 1998 | 0.6251 | 0.5017 | 0.7460 | 0.5502 | 0.4858 | 0.6210 | 0.0015 | 0.0010 | 0.0022 | 0.0329 | 0.0274 | 0.0392 |
| 1999 | 0.5996 | 0.4811 | 0.7233 | 0.5244 | 0.4599 | 0.5945 | 0.0030 | 0.0021 | 0.0044 | 0.0442 | 0.0370 | 0.0521 |
| 2000 | 0.5560 | 0.4469 | 0.6667 | 0.5119 | 0.4508 | 0.5828 | 0.0022 | 0.0015 | 0.0031 | 0.0650 | 0.0551 | 0.0765 |
| 2001 | 0.5195 | 0.4266 | 0.6228 | 0.5105 | 0.4475 | 0.5800 | 0.0024 | 0.0016 | 0.0033 | 0.0702 | 0.0597 | 0.0824 |
| 2002 | 0.5209 | 0.4213 | 0.6220 | 0.4929 | 0.4314 | 0.5615 | 0.0018 | 0.0013 | 0.0025 | 0.0328 | 0.0277 | 0.0388 |
| 2003 | 0.5293 | 0.4239 | 0.6364 | 0.4813 | 0.4242 | 0.5448 | 0.0005 | 0.0003 | 0.0007 | 0.0154 | 0.0129 | 0.0181 |
| 2004 | 0.5455 | 0.4308 | 0.6699 | 0.4750 | 0.4193 | 0.5353 | 0.0003 | 0.0002 | 0.0004 | 0.0153 | 0.0128 | 0.0181 |
| 2005 | 0.5223 | 0.4130 | 0.6426 | 0.4984 | 0.4398 | 0.5609 | 0.0004 | 0.0003 | 0.0005 | 0.0151 | 0.0127 | 0.0178 |
| 2006 | 0.4832 | 0.3853 | 0.5906 | 0.5427 | 0.4752 | 0.6117 | 0.0005 | 0.0004 | 0.0006 | 0.0294 | 0.0246 | 0.0346 |
| 2007 | 0.4414 | 0.3580 | 0.5307 | 0.6171 | 0.5456 | 0.6921 | 0.0004 | 0.0003 | 0.0006 | 0.0260 | 0.0219 | 0.0307 |
| 2008 | 0.4159 | 0.3357 | 0.4972 | 0.7031 | 0.6220 | 0.7900 | 0.0002 | 0.0001 | 0.0002 | 0.0119 | 0.0100 | 0.0142 |
| 2009 | 0.4281 | 0.3399 | 0.5151 | 0.7178 | 0.6316 | 0.8062 | 0.0003 | 0.0002 | 0.0004 | 0.0032 | 0.0026 | 0.0039 |
| 2010 | 0.4622 | 0.3661 | 0.5592 | 0.6796 | 0.6014 | 0.7689 | 0.0002 | 0.0001 | 0.0003 | 0.0039 | 0.0031 | 0.0048 |
| 2011 | 0.4998 | 0.3908 | 0.6015 | 0.6856 | 0.5992 | 0.7841 | 0.0002 | 0.0002 | 0.0003 | 0.0024 | 0.0019 | 0.0029 |
| 2012 | 0.5222 | 0.4134 | 0.6345 | 0.7185 | 0.6181 | 0.8280 | 0.0001 | 0.0001 | 0.0002 | 0.0025 | 0.0021 | 0.0030 |
| 2013 | 0.5366 | 0.4177 | 0.6592 | 0.7442 | 0.6290 | 0.8828 | 0.0001 | 0.0000 | 0.0001 | 0.0016 | 0.0013 | 0.0020 |
| 2014 | 0.5406 | 0.4118 | 0.6818 | 0.7613 | 0.6257 | 0.9285 | 0.0001 | 0.0000 | 0.0001 | 0.0012 | 0.0010 | 0.0015 |
| 2015 | 0.5408 | 0.4079 | 0.7051 | 0.7523 | 0.5890 | 0.9517 | 0.0001 | 0.0000 | 0.0001 | 0.0019 | 0.0015 | 0.0023 |
2.1 COSEWIC assessment/SARA considerations
In 2009, the Committee on the Status of Endangered Wildlife in Canada (COSEWIC) assessed the Maritimes designable unit (DU) as threatened (COSEWIC 2009). The Maritimes DU encompasses 3 stocks:
- northern Gulf of St. Lawrence (NAFO Division 4RS)
- southern Gulf of St. Lawrence (4T)
- Scotian Shelf and Bay of Fundy (4VWX)
The American plaice Maritimes DU is currently under consideration for listing under the Species at Risk Act (SARA); however, at the time of publication of this rebuilding plan, no decision regarding listing had been made.
2.2 Indigenous knowledge
DFO aims to incorporate Indigenous traditional knowledge and traditional ecological knowledge considerations in science processes as participants to peer reviews meetings, and into fisheries management planning as members of GGAC. As required, indigenous knowledge is also gathered through consultations with First Nations and other Indigenous organizations.
3.0 Probable causes for the stock’s decline
While overfishing is believed to be the primary cause of initial decline of American plaice (COSEWIC 2009), the increasing rate of natural mortality since the mid-1990s has now been identified as the greatest threat to rebuilding of the stock in the sGSL, as fishing mortality is currently estimated to be very low (DFO 2011a). Furthermore, predation by grey seals is thought to be a major component of this high level of natural mortality (Ricard et al. 2016).
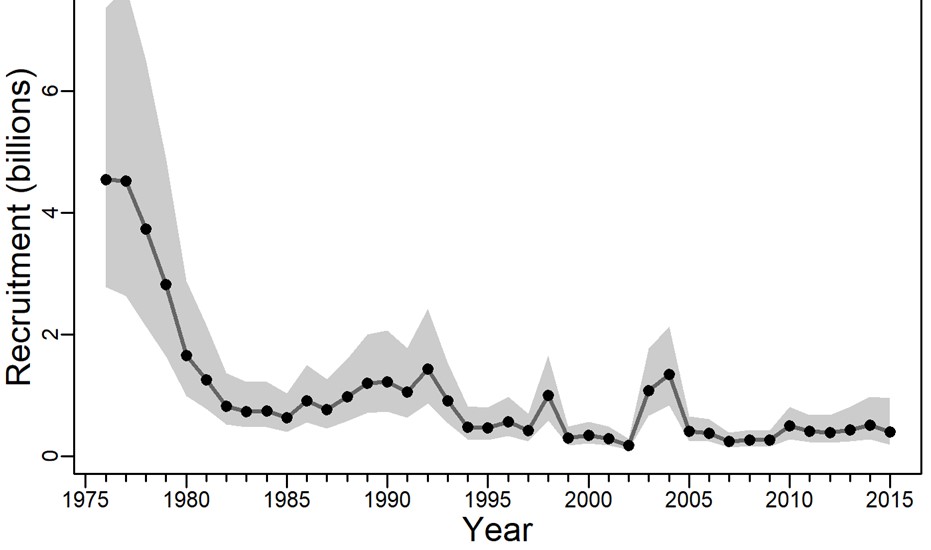
Figure 5 - Text version
Recruitment abundance has varied from 4 billion fish in 1976 to 170 million fish at its lowest point in 2002. The grey band shows the 95% credibility interval; a narrower grey band indicates stronger credibility around the average estimates (black line).
| Year | Median estimate of the number of recruits in billions | Lower value of the 95% credibility interval | Upper value of the 95% credibility interval |
|---|---|---|---|
| 1976 | 4.543 | 2.775 | 7.371 |
| 1977 | 4.521 | 2.637 | 7.725 |
| 1978 | 3.731 | 2.137 | 6.509 |
| 1979 | 2.826 | 1.639 | 4.914 |
| 1980 | 1.657 | 0.985 | 2.880 |
| 1981 | 1.257 | 0.773 | 2.152 |
| 1982 | 0.821 | 0.519 | 1.367 |
| 1983 | 0.732 | 0.470 | 1.223 |
| 1984 | 0.745 | 0.475 | 1.221 |
| 1985 | 0.631 | 0.395 | 1.035 |
| 1986 | 0.910 | 0.551 | 1.491 |
| 1987 | 0.762 | 0.453 | 1.261 |
| 1988 | 0.970 | 0.574 | 1.600 |
| 1989 | 1.191 | 0.704 | 1.995 |
| 1990 | 1.214 | 0.729 | 2.068 |
| 1991 | 1.048 | 0.630 | 1.774 |
| 1992 | 1.434 | 0.861 | 2.418 |
| 1993 | 0.911 | 0.537 | 1.529 |
| 1994 | 0.477 | 0.273 | 0.822 |
| 1995 | 0.467 | 0.265 | 0.800 |
| 1996 | 0.565 | 0.328 | 0.976 |
| 1997 | 0.414 | 0.242 | 0.699 |
| 1998 | 0.994 | 0.580 | 1.655 |
| 1999 | 0.295 | 0.173 | 0.487 |
| 2000 | 0.335 | 0.201 | 0.561 |
| 2001 | 0.289 | 0.175 | 0.487 |
| 2002 | 0.170 | 0.103 | 0.286 |
| 2003 | 1.073 | 0.665 | 1.760 |
| 2004 | 1.337 | 0.827 | 2.127 |
| 2005 | 0.404 | 0.240 | 0.649 |
| 2006 | 0.377 | 0.241 | 0.607 |
| 2007 | 0.239 | 0.140 | 0.387 |
| 2008 | 0.265 | 0.158 | 0.428 |
| 2009 | 0.260 | 0.148 | 0.423 |
| 2010 | 0.492 | 0.276 | 0.808 |
| 2011 | 0.402 | 0.227 | 0.671 |
| 2012 | 0.380 | 0.214 | 0.672 |
| 2013 | 0.434 | 0.245 | 0.812 |
| 2014 | 0.512 | 0.270 | 0.976 |
| 2015 | 0.397 | 0.182 | 0.953 |
In response to the 2016 stock assessment, DFO, in consultation with members of the GGAC, made the decision to impose a moratorium on the American plaice directed fishery in NAFO Division 4T. A 250 t allocation was initially implemented and further reduced to 100 t in 2024 to cover bycatch in other commercial fisheries, Indigenous FSC fisheries, a limited recreational fishery and fishing for scientific purposes. The low levels of catch from the directed fishery and low levels of bycatch in other fisheries are considered positive conditions for rebuilding. Studies have shown, however, that the increasing population of grey seals has led to increased predation on multiple commercially valuable species, creating conflicts with fisheries and generating calls for some form of predator controls (DFO 2011b, Swain and Benoît 2015; Neuenhoff et al. 2019 and Rossi et al. 2021). Grey seals are important predators of multiple groundfish species in the sGSL, including American plaice (Swain and Benoît 2015, Swain et al. 2019).
While the prospect for the rebuilding of the NAFO Division 4T American plaice to a healthy level remains grim (Ricard et al. 2016, DFO 2011a), this rebuilding plan will aim to minimize fishing mortality in order to prevent, to the extent possible, further decline. Until natural mortality diminishes from natural fluctuations or from directed management measures, no actions other than reducing fishing mortality have been identified as contributing to stock rebuilding. These actions are in compliance with the PA framework and are to preserve the stocks abundance such that should the prevailing conditions limiting the stocks recovery change, the stocks would retain the potential to rebuild.
Given the current understanding and best available scientific evidence, loss or degradation of the sGSL American plaice stock’s fish habitat is unlikely to have contributed to the stock’s decline.
4.0 Measurable objectives aimed at rebuilding the stock
As outlined in the Precautionary Approach framework (PA), the primary objective of this rebuilding plan is to promote stock growth out of the critical zone (e.g. grow the stock beyond the LRP), by ensuring removals from all fishing sources are kept to the lowest possible level until the stock has cleared this zone. Within the critical zone, this objective remains the same whether the stock is declining, stable or increasing. Based on the PA framework, the overarching objective for NAFO 4T American plaice is therefore for the stock to grow out of the critical zone.
4.1 Rebuilding target and timeline
The rebuilding target for the plan will be to grow the stock so that it is above the LRP (139,135 t) with a high likelihood (≥75%). If the rebuilding target can be reached, the long-term management objective under the IFMP will be to continue the stock’s growth toward the healthy zone and then maintain the stock’s SSB in that zone. This long-term objective would be to the benefit of all Canadians, including harvesters, those sectors closely involved with the fishing industry and to Indigenous and coastal communities who depend on the resource for their livelihood.
Unfortunately, at current high level of natural mortality, and considering the declining long-term projections for this stock (DFO 2011a), a rebuilding timeline to the rebuilding target cannot be calculated at this time. During each review of the plan (see Section 8.0 Periodic Review of the Rebuilding Plan), the factors limiting the stock’s potential for growth will be reassessed to determine if they are still influencing the stock and if a rebuilding timeline can be calculated. In the meantime, and in compliance to the PA framework, this rebuilding plan still aims at minimizing, to the extent possible, further declines of the stock. This is to preserve the stock such that, should the prevailing conditions limiting the stock’s recovery change, the stock retains the potential to rebuild.
4.2 Additional measurable objectives and timelines
Under the PA framework, management actions must promote stock growth and removal from all fishing sources must be kept to the lowest possible level while the stock is in the critical zone, and there should be no tolerance for preventable decline.
Table 4 provides an overview of the secondary rebuilding objectives for the NAFO Division 4T American plaice stock, to enable DFO to monitor all sources of mortality, the effectiveness of management measures being implemented, whether the status of the stocks is improving, and the overall state of the ecosystem.
Table 4. Additional measurable objectives and timelines aimed at rebuilding American plaice, NAFO Division 4T stock.
Secondary objectives
- Keep removals from all sources to the lowest possible level by introducing new and/or stricter management measures in all fisheries that intercept American plaice.
- Starting in 2025 and reviewed every 5 years as part of the review of the rebuilding plan.
- Monitor sources of fishing mortality and enforce compliance of current management measures.
- Starting in 2025 and reviewed every 5 years with the review of the rebuilding plan.
- Advance current scientific knowledge in the fields of monitoring stock status, recruitment, environmental conditions, and those ecosystem factors that are likely to impact the stock’s recruitment, growth, habitat and health.
- Continue and review the state of the stock every 5 years in parallel with the review of the rebuilding plan.
5.0 Management measures aimed at achieving the objectives
Various management measures will be required to achieve the objectives identified in Table 4. These measures and expected outcomes are presented in Table 5. They are informed by the numerous DFO Sustainable Fisheries Framework (SFF) policies such as the Precautionary Approach (DFO 2009), bycatch (DFO 2013) and catch monitoring (DFO 2019a) policies. Since the American plaice stock (NAFO Division 4T) is unlikely to rebuild under prevailing conditions (see section 3.0 Probable causes for the stock’s decline), the objectives are aimed at preserving the stock such that should the prevailing conditions limiting the stock’s recovery change, the stock retains the potential to rebuild.
American plaice is 1 of 3 overlapping groundfish stocks under moratorium listed in Schedule XI of the Fishery (general) Regulations. Therefore, management measures contained in the American plaice rebuilding plan would take into account those of the white hake and Atlantic cod rebuilding plans, which are also caught as bycatch in other commercial groundfish fisheries (i.e., Atlantic halibut, Greenland halibut, witch flounder, redfish and yellowtail flounder). As a result, some of these other fisheries could suffer cumulative effects of measures implemented under several rebuilding plans, particularly with respect to the potential development of a full-scale commercial fishery for Unit 1 redfish in the sGSL. The potential impacts of this fishery, and other commercial fisheries should be monitored through existing and newly implemented monitoring measures (i.e., objective 2).
| Objective | Management measure(s) | Expected outcome | Biology or environmental conditions taken into account |
|---|---|---|---|
1 - Keep removals from all sources to the lowest possible level by introducing new and/or stricter management measures in all fisheries that intercept American plaice. |
Maintain the closure of the commercial directed fishery. Further reduce the annual bycatch allocation (TAC) of 100 t implemented in 2024, by annual reductions of 5 t until the next periodic review of the rebuilding plan (i.e. reducing bycatch TAC to 80 t by 2028). These TACs are necessary to cover the bycatch of American plaice in other commercial groundfish fisheries and are deemed to be the lowest level of captures that would minimize impact on other commercial fisheries. Although the comprehensive review of the rebuilding plan is scheduled for 2028 (every 5 years), if after 2 years, the objective set in the plan in terms of bycatch level exceeds the TAC, additional adjustment measures may be evaluated and implemented before the next planned review. New management measures and/or adjustments to existing management measures already in place in other commercial groundfish fisheries may be introduced to further reduce interactions with NAFO Division 4T American plaice. The establishment of a target depth range in specific fisheries or fishing areas, or the introduction of permanent or seasonal spatio-temporalclosures are examples of measures that could be implemented. Note: average bycatch landing from 2017 to 2020 was 70t. |
Minimize fishing mortality to the lowest possible levels to preserve the stock such that if prevailing conditions change, it may be able to rebuild. These TACs would allow other directed groundfish fishing activities to occur (i.e.: Atlantic halibut, Greenland halibut, witch flounder, redfish and other groundfish species), while reducing fishing mortality to the lowest possible level. |
Based on the requirements stated in the PA framework for stock in the critical zone. |
As part of the bycatch protocol in place in other commercial groundfish fisheries; reducing the bycatch limit of American plaice in 2028 to ensure consistency across all directed groundfish fisheries. Details on existing bycatch limits in other groundfish fisheries and the revised limits are presented in Annexes 1 and 2. When the bycatch limit is reached, the fishing area could be closed for a period of time or for the entire season. |
Reducing fishing mortality on mature individuals is intended to avoid the risk of localized productivity depletion and to promote stock growth. Note: a period of 3 years to implement the 5% is required to fully assess the operational and the economic impacts of the added management measures, not only on fish stocks still commercially exploited, but also on the other prescribed fish stocks under section 6.2 of the FSP (i.e.: Atlantic cod, white hake, winter flounder). |
This measure takes into account the overall low productivity of the stock. |
|
Discards of American plaice are not allowed and must be reported as bycatch. |
|
|
|
2 - Monitor sources of fishing mortality and enforce compliance of current groundfish management measures. |
In 2025, implement or maintain 100 percent dockside monitoring in all commercial fisheries known to intercept American plaice. |
Dependable and timely data to quantify catches from all fisheries which intercept American plaice and for FSC fishing. |
|
In 2026, implement the use of VMS (Vessel Monitoring System) in all NAFO Division 4T groundfish fisheries, to monitor fishing effort and bycatch distribution. |
|
|
|
In 2027, initiate a pilot project to test the use of electronic monitoring tools (e.g., video monitoring) in a number of commercial groundfish fisheries. |
|
|
|
The recreational and FSC fisheries represent non-significant catches (no quantitative data, only qualitative), so no additional measures are being implemented at this time. |
|
|
|
3 - Advance current scientific knowledge in the fields of monitoring stock status, environmental conditions, and those ecosystem factors that are likely to impact the stock’s growth, habitat and health. |
Continue the September annual RV survey, which is the primary data-source to estimate abundance distribution and indexes in interim years. Supplement RV survey data with DFO Science lead research projects and fishery dependent sources, such as sentinel fishery, harvesters’ logbooks, at-sea observer reports, VMS. Continue research on ecosystem and species interactions, and natural mortality. Establish reference points. Note: the USR would be developed by fishery managers informed by consultations with industry stakeholders and other interests, with advice and input from Science. |
Stock assessments, interim updates and research findings are peer-reviewed and published. |
Identify species distribution, and potential overlap between American plaice and other commercially exploited species to minimize bycatches. |
6.0 Socio-economic considerations
While a summary analysis of the stock’s economic contribution is presented under section 1.6 of this document, this section provides a socio-economic analysis on the proposed management measures to the extent possible.
The implementation of any new measures to further curtail and monitor the bycatch of American plaice will have an impact on the harvesters currently engaging in the remaining directed commercial groundfish fisheries of the sGSL. However, since the proposed reduction in average annual bycatch allocation maintains the TAC at a level higher than the annual landings over the past 10 years (see Table 2), impacts are expected to be negligible.
There is considerable uncertainty related to the potential development of a new commercial fishery for Unit 1 redfish in the sGSL and the impact it could have on the 4T American plaice stock. There is an overlap in the spatial distribution of redfish and American plaice in the sGSL which will likely result in an increase in American plaice bycatch when the commercial redfish fishery is reopened. However, uncertainties remain regarding the scope, scale, spatial and temporal distribution and marketing opportunities associated with this fishery, as well as the additional mitigation measures the fishery might impose to reduce its impact on American plaice and other groundfish.
7.0 Method to track progress towards achieving the objectives
Performance metrics provide DFO with a means to assess the progress of the rebuilding plan towards the plan’s objectives. For each objective, Table 6 below outlines how and when progress will be measured.
Table 6. Summary of the performance metrics and frequency of measurement associated with each objective in this American plaice NAFO Division 4T rebuilding plan.
- Objective: keep removals from all sources to the lowest possible level by introducing new and/or stricter management measures in all fisheries that intercept American plaice.
- Metric to measure progress: Annual bycatch allocation (TAC) reduced from 250 t to 100 t in 2023 and 2024, followed by annual reductions of 5 t until the next periodic review of the rebuilding plan (i.e., 2028).
- Frequency of measurement: Annually as part of the Gulf Region postseason review of all management activities and fisheries conducted in the sGSL (NAFO Division 4T) (Gulf Region - Annual postseason review).
- Objective: monitor sources of fishing mortality and enforce compliance of current management measures.
- Metric to measure progress: Qualitative assessment of the efficiency and efficacy of catch monitoring programs with the different fleets and harvesters.
- Frequency of measurement: Annually as part of a review of all management activities and fisheries conducted in the sGSL (NAFO Division 4T, Gulf Region).
- Objective: advance current scientific knowledge in the fields of monitoring stock status, environmental conditions, and those ecosystem factors that are likely to impact the stock’s growth, habitat and health.
- Metric to measure progress: Conduct the September annual research vessel survey. Findings from science work published in CSAS research documents within the scheduled 5 years review cycle. Some results may also be published in specialized scientific journals.
- Frequency of measurement: Regularly, as documents are peer reviewed and published on the CSAS Website or in scientific journals.
8.0 Periodic review of the rebuilding plan
The department will engage stakeholders on any matter related to the implementation or review of the rebuilding plan through the established Gulf Groundfish Advisory Committee (GGAC) process. Outcomes from the application of this rebuilding plan will be monitored periodically, and a comprehensive review will be undertaken every 5 years, which corresponds to each science stock assessment.
The review of the plan will be based on the data gathered using the metrics identified in the method to track progress towards achieving the objectives section of this plan. It will assess the progress of the implementation of management measures and evidence of their effectiveness, as well as the status of the stock and recent trends. In addition, the review will include opportunities for consultation with Indigenous partners and stakeholders on their views of the stock’s progress towards rebuilding.
A report will be generated following the review process, which will outline progress toward each management objective according to their timelines, along with evidence and may be used to justify making adjustments to the rebuilding plan if necessary to achieve the objectives.
Stock rebuilding is not always a slow and steady, or even predictable process. Stocks may fluctuate and/or persist at low levels for years until conditions promote surplus production, resulting in rapid growth of the population. Thus, lack of progress towards rebuilding may not be an indication that the rebuilding plan’s objectives or management measures are insufficient or ineffective.
9.0 References
Benoît, D. and Bowen, W.D. 1990a. Summer diet of grey seals (Halichoerus grypus) at Anticosti Island, Gulf of St. Lawrence, Canada. Canadian Bulletin of Fisheries and Aquatic Sciences 222: 227-242.
Benoît, D. and Bowen, W.D. 1990b. Seasonal and geographic variation in the diet of grey seals (Halichoerus grypus) in eastern Canada. Canadian Bulletin of Fisheries and Aquatic Sciences 222: 215-226.
Benoît, H.P. and Swain, D.P. 2008. Impacts of environmental change and direct and indirect harvesting effects on the dynamics of a marine fish community. Can. J. Fish. Aquat. Sci. 65: 2088-2104.
COSEWIC. 2009. COSEWIC assessment and status report on the American plaice Hippoglossoides platessoides, Maritime population, Newfoundland and Labrador population and Arctic population, in Canada. Committee on the Status of Endangered Wildlife in Canada. Ottawa. x + 74 pp.
DFO. 2009. A Fisheries Decision-Making Framework Incorporating the Precautionary Approach (April, 2009).
DFO. 2011a. Recovery Potential Assessment of the Maritime Designatable Unit of American plaice (Hippoglossoides platessoides). DFO Can. Sci. Advis. Sec. Sci. Advis. Rep. 2011/043.
DFO. 2011b. Zonal Advisory Process on the Impacts of Grey Seals on Fish Populations in Eastern Canada; October 4-8, 2010. DFO Can. Sci. Advis. Sec. Proceed. Ser. 2010/054.
DFO. 2012. Biomass limit reference point consistent with the precautionary approach for American plaice (Hippoglossoides platessoides) from the southern Gulf of St. Lawrence (NAFO Div. 4T). DFO Can. Sci. Advis. Sec. Sci. Advis. Rep. 2012/018.
DFO. 2013. Policy on Managing Bycatch (April, 2013).
DFO. 2016. Stock assessment of American plaice (Hippoglossoides platessoides) of the southern Gulf of St. Lawrence (NAFO div. 4t) to 2015. DFO Can. Sci. Advis. Sci. Advis. Rep. 2016/031.
DFO. 2019a. Fishery Monitoring Policy (November, 2019).
DFO. 2019b. Updated indices of abundance to 2018 for American plaice and Yellowtail Flounder from NAFO Div. 4T. DFO Can. Sci. Advis. Sec. Sci. Resp. 2019/006.
DFO. 2020. 2019 Status of Northwest Atlantic Harp Seals, Pagophilus groenlandicus. DFO Can. Sci. Advis. Sec. Sci. Advis. Rep. 2020/020.
DFO. 2021a. Assessment of the northern contingent of Atlantic Mackerel (Scomber Scombrus) in 2020. DFO Can. Sci. Advis. Sec. Sci. Advis. Rep. 2021/029.
DFO. 2021b. Update of indices of abundance to 2020 for Atlantic Cod (NAFO Div. 4T and 4Vn (November to April)) and American plaice (NAFO Div. 4T) assessed and managed by DFO Gulf Region. DFO Can. Sci. Advis. Sec. Sci. Resp. 2021/011.
DFO. 2022a. Assessment of the southern Gulf of St. Lawrence (NAFO Division 4TVn) spring and fall spawner components of Atlantic Herring (Clupea harengus) with advice for the 2022 and 2023 fisheries. DFO Can. Sci. Advis. Sec. Sci. Advis. Rep. 2022/021.
DFO. 2022b. Stock assessment of Northwest Atlantic grey seals (Halichoerus grypus) in Canada in 2021. DFO Can. Sci. Advis. Sec. Sci. Advis. Rep. 2022/018.
Morin, R. 2012. Estimating the age composition of discards in the NAFO 4T American plaice fishery. DFO Can. Sci. Advis. Sec. Res. Doc. 2012/081, ii + 29 p
Neuenhoff, R.D., Swain, D.P. Cox, S.P. McAllister, M.K. Trites, A.W. Walters, C.J. and Hammill, M.O. 2019. Continued decline of a collapsed population of Atlantic cod (Gadus morhua) due to predation-driven Allee effects. Canadian Journal of Fisheries and Aquatic Sciences. 76: 168-184.
Ricard, D., Morin, R., Swain, D.P. and Surette, T. 2016. Assessment of the southern Gulf of St. Lawrence (NAFO Division 4T) stock of American plaice (Hippoglossoides platessoides), March 2016. DFO Can. Sci. Advis. Sec. Res. Doc. 2016/057. ix + 43 p.
Rossi, S.P., Cox, S.P., Hammill, M.O., den Heyer, C.E., Swain, D.P., Mosnier, A., and Benoît, H.P. 2021. Forecasting the response of a recovered pinniped population to sustainable harvest strategies that reduce their impact as predators. ICES J. Mar. Sci. doi:10.1093/icesjms/fsab088.
Scott, W.B. and Scott, M.G. 1988. Atlantic fishes of Canada. Can. Bull. Fish. Aquat. Sci., 219: 1-731.
Swain D. P., Benoît H. P., Hammill M. O. and Sulikowski J. A. 2019. Risk of extinction of a unique skate population due to predation by a recovering marine mammal. Ecological Applications 29(6):e01921. 10.1002/eap.1921
Swain, D.P., and Benoît, H.P. 2015. Extreme increases in natural mortality prevent recovery of collapsed fish populations in a Northwest Atlantic ecosystem. Mar. Ecol. Prog. Ser. 519 : 165 - 182.
Annex 1
At-sea observer and dockside monitoring minimum requirements, and bycatch limits by fleet, fishing gear and target species in 2022-23
| Fleet (vessel overall length and monitoring programs) |
Target species | Bycatch limits by species (% bycatch per fishing trip) | ||||||||
|---|---|---|---|---|---|---|---|---|---|---|
| *Atlantic cod 4T | Atlantic halibut 4RST | Greenland halibut 4RST | *White hake 4T | *American plaice 4T | *Winter flounder 4RST | Witch flounder 4RST | Yellowtail flounder 4T | Other groundfish species 4T | ||
| HALIBUT : Fixed gear - NAFO Divisions 4RST | ||||||||||
>= 13.71m Gaspé, Québec Region at-sea observer: 20%, DMP: 100%, VMS: 100% |
Atlantic halibut | 30% | 5% | 5% | 1 | 1 | 1 | 10% | ||
Greenland halibut or turbot (longline) |
10% | 40% | 5% | 1 | 1 | 1 | 10% | |||
Greenland halibut or turbot (gillnets) |
10% | 3% | 5% | 1 | 1 | 1 | 10% | |||
<19.81m Eastern New-Brunswick at-sea observer: 10% for vessels <13.71m and 15% for vessels >= 13.71m, DMP: 100% |
Atlantic halibut | Max daily limit 45kg or 30% | 1 | 10% | 10% | 1 | 1 | 25% | ||
<19.81m Magdalen Islands at-sea observer: 10%, DMP: 100% |
Atlantic halibut | Max daily limit 45kg or 30% | 3% | 10% | 1 | 1 | 10% | |||
<19.81m Gulf Nova Scotia at-sea observer: 10%, DMP: 100% |
Atlantic halibut | Max daily limit 45kg or 30% | 1 | 10% | 10% | 1 | 1 | 1 | 25% | |
| WINTER FLOUNDER : Fixed gear - NAFO Divisions 4RST | ||||||||||
<19.81m at-sea observer: 5% with the exception of Québec’s fleet with a 10% coverage, DMP: 100% |
Winter flounder | 5% | 1 | 1 | 10% | 10% | 25% | 10% | ||
| YELLOWTAIL FLOUNDER: Mobile gear - NAFO Division 4T | ||||||||||
<19.81m at-sea observer: 10% in groundfish fishing areas 4T2(a), 4T6 and 4T7 and the open portion of 4T3a will apply. 25% in groundfish fishing area 4T8 will apply. DMP: 100% |
Yellowtail flounder | 10% | 1 | 1 | 10% | 10% | 25% | 25% | 10% | |
| WITCH FLOUNDER : Mobile gear - NAFO Divisions 4RST | ||||||||||
<19.81m at-sea observer: 25%, DMP: 100% |
Witch flounder | 20% | 1 | 1 | 10% | 10% | 25% | 1 | 10% | |
| REDFISH : Mobile gear - Unit 1 (4RST, 3Pn, 4Vn) | ||||||||||
<19.81m at-sea observer: 25%, DMP: 100% |
Redfish | 5% | 1 | 1 | 10% | 10% | 1 | 1 | 15% | |
|
* Stocks prescribed in the Fishery (General) Regulations (section 69) and thus are subject to section 6.2 of the Fisheries Act and regulatory requirements). 1 Species not specified as bycatch in the conservation harvesting plan, but may be reported as “Other groundfish species” if caught. DMP: Dockside monitoring program. VMS: Vessel monitoring system. |
||||||||||
Annex 2
NAFO Div. 4T American plaice key management measures until the next review of the rebuilding plan in 2028.
Objective 1
Keep removals from all sources to the lowest possible level by introducing new and/or stricter management measures in all fisheries that intercept American plaice. If the objective set in the plan in term of bycatch level is exceeded, additional adjustment measures may be evaluated and implemented before the next planned review.
- 2024
- Maintain the closure of the commercial directed fishery.
- Bycatch TAC = 100 t
- Bycatch limit per trip = 10%1
- 2025
- Maintain the closure of the commercial directed fishery.
- Bycatch TAC = 95 t
- Bycatch limit per trip = 10%1
- 2026
- Maintain the closure of the commercial directed fishery.
- Bycatch TAC = 90 t
- Bycatch limit per trip = 10%.
- A revision of the level of bycatch could be considered
- 2027
- Maintain the closure of the commercial directed fishery.
- Bycatch TAC = 85 t
- Bycatch limit per trip = 10%.
- A revision of the level of bycatch could be considered
- 2028
- Maintain the closure of the commercial directed fishery.
- Bycatch TAC = 80 t
- Bycatch limit per trip = 10%.
- A revision of the level of bycatch could be considered)
Objective 2
Monitor sources of fishing mortality and enforce compliance of current groundfish management measures.
- 2024
- VMS (Vessel Monitoring System) not used in all NAFO 4T groundfish fisheries.
- 2025
- VMS (Vessel Monitoring System) not used in all NAFO 4T groundfish fisheries.
- 2026
- Use of VMS in all NAFO Division 4T groundfish fisheries.
- 2027
- Use of VMS in all NAFO Division 4T groundfish fisheries.
- 2028
- Use of VMS in all NAFO Division 4T groundfish fisheries.
1 The bycatch limit per trip may need to be identified for directed groundfish fisheries where the species bycatch is reported as “other groundfish species”.
Page details
- Date modified: