
Inshore Scallop - Maritimes Region
2. STOCK ASSESSMENT, SCIENCE AND TRADITIONAL KNOWLEDGE
2.1 Biological Synopsis
The sea scallop, Placopecten magellanicus, is found only in the Northwest Atlantic from Cape Hatteras to Labrador and inhabits a variable depth range of about 10–120 m. Scallops are aggregated in patches and harvestable concentrations called beds. The natural extent of these beds is believed to be determined by favourable local conditions, such as water temperature, food availability, and substrate type, as well as spawning and settlement success.
The sea scallop has separate sexes, unlike many other commercial scallop species. In the summer months the male scallops develop a white gonad, while female gonads are bright red. Eggs and sperm are released into the water and fertilization takes place in the sea. Spawning begins in late August to early September and larvae drift in the water for almost a month before settling to the bottom in October.
Newly-settled sea scallops attach themselves to gravel, shells and other objects via byssus threads to avoid being swept away by the current. At this stage, the juveniles prefer cryptic habitat to avoid predation. While adult sea scallops are found on a variety of substrate types, scallop densities tend to be higher on gravel and gravel-lag sediment types. Scallops can move to avoid predators by taking water into the body cavity area and then squeezing the two valves of shell together to force the water out from the corners of its hinge propelling the scallop forward. However, there is little evidence that scallops travel large distances once juveniles have settled.
Sea scallops are active suspension-feeders relying on suspended detrital material and phytoplankton for their food. Studies of gut contents have also identified resting cysts of toxic dinoflagellates implicated in outbreaks of paralytic shellfish poisoning and diarrheic shellfish poisoning. Organs in the viscera can be contaminated by the toxic by-products of these dinoflagellates with no apparent harm to the scallop. However, currently only the adductor muscle (or scallop meat) which is usually free of this material is landed by the fishery for human consumption.
Scallop growth is characterised by measuring shell height (distance between hinge and the opposite ventral margin). Shell heights can range up to 20 cm but are rarely larger than 15 cm in fished areas. Ages are determined from annual rings on the shell that result from the slowing or cessation of growth which usually occurs in the late winter. Rings can also form as a result of some form of trauma such as contact with fishing gear. These kinds of rings are referred to as shock marks and can be confused with the annual growth rings. Scallop growth can vary between beds and even within beds if there are depth gradients or differences in bottom current strength. The relationship with depth is probably a proxy for relationships with other environmental variables (e.g., temperature, food availability, oxygen, predation, etc.) that are depth related. Growth can also vary annually possibly due to inter-annual differences in food availability. The weight of the adductor muscle is partly related to the size of the shell but may also depend upon food availability. The adductor muscle stores food energy in the form of glycogen and the weight will vary seasonally reflecting periods of feeding, fasting and transferring energy to the gonads for reproduction.
2.2 Ecosystem Interactions
Natural mortality of sea scallop is high during its planktonic larval stage. During this stage unfavourable environmental conditions can retard development, currents can sweep larvae away from suitable habitats, and larvae are subject to predation by larger organisms. Once in their adult form, scallops contend with predation from seastars, predatory snails, crustaceans, and some fish species.
Data on fish and invertebrate species caught as bycatch in the scallop fishery have been obtained via at-sea observers from the SFA 29 West fishery since its inception in 2001. The department funded a limited at-sea observer program for the Bay of Fundy in 2008/2009 to provide bycatch data for the first time for this area. The analysis of this data was reported in Sameoto and Glass (2012).
2.3 Traditional Ecological Knowledge
While there is no formal mechanism to include TEK, commercial and aboriginal fishermen participate in the peer review of the stock assessment and contribute their knowledge and experience to the process in this way.
2.4 Aboriginal Ecological Knowledge
There is no historical knowledge of scallop fishing with vessels and drag gear by the aboriginal people.
2.5 Stock Assessment
Annual science advice is provided for each of the Scallop Production Areas (SPA) in the Bay of Fundy and Approaches and Scallop fishing area (SFA) 29 West of 65°30' W.
DFO Science conducts annual summer surveys throughout the Bay of Fundy on a commercial fishing vessel through a departmental contract and an annual industry assessment survey of SFA 29 West of 65°30' W in the autumn funded through the department’s use of fish program. Additional information from various at-sea sampling and survey work conducted by or on behalf of fishers with DFO personnel and at-sea observers (SFA 29 West only) is also used during the stock assessment process. Where information is available, the amount and spatial distribution of bycatch of other species in the scallop fishery, particularly lobster are also evaluated.
The Regional Advisory Process (RAP) provides the forum to review and update the scientific advice annually, usually meeting in the autumn for Bay of Fundy and in the spring for SFA 29 West of 65°30' W. A biomass-based population model is used to evaluate the impact of the past fishery and evaluate future catch levels for SPAs 1A, 1B, 3, 4 and in 2015 included SPA 6. This population model has been modified to account for differing productivity by bottom habitat type for SFA 29 West. Survey trends and commercial catch rates are used to evaluate the impact of the past fishery for SPA 5.
Starting in 2013, stock status for SPA 1A, 1B, 3 and 4 (including 5) are being evaluated in terms of biomass and exploitation reference points in the context of the precautionary approach (see 2.7). In 2015 SPA 6 was included with the other SPAs. Currently, all of these areas are above the proposed upper stock reference points and current catches are at or below the reference exploitation level.
Biomass and commercial scallop density in SFA 29 West declined from the first years (2001-2005) of the fishery and since 2006 have been at significantly lower levels.
2.6 Stock Scenarios
Population trends for scallops fished in the inshore areas of the Bay of Fundy and southwest Nova have been characterized by “boom and bust” cycles as rapid increases in population sizes due to episodic recruitment are fished down. In the Bay of Fundy there have been two major recruitment events since 1981 and records going back to the early 1920’s indicate that such events tend to occur once every decade or so. Past research results linking these events to temperature trends possibly reflecting changes in the circulation patterns in the Bay of Fundy have not held up with recent data and at present no specific causes for these events have been identified. The most recent major recruitment was due to the large 1998 year-class which recruited to the commercial fishery in 2001/2002. Until the next event occurs, the fishery will be concentrating on the existing commercial size animals augmented by low levels of recruitment in most areas. The expectation is that sustainability will be achieved by keeping exploitation below the net productivity rate of the stocks and biomass above the upper stock reference point.
2.7 Precautionary Approach
In the context of fisheries management, the Precautionary Approach (PA) is about being cautious when scientific information is uncertain, unreliable or inadequate and not using the absence of adequate scientific information as a reason to postpone or fail to take action to avoid serious harm to the resource. The framework applies where decisions on harvest strategies or harvest rates for a stock must be taken to determine measures for controlling harvests. The framework outlines a process to establish stock specific reference points and stock status zones (Healthy, Cautious and Critical), as well as harvest strategies and harvest decision rules based on where a stock is in relation to these reference points/zones.
The standard definition of the lower stock limit reference point for the precautionary approach is based upon determining the minimum stock size below which the increase of the population due to reproduction and growth are so low that natural mortality alone would restrict population growth making the population vulnerable to extirpation or extinction. Scallop populations in the Bay of Fundy have experienced large variations in stock size without any apparent evidence of long-term impairment to population reproduction or growth. In theory, calculation of the stock limit reference point requires some idea of how the population reproduction rate might change when the stock is at very low levels. There have been at least two large episodic recruitment events in the Bay of Fundy since 1981 both apparently originating from stock sizes in the lower range of those observed during this period. The potential impact of environment and habitat suitability issues on recruitment dynamics have been discussed in the literature but to date there has been no demonstrable relationship between stock and recruitment for sea scallops.
An alternative approach has been taken here, where the lower stock limit reference point has been set to the lowest biomass in the time series from which a sustained recovery occurred for those areas with an assessment model (SPA 1A, 1B, 3 and 4 (and 5)). A method to determine Upper Stock Reference points (USRs) based on the equilibrium biomass and exploitation rate associated with maximum catch for the modeled areas was agreed upon in meetings with industry. The actual mean catch estimated from this method is highly dependent upon recruitment assumptions and should only be interpreted as a relative measure. Reference points for SPA 6 were developed in 2014 using catch rate as an index of productivity.
Reference points for SFA 29 West are being developed using the habitat suitability model.
2.8 Research
In consultation with industry and other stakeholders, DFO Science continues to investigate methods to provide longer term advice on overall stock status and management considerations.
Estimates of stock status are highly dependent upon annual survey estimates but limited resources are making it difficult to maintain the current level of survey coverage. Other possibilities such as replacing the drag survey with an underwater photographic survey should be explored albeit there are a number of technical and logistical problems that would need to be solved for this to be implemented.
Short term research in the scallop program has concentrated on refining the population models for those areas where they are used; developing other methods for determining the impact of fishing on the populations and understanding the spatial and temporal patterns of productivity.
2.9 References
DFO. 2006. A Harvest Strategy Compliant with the Precautionary Approach. DFO Can. Sci. Advis. Sec. Sci. Advis. Rep., 2006/023: 7 p
Sameoto, J.A., and Glass, A. 2012. An overview of discards from Canadian Inshore Scallop fishery in SFA 28 and SFA 29 West for 2002 to 2009. Can. Tech. Rep. Fish. Aquat. Sci. 2979.
Smith et al. (2014a). A habitat-based assessment model for SFA 29 West scallop fishery. DFO Sci.Advis. Sec. Res. Doc. 2014/xxx
Smith et al. (2014b). Framework Assessment for SFA 29 West scallop fishery. DFO Sci.Advis. Sec. Res. Doc. 2014/110
Smith, S.J., and Hubley, P.B. 2012. Reference points for scallop fisheries in the Maritime Region. DFO Can. Sci. Advis. Sec. Res. Doc. 2012/018. ii + 16 p.
Smith, S.J., and Rago, P. 2004. Biological Reference Points for sea scallops (Placopecten megellanicus): the benefits and costs of being nearly sessile. Can J. Fish. Aquat. Sci., 61:1338-1354.
3. SOCIAL, CULTURAL AND ECONOMIC IMPORTANCE OF THE FISHERY
3.1 Overview
Scallop harvesting is an important economic component of the commercial fishery in the Maritimes Region and provides significant socio-economic benefits to individuals and communities throughout rural Nova Scotia and New Brunswick. Scallop provides a substantial portion of the total value of all fish landed in the region and the species is harvested by both Inshore (vessel length less than 65’) and Offshore (vessels greater than 65’) fleets.
Total Scallop landed value by both Inshore and Offshore fleets in the Maritimes Region was about $163.7 million in 2013.
The Inshore Scallop fishery (Inshore Scallop) in the Maritimes Region consists of four fleets: Full Bay, Mid Bay, Upper Bay and Inshore East of Baccaro. There is a total of approximately 250 active licences, and is estimated to provide direct employment for approximately 750 people in the harvesting sector. In 2013, the Inshore Scallop fishery accounted for approximately 18 percent of the Scallop harvest by value in the Maritimes Region with preliminary (p) landings valued at about $28.7 million.
3.2 Inshore Scallop Quota and Landings (Quota Year)
The period of access to the Total Allowable Catch (TAC) for Inshore Scallop in the Maritimes Region varies by fleet and does not necessarily follow calendar year. While the period of access to the TAC for most fleets falls within the calendar year, a notable exception is the Full Bay fleet access to Scallop Fishing Area (SFA) 28 which runs from October to September.
Figure 3.1 shows the TAC and landings for Inshore Scallop from 1996/97 to 2012/13 (p). Quota information for all fleets is provided here as October to September. For example, 1996/97 represents October 1996 through to September 1997. While the quota period for some fleets runs from January 1 to December 31, fishing activity generally falls within a twelve month period ended by September 30.
The Inshore Scallop TAC increased from 750 tonnes in 1997/98 to a high of 3,655 tonnes in 2002/03. The TAC decreased to below 1,500 tonnes in 2005/06, and has remained stable during the 2006/07 to 2012/13 period with an average level of approximately 1,240 tonnes. The TAC in 2012/13 was 1,265 tonnes. Scallop quota figures are shown in ‘meat weight’ which represents the live/round weight divided by a factor of 8.3.
More details on the TAC and landings for Inshore Scallop fleets in the Maritimes Region are found in Appendices 9 and 10.
Total Allowable Catch and Landings (tonnes of meat), 1996/97-2012/13p
Source: DFO Maritimes Region
3.3 Landings and Landed Value (Calendar Year)
The landings of Inshore Scallop in the Maritimes Region are cyclical in nature and have consequently driven cyclical patterns for landed values.
Total Inshore Scallop landings increased from 771 tonnes (meat weight) in 1986 to an all-time high of 4,482 tonnes in 1989. Landings dropped off to just under 2,500 tonnes during the early 1990s before declining to a low of 745 tonnes in 1997. Landings rose again to a high of 2,862 tonnes in 2003 before subsequently declining to a range of between approximately 1,100 tonnes and 1,400 tonnes during the 2006 to 2013 period. Preliminary landings in 2013 were 1,327 tonnes.
Landed value in the Inshore Scallop fishery in the Maritimes Region has similarly fluctuated, rising from $10.3 million in 1986 to a high of $38.7 million in 1989. Landed value decreased to $14.0 million in 1997 and rose again to $35.1 million in 2003. Landed value declined to $13.2 million in 2010, subsequently increasing to $28.7 million in 2013.
The Full Bay fleet has been the main source of Inshore Scallop landings during the period from 1985 to 2013. As of 2010 the landings for SFA 29 West of Baccaro by the Full Bay fleet and the portion of licence holders in the Inshore East of Baccaro fleet with access were combined to form the SFA 29 West fishery.
Figure 3.2 provides a detailed view of Inshore Scallop landings and landed value by fleet in the Maritimes Region from 1985 to 2013p. More details on Inshore Scallop landings and landed value are found in Appendix C.
by Fleet/Fishery and Total Landed Value ($ millions), 1985-2013p
Source: DFO Maritimes Region
Preliminary landed value figures for 2013 show an increase for all fleets as compared to the previous few years. Landed values generally fluctuate along with landings.
Full Bay (Scallop Production Areas (SPA) 1-7) landings represented 58 percent of Inshore Scallop landings by weight in 2013. Landed value for the Full Bay fleet in SPA 1-7 peaked at $28.1 million in 2003 when landings peaked at 2,320 tonnes and the landed price benefitted from a weak Canadian Dollar. Landed value for the Full Bay fleet was $16.8 million in 2013 which was the highest since 2004.
Landings for the Mid Bay fleet fluctuated from 1997 to 2012, averaging approximately 207 tonnes before rising to a period high of 300 tonnes in 2013. Landed value in 2013 was $6.3 million, approximately double the average nominal landed value during the 1997 to 2012 period.
Upper Bay landings fluctuated during the 1997 to 2013 period, ranging from a low of 12 tonnes in both 1997 and 1998 to a high of 88 tonnes in 2002 (although landings reached 87 tonnes in both 2004 and 2008). Landed values peaked at $1.2 million in 2004 and 2008 in association with the high landings, and also in 2013 when landings were 56 tonnes.
Landings in SFA 29 West, by Full Bay and East of Baccaro licences with access, peaked at 714 tonnes in 2002 and then fluctuated before declining to 160 tonnes in 2013. The Full Bay licence holders accounted for 100 percent of SFA 29 West landings in 2001, and averaged 73 percent from 2002 to 2009 with those Inshore East of Baccaro licence holders with access accounting for the remainder. Landed value for SFA 29 West declined from a high of $8.0 million in 2002 to $3.5 million in 2013.
Landings for the Inshore East of Baccaro fleet declined from 103 tonnes in 2001, subsequently declined and fluctuated in a range from 7 to 57 tonnes; fleet landings in 2013 were 40 tonnes. Landed value for the Inshore East of Baccaro fleet reached $0.9 million in 2013, up from $0.2 million in 2010.
Figure 3.3 contains charts showing the landings and landed value by Inshore Scallop fleet in the Maritimes Region over time. Landings and landed value data is for the calendar year.
Figure 3.3 (a-e): Maritimes Region Inshore Scallop
Landings (tonnes of meat) and Landed Value ($ millions) by Fleet/Fishery
Source: Department of Fisheries and Oceans, Maritimes Region
Vessel Activity
The number of active vessels in the Inshore Scallop fishery varies by fleet. The Mid Bay fleet has the highest participation, with 120 active vessels in 2013. The Full Bay (SPA 1-7) fleet was the next highest with 66 active vessels. In SFA 29 West, there were 59 active vessels in 2013. The Inshore East of Baccaro fleet and the Upper Bay fleets had 52 and 13 active vessels respectively.
Figure 3.4 shows the vessel activity by fleet from 1997 to 2013p. Vessel activity for the Full Bay (SPA 1-7) and Mid Bay fleets have fluctuated and declined over time.
Note that the vessel activity for SFA 29 West prior to 2010 is separated by the original licence holder group shown as either SFA 29 West (Full Bay, or ‘FB’) or SFA 29 West (Inshore East of Baccaro, or ‘EoB’). Activity in this area has fluctuated but has remained relatively stable.
Vessel Activity by Fleet/Fishery, 1997-2013p
Source: DFO Maritimes Region
Average Landed Price
The average landed price of Scallop for the Inshore Scallop fishery in the Maritimes Region declined from late 1990s highs of nearly $19.00 per kilogram ($8.50 per pound) to around $11.50 per kilogram ($5.23 per pound) by 2002. The average price remained around $13.00 per kilogram ($5.90 per pound) through the 2000s before dropping to $11.30 per kilogram ($5.13 per pound) in 2010. The price increased beginning in 2011 and reached $21.63 per kilogram ($9.86 per pound) in 2013 (p), rising above the nominal levels of the late 1990s.
Figure 3.5 shows the average inshore landed price for Scallop in the Maritimes Region from 1997 to 2013p.
Average Landed Price (Meat Weight), 1997-2013p
Source: DFO Maritimes Region
Average Landed Value per Active Licence
The average landed value per active licence for the Inshore Scallop fishery varies substantially by fleet. In 2013, the average landed value per active licence ranged from a high of nearly $250,000 for the Full Bay fleet to just over $15,000 for the Inshore East of Baccaro fleet. Average landed values per active licence for the other inshore fleets/ fisheries were: Upper Bay, $92,300; 29 West ITQ, $59,500; and, Mid Bay $52,100.
Figure 3.6 provides a graphical representation of the Inshore Scallop average landed value per active licence by fleet for 2013.
Average Landed Value per Active Licence by Fleet/Fishery (2013)
Source: DFO Maritimes Region
Area Dependency (by County)
In terms of Inshore Scallop landed value by county in 2012, Nova Scotia’s Digby County had the greatest landed value at $12.9 million, or 54 percent of the regional Inshore Scallop total. Yarmouth County, also in Nova Scotia, was next with $5.0 million or 21 percent. Other counties in Nova Scotia and counties in southwestern New Brunswick had $2.5 million and $3.4 million respectively. (Data for 2012 was used to look at county dependence, as the Maritimes Region 2013 data for all species was preliminary.) Figure 3.7 shows the landed value of Inshore Scallop by county.
In relation to the total commercial landed value in the county for 2012, the counties most dependent on Inshore Scallop were Digby County and Cumberland County in Nova Scotia. In Digby County, Inshore Scallop landed value represented 17.4 percent of the total commercial landed value in 2012, while Cumberland County’s inshore Scallop landings represented 17.2 percent. The total Inshore Scallop landed value in these two counties differed greatly, however, with $12.9 million in Digby County and $0.9 million in Cumberland County.
Landed Value by County ($, % of Inshore Scallop total), 2012
Source: DFO Maritimes Region
3.4 Fishing Areas
Among the inshore fleets, the Bay of Fundy is the most active scallop harvesting area in the Maritimes Region. Figure 3.8 shows the major areas where sea scallops are harvested in the Maritimes Region, excluding Georges Bank. As indicated by the graphic, the majority of the inshore scallop is harvested in the Bay of Fundy. There is also a concentrated harvest area West of 65°30’ (Baccaro) in SFA 29.
Atlantic Regions from DFO Oceans and Coastal Management Branch.
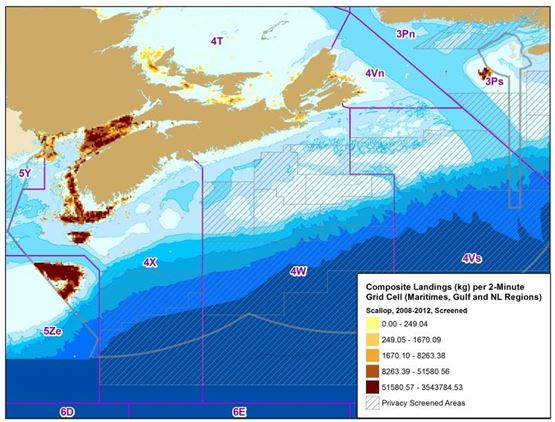
Source: DFO Maritimes Region
- Date modified: