
Snow Crab (Chionoecetes opilio) -
Newfoundland and Labrador - 2009-2011
Table of contents
2.0 STOCK ASSESSMENT AND STATUS
- 2.1 Species Biology
- 2.2 Science
- 2.3 Commercial Catch Rates
- 2.4 Inshore Trap Surveys
- 2.5 Multi-Species Bottom Trawl Surveys
- 2.6 Bitter Crab Disease
- 2.7 Indirect Effects of Fishing
- 2.8 Predation
- 2.9 Sources of Uncertainty
- 2.10 Handling Mortality
- 2.11 Outlook for 2009
- 2.12 Additional Information
- 2.13 Research Documents
- 2.14 Management Considerations
7.0 MANAGEMENT MEASURES
- 7.1 Integrated Fisheries Management Plan - Effective 2009
- 7.2 Total Allowable Catch
- 7.3 2009 Quotas Inside 200 Miles
- 7.4 Individual Quotas
- 7.5 Fishing Seasons
- 7.6 Trip / Week Landing Limits & Landing Weeks
- 7.7 Trap Limits
- 7.8 Control and Monitoring of Removals
- 7.9 Amendments to Management Plan
- 7.10 Other Management Measures
- 7.11 Licensing
LIST OF TABLES
- Table 1: Snow Crab Landings, Landed Value & Price (1990- 2008)
- Table 2: Number of Active Crab Vessels - by Vessel Length
- Table 3: Crab as percent of Total Landed Value by Fleet & Homeport & NAFO Division – 2008
- Table 4: Average Snow Crab Landings (tonnes) Per Licence by Licence Type
- Table 5: Crab Processors - Newfoundland & Labrador (1999-2008)
- Table 6: Crab Export Volume and Value - by Destination - 2008
- Table 7: Snow Crab Fishing Areas
- Table 8: Total Allowable Catch 2009
- Table 9: 2009 Snow Crab Fishing Seasons
- Table 10: Weekly and Trip Limits for 2009
- Table 11: Snow Crab trap limits - 2009
- Table 12: Snow Crab Licences 2009
List of figures
- Figure 1: Spatial distribution of commercial fishing effort during 2008
- Figure 2: Trends in landings by NAFO Division and in total
- Figure 3: Trends in the multi-species survey exploitable biomass and abundance indices, for Div. 2J3KLNO during fall (above) and for Div. 3LNOPs during spring (below).
- Figure 4: Total Allowable Catch (1999 – 2008)
- Figure 5: Weekly landings for <65’shimp fleet and <65” Crab fleet – 2008
- Figure 6: Crab Average Landed Price (1990 – 2008)
- Figure 7: US Import Price – NL Snow Crab, Cluster, 5-8oz (US$/Lb)
FORWARD
The purpose of this Integrated Fisheries Management Plan (IFMP) is to identify the main objectives and requirements for the Newfoundland and Labrador Region Snow Crab (Chionoecetes opilio) fishery in NAFO Divisions 2HJ, 3KLNOPsn, and 4R. The plan will encompass activities in Crab Fishing Areas (CFA) 1-12, as well as the management measures that will be used to achieve these objectives. This document also serves to communicate information on the fishery and its management to DFO staff, legislated co-management boards and other stakeholders. This IFMP provides a common understanding of the basic “rules” for the sustainable management of the fisheries resource.
This IFMP is not a legally binding instrument which can form the basis of a legal challenge. The IFMP can be modified at any time and does not fetter the Minister’s discretionary powers set out in the Fisheries Act. The Minister can, for reasons of conservation or for any other valid reasons, modify any provision of the IFMP in accordance with the powers granted pursuant to the Fisheries Act.
Where DFO is responsible for implementing obligations under land claim agreements, the IFMP will be implemented in a manner consistent with these obligations. In the event that an IFMP is inconsistent with obligations under land claim agreements, the provisions of the land claim agreements will prevail to the extent of the inconsistency.
James W. Baird
Regional Director General
Newfoundland and Labrador Region
INTRODUCTION
This Integrated Fisheries Management Plan (IFMP) sets out the policy of the Minister of Fisheries and Oceans Canada (DFO) with respect to the management of the Newfoundland and Labrador Snow Crab fishery. As with any policy, the Minister retains the discretion to make exceptions to or to change this policy at any time. It is, however, the expectation and intention of DFO to follow the management process set out in this IFMP with a view to contributing to increased certainty and direction for this fishery.
This IFMP is effective April 1, 2009. After that period, the IFMP may be rolled over annually. While the elements of this plan will remain in effect for the lifespan of the plan, there will be annual reviews of the status of the resource and quotas will be adjusted accordingly. Those interested should consult Fisheries and Oceans Canada’s fisheries management decision website for full details on annual quotas, seasons and other management measures.
Long and short term objectives in the Snow Crab fishery allow for the introduction of a more structured, systematic and inclusive approach to fisheries management. With the application of objectives, resource users and DFO are able to work together to develop clear, measurable, long term fisheries management decisions for the fishery. Decisions on short and long term objectives will assist in providing a framework to quantify fisheries management directives as well as risk analysis processes. DFO sectors (including Science and Fisheries and Aquaculture Management) play key roles that interact with the fishing industry and the Government of Newfoundland and Labrador, through the Department of Fisheries and Aquaculture.
1.0 OVERVIEW OF THE FISHERY
1.1 History of the Fishery
The first Snow Crab landings in Newfoundland occurred in the late 1960s as by-catch in the groundfish gillnet fisheries in Trinity Bay. During the 1970s, directed Snow Crab fisheries developed along the northeast coast, primarily in NAFO Division 3L, eventually spreading into 3K. Crab fishing occurred sporadically in NAFO sub-division 3Ps in the 1970s but did not occur on a regular basis until the mid-1980s. Small-scale exploratory fisheries started in 4R in the late 1980s, initially in Bay St. George and Bay of Islands; with the first significant landings occurring in the early 1990s. The fishery in Labrador, NAFO Division 2J, began in the mid-1980s.
Individuals who harvested Snow Crab in Newfoundland & Labrador prior to the expansion of the fishery in the 1980s were designated as “fulltime” licence holders. Virtually all these license holders currently operate vessels that are in the 50’ to 64’11" range (15 to 20 m). Initially, harvesters with fulltime licenses operated in areas fairly close to shore but have since moved to harvest Crab beyond 50 miles from land.
“Supplementary” fisheries were implemented in 2J, 3K and 3Ps in 1985 and in 3L in 1987. These fisheries were developed to provide harvesters access to Snow Crab to supplement incomes negatively affected by declining groundfish resources. Supplementary licence holders in all areas utilize vessels ranging in length from 34’ to 64’11". In 1994, the supplementary fleet in 3L was divided on the basis of gross registered tonnage (grt). Those harvesters with vessels 40 grt or greater were designated as the large supplementary fleet, while those with vessels less than 40 grt were designated the small supplementary fleet. The two 3L supplementary fleets were separated spatially in 1997 and given access to different quotas. The large supplementary fleet fished farther from land in the same areas as the fulltime fleet. This resulted in the small supplementary and inshore fleets having sole access to the Snow Crab resources inside 50 miles.
In Divisions 2J and 3K, the supplementary and fulltime fleets fish in the same areas. There are no fulltime licences in 3Ps.
Temporary seasonal Snow Crab permits were first issued to operators of vessels less than 35’ (in length overall) in 1995. As the name indicates, these were temporary permits, issued on a seasonal basis, to small boat enterprises in response to increasing Snow Crab resources and declining groundfish resources on which the enterprises had traditionally depended. Harvesters developed selection criteria with random draws conducted to determine who would participate and approximately 400 permits were issued. From 1996 to 1998, temporary seasonal permits were made available to all heads of Core enterprises with vessels less than 35’ who opted to participate within the criteria established by fishers. The number of participating enterprises increased annually as overall Snow Crab quotas increased and groundfish declines or moratoria continued.
On February 14, 2003, the Minister announced the conversion of temporary seasonal Snow Crab permits to inshore Snow Crab licenses. Those fishers who held a temporary seasonal Snow Crab permit in any one of 2000, 2001, or 2002 were eligible to receive an inshore Snow Crab licence in 2003. These licences continue to be issued annually. (Consult the Newfoundland and Labrador Regional Licencing Policy for a complete description of the conversion process.)
1.2 Type of Fishery
The Newfoundland and Labrador Snow Crab fishery is a commercial fishery. The minimum legal mesh size of traps allows small crabs, both female and undersize males to escape. Any under-sized crabs that are retained in the traps are returned to the sea by the harvester.
In the late 1980s, quota control was initiated in all management areas. All fleets have designated trap limits, quotas, fishing areas, and in many cases differing seasons. Fishing seasons have become progressively earlier and the fishery has recently been prosecuted predominately in spring, resulting in reduced incidence of soft-shelled crabs in the fishery. A grid based soft shell protocol was initiated in 2004 that results in closure of localized areas when the percent of soft-shelled crab within the legal-sized catch exceeds 20%. In 2009, the 3L Snow Crab fishery implemented a soft shell protocol with a tolerance of 15%.
The fishery is managed as an individual quota (IQ) of fishery. IQ levels are determined based on the number of licence holders and the fleet quota in a particular fishing area. IQ levels vary, depending on vessel size, geographical location, and fleet allocations.
As a means to ensure compliance with regulations regarding the area fished, mandatory use of the electronic vessel monitoring system (VMS) was fully implemented in all fulltime and supplementary fleets in 2004.
1.3 Type of Fishing Gear
Crab harvesters use fleets of conical baited traps with a minimum legal mesh size of 65mm. The minimum legal size Snow Crab that can be retained is 95 mm carapace width (CW). This regulation excludes females from the fishery while ensuring that a portion of the adult males in the population remains available for reproduction.
1.4 Participants
During the period between 2003 and 2008, approximately 3,498 enterprises with vessels less than 65’ participated in the Snow Crab fishery. In 2009 this number has been reduced to 3,455 resulting from the implementation of enterprise combining. In 2009, approximately 10,000 individuals (enterprise owners and crew) participated in the Newfoundland and Labrador Snow Crab fishery.
1.5 Location of the Fishery
This management plan covers Snow Crab fisheries in NAFO Divisions 2 and 3 as well as the 4R3Pn portion of Crab Fishing Area (CFA) 12. CFA 13 in northern 4R is co-managed by the Newfoundland & Labrador and Québec Regions. Management measures for CFA 13 are included in the Zone 13 Snow Crab Integrated Fisheries Management Plan.
Individuals licensed to fish Snow Crab have access to specific fleet sector quotas in the NAFO Division in which they reside. The location of fishing activity is determined by the location of Crab fishing areas within each NAFO Division. Crab fishing areas were established as a mechanism to control the distribution of fishing effort and to prevent local over-exploitation. Beginning in the mid-1990s there was an expansion in the range of fishing activity, with vessels fishing as far as the 200-mile limit and beyond.
Effort has increased since the 1980s and has been broadly distributed in recent years (Fig. 1). This expansion can be largely attributed to the demonstrated broad distribution of Crab in virtually every NAFO Division.
1.6 NAFO Division Landings
Landings in all areas combined were less than 5,000 metric tonnes (mt) annually for most of the 1970s and subsequently increased to over 10,000mt by the end of that decade (Fig. 2). During the 1979 to 1984 period, landings were fairly stable and averaged approximately 12,000mt. This period was followed by a gradual decline to 6,700mt in 1987. Regular increases in landings occurred after that and in 1999 attained an all-time high of more than 69,000mt; largely due to expansion of the fishery to offshore areas. Landings decreased by 20% to 55,400mt in 2000 and changed little until it decreased to 44,000mt in 2005 on a quota of 50,000mt. The shortfall was due mainly to an early closure of the fishery in Division 3K as a result of a high incidence of soft shelled Crab. In 2006, approximately 47,248mt on a quota of 46,233t was caught. Landings in 2008 were approximately 52,749mt on a quota of 54,338mt. Historically, most of the landings have been from Divisions 3KL.
The large increases in Snow Crab landings in the late 1990s were due to two basic factors:
- Historically high biomass as a result of successive years of good recruitment; and
- A substantial expansion in the range of fishing activity, with vessels fishing up to and beyond 200 miles from shore.
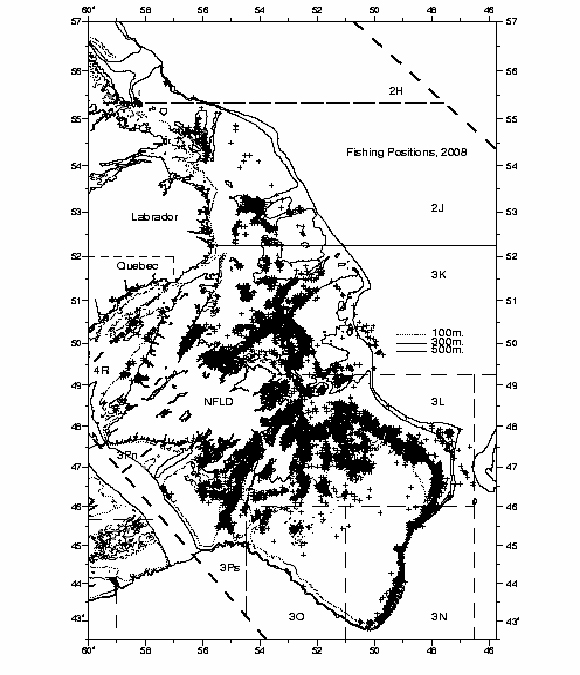
Figure 1: Spatial distribution of commercial fishing effort during 2008
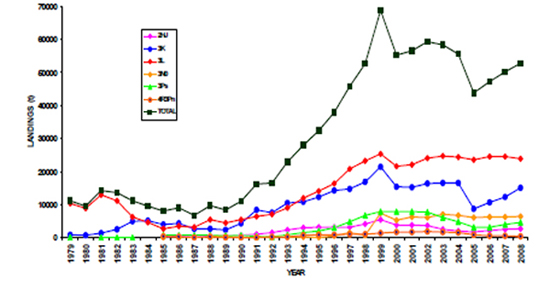
Figure 2: Trends in landings by NAFO Division and in total
1.7 Time Frame of the Fishery
Traditionally, the Snow Crab fishery in 3L and 3Ps commences in early May, subject to favourable environmental conditions. More recently, the Snow Crab fishing season has opened in early April and harvesters participate as environmental conditions in the different fishing areas permit. In the past, the length of the fishing season varied and included a late fall fishery with a mandatory closure during the peak soft shell period of August and September. In 2000, the season ended on December 15 with a 2 month in-season closure for soft shell during August and September.
An analysis of landings data showed that in the past, 90-95% of the Snow Crab harvest around the Island has occurred before the end of July. Harvesting the remaining 5-10% in August (peak soft shell period) was considered to be a lower conservation risk than harvesting this amount in an extended autumn fishery on soft and new hard shell Crab. Beginning in 2001, the closing date was set at August 31 and areas with a high incidence of soft shell were closed to fishing as required. Areas closed due to soft shell do not re-open for the remainder of the fishing season.
1.8 Consultative Process & Integrated Approach
Extensive consultations are held throughout the region annually, with invitations extended to the Fish Food and Allied Workers Union (FFAW), the Association of Seafood Producers (ASP), Seafood Producers of Newfoundland and Labrador (SPNL), the provincial government and harvester committees representing the different fleet sectors on an area by area basis. At each meeting there is a discussion of current management measures, an update on the latest science information and priorities for the upcoming fishery. Harvesters provide a synopsis of the past years’ fishery in their respective areas which includes their view on the state of the resource and recommendations for management measures, including quota levels, for the upcoming season.
1.9 Management Style
This fishery is managed under a Total Allowable Catch (TAC). The TAC is based on harvesting a percentage (exploitation rate) of an estimate of the commercially available biomass (fishable biomass). This exploitation rate would aim to optimize the yield while at the same time reduce the risk of over exploiting the resource.
The primary considerations in the management of the Snow Crab fishery in the Newfoundland and Labrador Region are:
- Maintaining the reproductive potential of the resource;
- Achieving a sustainable commercial harvest of legal sized crab;
- Minimizing wastage through the proper handling of undersize and soft shell crab.
Snow Crab is managed by prohibiting the capture of all females as well as males below 95 mm carapace width. Primarily, this is achieved by regulating the size of the mesh in crab traps. This overall management strategy is aimed at ensuring that the total harvest has a relatively low impact on the reproductive potential of the Snow Crab resource in which females, undersize males and unharvested legal-sized males are sufficient to maintain Snow Crab reproduction.
To achieve commercial sustainability, quotas are established based on exploitation rates that can be maintained over the medium to long term.
Throughout the 1970s, 1980s and into the 1990s, all Snow Crab fisheries in the Newfoundland and Labrador Region were conducted on a competitive basis. Individual quotas were implemented for the first time in 1995. During that year the full-time fleet in 3K participated in a pilot IQ program. In addition, all enterprises that were issued temporary seasonal permits during 1995 fished with an individual or boat quota. The use of individual quotas expanded after 1995 and currently all fleets are fishing under this management regime.
As the fishery has developed, fishing seasons were modified to limit fishing during peak soft shell periods. Despite soft shell monitoring, serious concerns remained with the level of soft shell Crab encountered in the fishery, in particular in Divisions 2J, 3K and subdivision 3Ps. For 2009, a management approach was implemented that included an early season opening, shorter fishing seasons, strict soft shell protocols, improved observer coverage and decreased quotas in some areas. The shortened fishing seasons are meant to provide additional protection during periods when the incidence of soft shell Crab is high.
2.0 STOCK ASSESSMENT AND STATUS
2.1 Species Biology
The Snow Crab life cycle features a planktonic larval period following spring hatching, and involves several stages before settlement. Benthic juveniles of both sexes molt frequently, and at about carapace width of 40 mm (˜ 4 years of age) they may become sexually mature.
Crabs grow by molting in spring. Females cease molting after sexual maturity is achieved at about 40-75 mm CW and so do not contribute to the exploitable biomass. Conversely, sexually mature (adolescent) males may continue to molt annually until their terminal molt; in which they develop enlarged claws (adults), which enhances their mating ability. Males may molt to adulthood within a size range of about 40-115 mm CW, and so only a portion of any cohort will recruit to the fishery at 95 mm CW (˜ 8 years of age).
Adult legal-sized males remain new-shelled with low meat yield throughout the remainder of the year of their terminal molt. They are considered to be pre-recruits until the following year when they begin to contribute to the exploitable biomass as older-shelled adults. Males may live about 5-6 years as adults after their terminal molt.
Large males are most common on mud or mud/sand substrates, while smaller Crabs are common on harder substrates. Snow Crab diet includes fish, clams, polychaete worms, brittle stars, shrimp, Snow Crab, and other crustaceans. Predators include various groundfish, other Snow Crabs, and seals.
Effects of temperature differ throughout the life cycle of the Snow Crab. Cold conditions in early life favour survival while in later life they permute early molt, thereby reducing the proportion that will recruit to the fishery. Negative relationships between bottom temperature and Snow Crab catch per unit effort (CPUE) have been demonstrated at lags of 6-10 years suggesting that the positive effects on recruitment in cold conditions in the life history are stronger than the negative effects in later life. A warm oceanographic regime has persisted over the past decade implying poor long term recruitment prospects relative to the strong recruitment of the late 1990s.
2.2 Science
Resource status is evaluated based on trends in fishery CPUE, exploitable biomass indices, recruitment prospects and mortality indices. Information is derived from multi-species bottom trawl surveys conducted during the fall in Divisions 2J3KLNO and during the spring in sub-division 3Ps. The trawl used in these multi-species surveys was changed to a Campelen shrimp trawl in the fall of 1995 and this trawl proved to be more efficient in sampling Crabs than the previously used groundfish trawl. Snow Crab sampling during the spring sub-division 3Ps surveys did not begin until 1999.
The fall post-season trawl survey was conducted in Division 2H during 1996-1999, 2004, 2006 and 2008. Spring (pre-fishery) trawl surveys are considered to be less reliable than the fall (post-fishery) surveys because some population components are relatively poorly sampled during spring when mating and molting take place. Information was also available from an Industry-DFO collaborative post-fishery trap survey initiated in 2003. Fall post-season surveys provide the most recent data available for the annual regional assessment process (RAP). Information is also utilized from DFO inshore trap and trawl surveys in Divisions 3KL, fishery data from logbooks and observer catch-effort data, as well as biological sampling data from multiple sources.
The resource is assessed separately for offshore and inshore areas of each division, where appropriate (Divisions 3KLPs4R). Divisions 3NO represent a full offshore area, and there is no distinction between inshore and offshore areas in Divisions 2HJ. More data are available in most divisions for offshore than for inshore areas. Trawl survey data are used only for offshore areas because these surveys have not consistently extended into inshore areas. At-sea observer coverage and sampling has also been more extensive in offshore than inshore areas. In addition, electronic vessel monitoring (VMS) devices are used only on offshore vessels. An annual post-season multi-species fall bottom trawl survey provides an index of the exploitable biomass available for the fishery in the following year.
2.3 Commercial Catch Rates
As a result of changes in management measures and fishing practices (spatial and temporal), changes in commercial catch rates may not reflect changes in the stock status or resource abundance. Year-to-year changes in catch rates have not been used to infer changes in stock status. However, it is considered possible to interpret catch rates in the context of longer-term trends. Commercial catch rates in the 1990s were considerably higher than in the 1980s, and, with the exception of 2J and 3Ps, have remained relatively stable through 2008.
2.4 Inshore Trap Surveys
Research surveys using commercial and small-meshed traps have been carried out by DFO in a number of CFAs in Division 3L since the early 1980s and in Division 3K since 1994. Sampling with a small shrimp trawl modified to enhance catchability of Snow Crab has been conducted since 1996 as well. Preliminary analysis of the shrimp trawl data indicates that this gear can effectively catch very small Crabs. However, a positive correlation between trawl and commercial trap catch rates has not been demonstrated. A longer time series is required in order to fully evaluate its utility as an early indicator of relative year-class strength.
In response to the industry representation, an Industry and DFO working group was established to assess current Snow Crab science and work toward implementing measures to enhance it. An initial outcome of the working group was the implementation of a post season trap survey conducted by the industry. This survey started in 2003 and continues to be conducted in most areas. It is anticipated that this survey will provide an additional fishery independent data source to be used in the stock assessment process.
2.5 Multi-Species Bottom Trawl Surveys
The annual multi-species fall bottom trawl survey (a post-season survey with respect to Snow Crab) provides an index of the exploitable biomass (older-shelled adults of legal size) available for the fishery in the following year. It also provides data on adolescents larger than 75 mm that are used to project an index of pre-recruit legal-sized males that would result from imminent molting in the spring. These new-shelled Crabs would begin to recruit to the fishery as older hard-shelled adults one year later.
A study has shown that the catchability of the Campelen trawl decreases with decreasing crab size. Also, catchability is lower on hard bottom than on soft bottom. Consequently, catchability is particularly low for the smallest crabs on the shallow-water hard substrates and is highest for the largest crabs on deep mud substrates. Because Crab distribution changes between years resulting in variable distribution by substrate type, additional inter-annual variability is introduced to the survey results. All of these lead to uncertainties in the interpretation of year-to-year changes and further research is required to clarify the impact on survey estimates.
Industry has not fully supported the multi-species survey and question its usefulness in assessing the Crab resource.
2.6 Bitter Crab Disease
This disease, which is fatal to Crabs, occurs in new-shelled Crab of both sexes and appears to be acquired during moulting. There had been a broadly-distributed incidence of Bitter Crab Disease during 1996-2006, but the distribution contracted primarily to Division 3K in 2007. Prevalence has changed little overall in 2008, but there is considerable spatial variability in its distribution. The management measures for handling crab with Bitter Crab Disease can be found in Section 7.10.
2.7 Indirect Effects of Fishing
Gillnet fisheries for groundfish impose an un-quantified fishing mortality on Snow Crab. Snow Crab and Shrimp fisheries occur on common grounds in Divisions 2J3K. Preliminary results of a 2005 study indicated that bottom trawling is associated with an increased incidence of crab leg loss. However there is no evidence that shrimp trawling imposes a substantial mortality on Snow Crab.
An area of the Hawke Channel has been closed to all fisheries except Snow Crab during 2002-2008. It would be premature to draw any conclusions regarding the impact of this closure on the Snow Cab resource. An area of 3K, in the Funk Island Deep, was first closed to gillnetting in 2002 and then closed to bottom trawling through a combination of mandatory and voluntary closures in 2005.
Ghost fishing by lost gillnets and crab traps have been reported but the associated Snow Crab mortality is un-quantified.
2.8 Predation
The abundance of predatory groundfish species has remained low since the early 1990s, but the implications for mortality are unknown. Cannibalism is known to occur but there are no data on spatial or annual variation in its prevalence.
2.9 Sources of Uncertainty
A major source of uncertainty is a lack of reliable fishery-independent indices, or limited time series, in some divisions, particularly Divisions 3NO and offshore Division 4R.
The CPUE series are not standardized. There is uncertainty regarding the effects of changes in some fishing practices (e.g. location, seasonality, soak time, trap mesh size and high-grading) on catch rates and their interpretation. The reliability of the logbook data is uncertain with respect to effort and areas fished.
Pre-recruit fishing mortality indices based on observer data are uncertain due to low observer coverage and, more importantly, seasonal and spatial variation in the distribution of observer coverage.
There is also uncertainty about pre-recruit indices based on undersized Crabs, from observer as well as post-season collaborative trap surveys, because of unknown and variable proportions of undersized adults (terminally molted) that will never recruit to the fishery. This is especially prevalent in sub-division 3Ps where a large component of the total discards is comprised of undersized Crabs.
Exploitable biomass and recruitment indices from multi-species trawl surveys may be affected by variation in catchability of Crabs by the survey trawl. Furthermore, important strata in Division 3L were not surveyed in 2004 and most strata of Subdivision 3Ps were not surveyed in 2006.
There is uncertainty in interpreting trends in exploitable biomass and recruitment from the industry-DFO collaborative trap survey data because the time series is short. There is additional uncertainty related to limited spatial coverage, especially in Divisions 2J and 3NO.
2.10 Handling Mortality
Mortality of young Crab (pre-recruits) can significantly affect future recruitment. Data from recent experiments indicate that Crab mortality from poor handling practices can be significant. Although the current impact is not quantifiable, DFO continues to have concerns with the possible mortality levels inflicted on Crab from handling practices related to high grading and discarding, particularly of soft-shelled crab.
2.11 Outlook for 2009
It is anticipated that the survey outlook for 2010 and 2011 will be prepared annually prior to the opening of the fishery.
Overall Resource Status
The multi-species trawl surveys indicate that the exploitable biomass declined from the late 1990s to 2003-2004, but has since increased (Fig. 3). The fall post-season surveys in Divisions 2J3KLNO indicate that the exploitable biomass was highest during 1996-1998. The more limited time series from spring multi-species surveys in Divisions 3LNOPs also indicated a decline in exploitable biomass in the early years of the surveys. The spring and fall surveys both showed decreases in the exploitable biomass indices from 2001 to 2003-2004, with little change until the fall index increased in 2007.
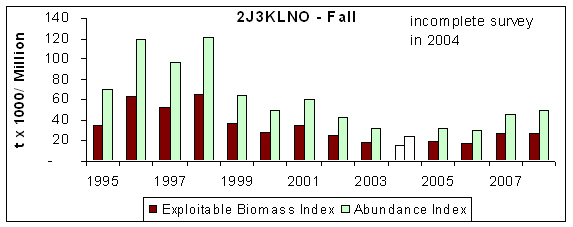
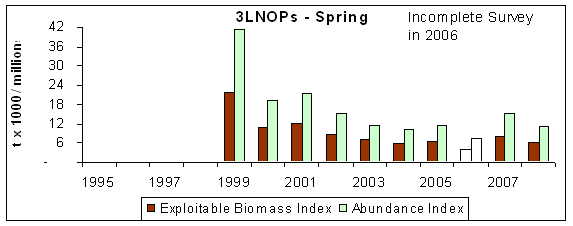
Figure 3: Trends in the multi-species survey exploitable biomass and
abundance indices, for Div. 2J3KLNO during fall (above) and for Div. 3LNOPs
during spring (below).
The results from the 2009 stock assessment are noted below:
- Total landings increased by 20% since 2005 to 52,800mt in 2008.
- The multi-species trawl surveys indicate that the exploitable biomass declined from the late 1990s to 2003, but has since increased.
- Recruitment has increased overall since 2005.
- Longer-term recruitment prospects are uncertain.
Division 2H
- A commercial TAC was first established in 2008, at 100mt, and landings totalled 140mt.
- The exploitable biomass has decreased in recent years. The post-season trawl survey exploitable biomass index doubled between 2004 and 2006, but has since decreased by 66%.
- Recruitment has decreased since 2004 and is expected to be low over the next several years.
- Maintaining the current level of fishery removals would likely result in an increase in the exploitation rate in 2009.
Division 2J
- Landings increased by 60% from 1,500mt in 2005 to 2,400mt in 2008, following a decline since 2002, while effort declined by 18%.
- CPUE has increased steadily since 2004 to the long-term average.
- The exploitable biomass decreased in 2008. The post-season trawl survey exploitable biomass index increased from 2002-2007, remaining below levels observed prior to 2002. This index and the post-season trap survey index both decreased in 2008.
- Post-season trawl and trap surveys indicate that recruitment will decrease in 2009 and remain relatively low in the short term.
- The exploitation rate index and the pre-recruit fishing mortality index both declined sharply from 2003-2005 and have since changed little.
- Maintaining the current level of fishery removals would likely result in an increase in the exploitation rate in 2009.
Division 3K Offshore
- Landings almost doubled from 5,970mt in 2005 to 11,600mt in 2008 after decreasing sharply in 2005. Effort declined by 50% from 2005-2007 and increased by 12% in 2008.
- CPUE increased sharply from 2005 to a record high level in 2008.
- The exploitable biomass increased substantially in recent years and remains relatively high, as indicated by both post-season surveys.
- Recruitment remains promising for the next several years.
- The trawl survey exploitation rate index has declined slightly over the past 3 years. The pre-recruit fishing mortality index decreased sharply in 2006 and has since changed little.
- Maintaining the current level of fishery removals would not likely substantially change the exploitation rate in 2009.
Division 3K Inshore
- Landings increased by 28% from 2,700mt in 2005 to 3,460mt in 2008, after decreasing by 21% from 2004-2005, while effort declined by 48%.
- CPUE increased sharply from 2005 to a record high level in 2008.
- The exploitable biomass increased substantially to 2006 and remains relatively high. The fall trap survey exploitable biomass index increased from 2004-2006 and since changed little.
- Recruitment prospects are uncertain.
- The trap survey-based exploitation rate index changed little since 2005. Data are insufficient to estimate pre-recruit mortality rates.
- Maintaining the current level of fishery removals would not likely substantially change the exploitation rate in 2009.
Division 3L Offshore
- Landings have averaged about 20,000mt since 2000, while effort has increased steadily to its highest level in 2008.
- CPUE has declined steadily from 2000-2008, to the lowest level since 1991.
- Trends in the exploitable biomass are uncertain but levels remain low. The exploitable biomass index declined sharply in both post-season surveys in 2006. It has since remained low in the trap survey but has increased in the trawl survey over the past two years.
- Both post-season surveys indicate that recruitment has been increasing and is expected to increase further over the next two to three years.
- The exploitation rate index remained at a high level in 2008 while the pre-recruit fishing mortality rate index decreased to about the long-term average.
- The ratio of pre-recruits to exploitable crab is expected to increase to a high level due to the low biomass and increasing recruitment. This could pose a risk of high fishery-induced mortality to soft-shelled immediate pre-recruits in 2009.
Division 3L Inshore
- Landings increased by 12% from 6,100mt in 2005 to 6,825mt in 2008, while effort decreased by 23%.
- CPUE increased by 53% from 2004 to 2008.
- The post-season trap survey exploitable biomass index indicates the exploitable biomass increased from 2004-2006 and changed little since.
- Recruitment prospects are uncertain.
- The trap survey-based exploitation rate index changed little since 2005. Data are insufficient to estimate pre-recruit mortality rates.
- Maintaining the current level of fishery removals would not likely substantially change the exploitation rate in 2009.
Divisions 3NO
- The fishery has been primarily concentrated along the shelf edge. Landings increased by 22% from 3,600mt in 2005 to 4,400mt in 2008 while effort increased by 57%, to an all-time high in 2008.
- CPUE has declined since 2002, to its lowest level in 2008.
- Trends in the exploitable biomass are uncertain as survey indices are unreliable.
- Recruitment has been increasing and is expected to increase further over the next two to three years.
- The abundance of pre-recruits is expected to increase in 2009. This could pose a risk of high fishery-induced mortality to soft-shelled immediate pre-recruits in 2009.
Sub-division 3Ps Offshore
- Landings increased by 35% from 2,340mt in 2006 to 3,180mt in 2008, following a 46% decline from 2002-2006. Effort increased by 19% in 2007 and decreased by 25% in 2008 to its lowest level since 2001.
- CPUE has increased by 48% in 2008 but remains below the long-term average.
- Trends in the exploitable biomass are uncertain but the level remains low. The post season trap survey exploitable biomass index increased slightly since 2004. Meanwhile the pre-season trawl survey exploitable biomass index has shown no trend and remains well below pre-2001 levels.
- The pre-season trawl survey indicates that recruitment has been increasing and is expected to increase further over the next two to three years.
- Exploitation rate indices based on trap and trawl surveys have shown no consistent trend over the past 4 years. The trawl survey pre-recruit fishing mortality index has declined sharply since 2003 to a very low level.
- Maintaining the current level of fishery removals would not likely result in a substantial change in fishery-induced mortality.
Sub-division 3Ps Inshore
- Landings doubled from 660mt in 2005 to 1,350mt in 2008, following an 80% decline since 2002. Meanwhile, effort changed little since 2005 until it decreased by 22% in 2008.
- CPUE more than doubled since 2005 to the long-term average.
- The exploitable biomass has recently increased. The post-season trap survey exploitable biomass index increased substantially from 2006-2008.
- The post-season trap survey indicates that recruitment prospects remain promising in the short-term.
- The post-season trap survey-based exploitation rate index fluctuated without trend during 2005-2008. Data are insufficient to estimate pre-recruit fishing mortality rates.
- Fishery removals could likely be increased in 2009 without increasing the exploitation rate.
Division 4R Offshore
- Landings and effort peaked in 2002 before steadily declining to historical lows in 2006. Landings and effort have been variable in recent years, but remained at low levels.
- There are insufficient data to assess resource status.
Division 4R Inshore
- Landings declined by 74% from 950mt in 2003 to a record low of 250mt in 2008. Effort decreased sharply in 2005 and changed little since.
- CPUE has steadily declined since 2002 to its lowest level in 2008.
- Post-season trap survey catch rates show that the exploitable biomass declined from 2004–2006 and changed little since.
- Recruitment is expected to change little over the next 2-3 years.
- Maintaining the current level of fishery removals would likely result in little change in the exploitation rate in 2009.
2.12 Additional Information
The above information has been summarized from the approved Stock Status Report for Snow Crab for 2008. For additional and complete information please refer to the Canadian Science Advisory Secretariat website, Science Advisory Report 2008/009.
2.13 Research Documents
Colbourne, E., J. Craig. C. Fitzpatrick, D. Senciall, P. Stead and W. Bailey. 2009. An Assessment of the Physical Oceanographic Environment on the Newfoundland and Labrador Shelf during 2008. DFO Can. Sci. Advis. Sec. Res. Doc. 2009/nnn. In prep.
Dawe, E., D. Mullowney, D. Stansbury, D. Taylor, E. Colbourne, E. Hynick, P. Veitch, J. Drew, P. O’Keefe, D. Fiander, R. Stead, D. Maddock-Parsons, P. Higdon, T. Paddle, B. Noseworthy, and S. Kellend. 2008. An Assessment of Newfoundland and Labrador Snow Crab in 2007. DFO Can. Sci. Advis. Sec. Res. Doc. 2008/nnn. In prep.
2.14 Management Considerations
The actual exploitation rates in the Snow Crab fishery are unknown, because the catchability of legal sized Crabs by the survey trawl is unknown. However, it is believed to be less than 1.
The steady increase in the ratio of catch to exploitable biomass index in 2J3KLNO over the past four years is consistent with declining recruitment. However, this is not a conservation concern. Reproductive potential is protected by conservation measures that exclude females and males smaller than 95mm carapace width, including a portion of the adult (large-clawed) males, from the fishery. Therefore, any increase in exploitation rate is believed to have minimal impact on reproductive potential.
3.0 ECONOMICS OF THE FISHERY
3.1 Total Allowable Catch and Quota Allocation
In 2008 the Total Allowable Catch for the Snow Crab fishery was approximately 54,300 metric tonnes. This was a 14% increase over 2007. In recent years the TAC has been as high as 61,800mt (1999) and as low as 46,200mt (2006).
Historically, the Crab TAC had been much lower. As can be seen from the chart below, it had been as low as 10,500mt in 1990. In the early to mid-1990s, as cod catches declined, crab and shrimp abundance and harvesting increased significantly. From 1990 to 1999 the Crab TAC increased almost five-fold.
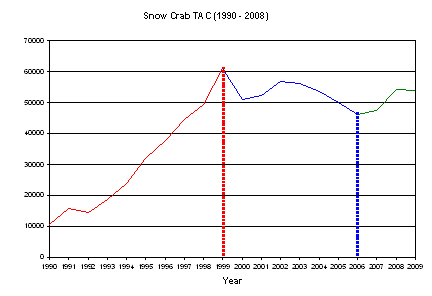
Figure 4: Total Allowable Catch (1999 – 2008)
The TAC decreased after 1999, rebounded slightly in 2001 and 2002 and further declined again 2006. Since 2006, the overall TAC has increased; reflecting improvements in abundance.
Crab quotas have not been distributed evenly across NAFO divisions. Quota allocations to fleet sectors reflect historical attachments as well as resource availability. The majority of the TAC has been allocated to 3K and 3L with these divisions accounting for 81% of the total quota allocation in 2008. Division 3L had the highest allocation with approximately 53% followed by 3K with 28%. Divisions 2J, 4R3Pn, 3NO and 3Ps have much smaller allocations reflecting lower resource availability.
The allocation to 3L has been very stable over time although there is evidence that resource availability at the 200 mile limit is declining. Allocations in other divisions have been more variable, reflecting changes in crab abundance. In particular, 2J, 3K and 3Pn experienced declines in quota throughout the mid-2000s. However, allocations have increased in 2007 and 2008 for 2J and in 2007, 2008 and 2009 for 3K.
The supplementary licence holders have the highest allocation, which is in the range of 55-60% followed by the inshore and the full-time group, respectively. There is a small aboriginal communal allocation in 2HJ which is about 19% of the division’s allocation in 2009.
3.2 Landings, Landed Value & Average Price
Crab landings in the province increased significantly in the early 1990s, consistent with quota increases stemming from improvements in resource abundance. This has been a very positive development in the Newfoundland and Labrador fishing industry. Crab landings peaked at 69,000 metric tonnes in 1999 reflecting strong resource availability at the time.
| Year | Landings (MT) | Landed Value ($M 000’s) |
Average Landed Price | |
|---|---|---|---|---|
| $/kgm | $/lb | |||
| 1990 | 11,053 | $13,159 | $1.19 | $0.54 |
| 1991 | 16,276 | $19,989 | $1.23 | $0.56 |
| 1992 | 16,441 | $12,973 | $0.79 | $0.36 |
| 1993 | 22,922 | $31,729 | $1.38 | $0.63 |
| 1994 | 27,922 | $87,197 | $3.12 | $1.42 |
| 1995 | 32,343 | $176,213 | $5.45 | $2.47 |
| 1996 | 37,970 | $96,832 | $2.55 | $1.16 |
| 1997 | 45,746 | $91,809 | $2.01 | $0.91 |
| 1998 | 52,672 | $102,214 | $1.94 | $0.88 |
| 1999 | 69,131 | $236,234 | $3.42 | $1.55 |
| 2000 | 55,434 | $267,639 | $4.83 | $2.19 |
| 2001 | 56,721 | $218,831 | $3.86 | $1.75 |
| 2002 | 59,417 | $229,240 | $3.86 | $1.75 |
| 2003 | 58,356 | $263,583 | $4.52 | $2.05 |
| 2004 | 55,675 | $300,670 | $5.40 | $2.45 |
| 2005 | 43,957 | $140,254 | $3.19 | $1.45 |
| 2006 | 47,238 | $100,683 | $2.13 | $0.97 |
| 2007 | 50,208 | $177,456 | $3.53 | $1.60 |
| 2008 | 52,746 | $179,503 | $3.40 | $1.54 |
3.3 Landing Patterns
The Crab fishery usually opens around the first week of April around the time of the spring melt. Shortened seasons and early closures have been implemented to protect the resource from the effects of fishing during times of soft shell. Thus, due to environmental and biological factors, the pattern of Crab landings is compressed and exhibits peak landings over a very short period.
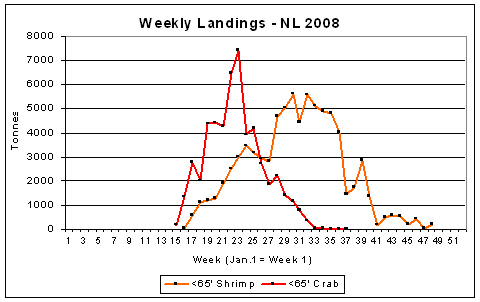
Figure 5: Weekly landings for <65’ shrimp fleet and <65” crab fleet – 2008
In addition, catch rates decline during the season which prompts harvesters to land catch as early as possible. The capacity that exists within the harvesting sector allows for a rapid capture of the quota. The high volume of landings over a short period stretches processing capacity and may be impacting product quality.
This has implications for market supply and market and landed prices since markets prefer predictable and consistent volume, price, and quality.
Catching the Crab IQ is the highest priority in the fishing plan for many enterprises. A significant number of large east coast (2J3KL) vessels have access to both Shrimp and Crab and these vessels begin to fish Shrimp after the Crab has been landed. These two harvests are unlikely to commence concurrently given the unique gear requirements to prosecute each fishery. Access to the Shrimp fishery allows enterprises to lengthen their fishing season and reduces the risk associated with relying on a single species.
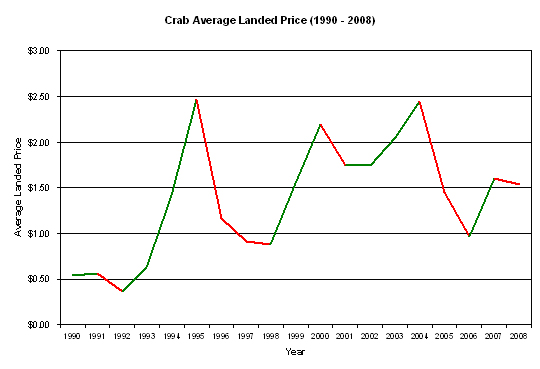
Figure 6: Crab Average Landed Price (1990 – 2008)
Landed price has been highly variable and reflects market forces. Landed prices from 2004 through to 2007 were determined every two weeks based on a price-to-market formula negotiated between the harvesters union and crab processors based on an independent market assessment. In 2004, the landed price was a record high of $2.45/lb. reflecting strong market demand. However, the following year the landed price was $1/lb. less and by 2006 the landed price had declined to $0.97/lb. - a 60% decline over the 2004 high.
The 2008, the negotiated landed price was a source of friction between harvesters and processors, which led the harvesters’ union to make a special appeal to the price setting panel. This resulted in a floor price of $1.50/lb. being set for the entire season. A similar situation in 2009 eventually resulted in a floor price of $1.35/lb.
High variability in landings and landed price has given rise to substantial swings in the overall landed value. The high value of landings in 2004 ($300 million) reflected an average landing amount but historically high landed prices. Landed value of $180 million in 2008 was lower than the historical high of 2004 due to relatively lower prices.
3.4 Active Vessels & Enterprises
The number of active vessels, active enterprises and the ratio of active enterprises/vessels can be used as performance measures of the Crab fishery since they trace the evolution of the Crab harvesting effort over time.
The number of active vesselsFootnote 1 engaged in the Crab fishery has declined by 23% over the last several years from a total of 2,720 in 2002 to 2,103 in 2008.
Much of the overall reduction can be attributed to significant reductions in the less than 40’ sector. This fleet, which has the most vessels engaged in the crab fishery (62% in 2007), has seen a decline in the number of active vessels by almost 25% since 2002.
The number of larger vessels engaged in this fishery has generally been stable over the period. The largest vessels in the less than 65’ fleet (55”-64’11”) actually saw modest increases in the number of active vessels over the period but returned to 2002 levels by 2007.
There are relatively few 65’ and greater vessels engaged in this fishery and their numbers have been stable over the period.
| Vessel Length | 2002 | 2003 | 2004 | 2005 | 2006 | 2007 | 2008 |
|---|---|---|---|---|---|---|---|
| < 35’ | 1,813 | 1,672 | 1,594 | 1,450 | 1,358 | 1,362 | 1,268 |
| 35 - 44’11" | 512 | 527 | 519 | 500 | 448 | 450 | 467 |
| 45 - 54’11" | 180 | 173 | 168 | 157 | 140 | 141 | 136 |
| 55 - 64’11" | 228 | 239 | 251 | 252 | 239 | 228 | 225 |
| 75 - 99’11" | 2 | 3 | 2 | 2 | 2 | 2 | 5 |
| 100 - 124’11" | 3 | 2 | 2 | 2 | 2 | 2 | 2 |
| All Vessels | 2,738 | 2,616 | 2,536 | 2,363 | 2,189 | 2,185 | 2,103 |
Part of the reduction in the number of active crab vessels can be explained by the increase in the number of crab enterprises per active vessel. In recent years the number of enterprises per active vessel has increased as a result of buddy-up arrangements. However, with the introduction of the enterprise combining policy it is envisioned that number of enterprises per active vessel in the 40’ and greater fleets will decline as the instances of buddy-up arrangements diminish. Ongoing buddy-up arrangements in the less than 40’ fleet are anticipated to continue for the foreseeable future.
The increase in the number of enterprises per active vessel is particularly notable in the less than 40’ fleet sector where it increased, from 1.1 in 1998 to almost 1.5 in 2008. With the introduction of temporary measures in 2006, there was an increase in the number of buddy-up arrangements in the less than 65’ fleet. Up until that time there had been an almost 1 to 1 ratio of enterprises to active vessels.
3.5 Fleet Dependence
By Vessel Length Category and Homeport NAFO
Crab is the economic engine of most fleet sectors in Newfoundland and Labrador. In 2004, 65% of the landed value for the less than 65’ fleet was derived from crab. In 2008, the average dependence for this fleet was approximately 48%. The main cause of year over year variability in dependence is the variability in the landed price.
| NAFO Division | <35’ | 35’-44’ | 45-54’ | 55’-64’ | 35’-64’ | <65’ | 65’-99’ | Total <100’ |
|---|---|---|---|---|---|---|---|---|
| 2J | 79% | 97% | 85% | 43% | 55% | 58% | 25% | 55% |
| 3K | 59% | 66% | 52% | 43% | 49% | 51% | 0% | 51% |
| 3L | 75% | 88% | 75% | 62% | 71% | 72% | 25% | 71% |
| 3Ps | 17% | 50% | 46% | 18% | 47% | 32% | 0% | 32% |
| 3Pn4R | 3% | 10% | 2% | 0% | 2% | 2% | 0% | 2% |
| Total | 38% | 68% | 55% | 44% | 52% | 48% | 15% | 48% |
Dependence is not uniform across NAFO division homeports as seen in the table for 2008 above. In the less than 65’ fleet, it was the 3L fleet which had the highest average dependence on Crab at 72% of total landed value.
Not all vessel classes within the less than 65’ fleet derive the same economic benefit from Crab. The 35’-44’11” fleet had the highest average dependency on Crab at 68% of total landed value compared to 38% for the less than 40’ fleet.
There are some fleet segments within divisions that are highly dependent on Crab. These include the 35’-44’ fleet in 2J and 3L with 97% and 88% respectively, of the value of their total catch coming from Crab.
Given the high proportion of value derived from Crab, any downturn in Crab revenues from price or catch/quota reductions will have a significant impact on the economic viability of these enterprises.
By Licence Type and Homeport NAFO
Of all the NAFO divisions, 3L Crab has historically had the highest value relative to overall catch. Approximately 76% (7 year average) of the total value of the 3L catch is derived from Crab. By comparison 4R derives only approximately 9% of its total value from crab
| 2000 | 2001 | 2002 | 2003 | 2004 | 2005 | 2006 | 2007 | 2008 | |
|---|---|---|---|---|---|---|---|---|---|
| Inshore | |||||||||
| 2J | 8.6 | 8.4 | 8.8 | 6.6 | 4.8 | 4.0 | 5.5 | 5.7 | 6.0 |
| 3K | 4.4 | 4.4 | 5.7 | 5.8 | 5.7 | 4.5 | 4.4 | 4.7 | 5.4 |
| 3L | 5.7 | 6.7 | 8.2 | 8.4 | 7.8 | 7.5 | 7.6 | 7.8 | 8.4 |
| 3Ps | 4.8 | 5.0 | 4.7 | 3.9 | 2.5 | 1.8 | 1.9 | 1.8 | 2.2 |
| 3Pn | 1.2 | 0.7 | 1.0 | 0.4 | 0.4 | 0.5 | 0.7 | 0.2 | 0.1 |
| 4R | 1.9 | 2.0 | 2.5 | 2.5 | 2.3 | 1.8 | 1.9 | 0.8 | 0.4 |
| Supplementary | |||||||||
| 2J | 69.2 | 68.5 | 65.6 | 48.1 | 36.2 | 33.0 | 39.7 | 50.3 | 42.9 |
| 3K | 41.9 | 40.3 | 41.7 | 41.6 | 41.9 | 20.9 | 25.6 | 29.5 | 36.2 |
| 3Ps | 45.0 | 44.6 | 44.8 | 38.0 | 33.4 | 24.0 | 23.1 | 28.0 | 33.2 |
| 3L (Small) | 40.8 | 41.9 | 45.0 | 47.4 | 47.7 | 46.8 | 47.8 | 47.0 | 52.4 |
| 3L (Large) | 78.9 | 81.8 | 84.9 | 92.5 | 91.1 | 84.7 | 90.6 | 89.0 | 82.9 |
| Full-Time | |||||||||
| 2J | 113.5 | 110.0 | 108.4 | 77.3 | 55.3 | 47.0 | 60.8 | 66.0 | 65.9 |
| 3K | 99.6 | 98.7 | 100.0 | 99.7 | 97.8 | 41.1 | 61.6 | 73.2 | 101.7 |
| 3L | 126.3 | 128 | 126.4 | 128.4 | 132.4 | 121.1 | 125.1 | 144.9 | 120.4 |
The average landings per licence type can range from less than a tonne for the inshore in 4R and 3Pn to over 120mt for the full-time in 3L
Factors Affecting Fleet Economics
A number of external economic factors have specific consequences for the economics of Crab harvesting.
The recent increased value of the Canadian dollar relative the US dollar has had a negative impact on industry profitability. A significant portion of Crab from Newfoundland and Labrador is sold in the US market. Any appreciation of the Canadian Dollar relative to US currency has negative impacts on the return to Canadian sellers.
Fuel prices spiked during the 2007/08 fishing season. Most of the Crab is harvested by the >40’ fleet which must steam long distances to the crab grounds. Fuel as percentage of overall enterprise cost is quite high for this fleet. (Harvesters are somewhat buffered from fuel prices as they are exempt from or can obtain a rebate for all federal excise taxes, HST and provincial fuel taxes paid at the retail level.)
These factors coupled with a decline in the market price of Crab in the United States have led to a reduction in economic performance of the industry.
Domestically, factors such as resource fluctuations together with overcapacity and other structural issues provide significant challenges to the harvesting and processing sectors.
The Alaskan Snow Crab catch is a major potential source of uncertainty on the supply side of the market. From 2000 to 2007, the Alaskan Snow Crab catch has ranged from about 9,000 – 17,000 tonnes. In 2008 it was 28,600 tonnes. As recently as 1998 it was as high as 110,000 tonnes. The level of Alaskan Snow Crab landings has a significant impact on the market and landed price of Canadian Snow Crab. The possibility of a rebound in the Alaska fishery constitutes a potential risk to the viability of the Newfoundland and Labrador Snow Crab industry.
3.6 Processing
In 2008 there were 35 active processing plants operating in Newfoundland and Labrador, down from 42 in 2003.
| Year | # of Active Plants |
Volume (‘000t) |
Production Value ($M) |
Landed Value ($K) |
|---|---|---|---|---|
| 1999 | 36 | 40.8 | $415.5 | $236.1 |
| 2000 | 36 | 34.8 | $396.8 | $262.6 |
| 2001 | 39 | 35.6 | $394.6 | $218.8 |
| 2002 | 38 | 37.8 | $444.6 | $229.2 |
| 2003 | 42 | 37.4 | $471.6 | $276.6 |
| 2004 | 41 | 37.1 | $472.7 | $300.6 |
| 2005 | 39 | 29.7 | $245.6 | $140.3 |
| 2006 | 39 | 33.1 | $247.8 | $100.7 |
| 2007 | 37 | 34.2 | $336.8 | $171.2 |
| 2008 | 35 | 35.1 | $337.5 | $179.5 |
| Source: DFA, Government of Newfoundland and Labrador and DFO, Newfoundland and Labrador Region | ||||
3.7 Exports
In 2008, Newfoundland & Labrador processors exported Snow Crab valued at $296 million. The United States was the major export market receiving 54% of the exported value. China received most of the balance at 38%. Most of the Crab exported to China is processed and subsequently shipped to Japan.
| Destination | Volume (‘000t) | % of Total Export Volume |
Value ($M) | % of Total Export Value |
|---|---|---|---|---|
| United States | 17.1 | 52.6 | 160.4 | 54.2 |
| China | 12.9 | 39.7 | 112.8 | 38.1 |
| Japan | 0.8 | 2.5 | 7.8 | 2.6 |
| Thailand | 0.4 | 1.2 | 4.3 | 1.5 |
| Vietnam | 0.4 | 1.2 | 3.1 | 1 |
| South Korea | 0.4 | 1.2 | 3.9 | 1.3 |
| Netherlands | 0.2 | 0.6 | 1.7 | 0.6 |
| Other | 0.3 | 0.9 | 0.1 | 0.7 |
| Total | 32.5 | 100 | 294.1 | 100 |
| Source: Statistics Canada | ||||
The Japanese market is more varied than the U.S. in terms of product form and utilization. Crab is supplied live, whole frozen, as frozen sections, and as crabmeat for the sushi market. However, Canadian exports to Japan are predominantly in the form of frozen sections with meat extraction taking place in plants in China or other countries in Southeast Asia.
Approximately 98% of Crab shipped to the US from Atlantic Canada has been in frozen sections form.Footnote 2 Crab is destined for both the retail and food service segments. The latter consists mainly of mid-priced restaurants, and lower priced Asian and seafood buffets. Each of these market segments is highly price-sensitive and will switch to substitute products if relative prices dictate. The lack of stability in demand combined with the variability in supply explains much of the variability in the market price.
Export prices are highly variable from year to year. Two major influences on Snow Crab export prices are the success of the Alaskan Crab fishery and the US/Canadian dollar exchange rate.
The US import price for Crab has been volatile. In Nov 2003 the import price for 5-8oz sections had peaked at $4.79 US/lb. By May 2006 that price had dropped to $2.95 US/lb. Since then, the average price has varied around a mean of approximately $4.00 US/lb. The market price in Canadian dollars for Crab is also highly variable with a high over the period shown at $6.85 CAN/lb. in Jan 2003 and a low at $3.27 CAN/lb. in May 2006.
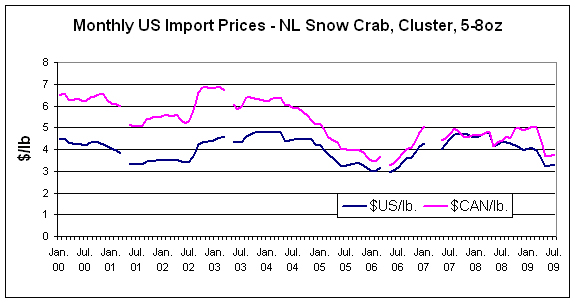
Figure 7: US Import Price – NL Snow Crab, Cluster, 5-8oz (US$/Lb)
4.0 MANAGEMENT ISSUES
4.1 High-Grading
High-grading is the intentional release of legal size Crab in order to retain Crab of a higher quality, larger size and greater value. There is a two-price system for Snow Crab in Newfoundland and Labrador, with a higher price paid for animals with a carapace width of 101 mm or greater. The two-price system includes a 20% tolerance, allowing an enterprise to be compensated with the highest price for the first 20% of undervalued legal size Crab. This tolerance is aimed at reducing the incentive to high-grade.
4.2 Access to the Fishery Outside 200 Miles
Traditional fleets based in 3L have been fishing in this area since 1995. In addition, there have been 4 licenses issued to operators of Newfoundland and Labrador based vessels greater than 65’. The areas fished are a continuation of the traditional fishing grounds of Snow Crab that have been fished for decades. From a genetic perspective, Snow Crab in 2J3KLNO belongs to the same stock. There have been many requests for additional access to the area outside the 200 mile limit. However, given the distance required to steam to access this fishing are, very high catch rates are required and no new access has been granted.
4.3 Industry Renewal
Recognising the many structural factors in the Newfoundland and Labrador fishing industry, the Government of Canada and the Government of Newfoundland and Labrador launched a Fishing Industry Renewal process in May of 2006. This initiative was intended to develop a made-in-Newfoundland and Labrador policy solution to current problems and challenges facing the fishing industry. For the Crab harvesting sector there were two policy announcements which have direct bearing on their operations; the Vessel Replacement Policy and the Enterprise Combining Policy.
Buddy-Up in the Inshore Fleet
“Buddy-up” arrangements permit the use of one vessel to fish two allocations during a season. Buddy-up allows for a reduction in operating costs. Both licence holders are permitted to fish their individual quota using the same vessel. The buddy-up approach has been widely accepted by inshore fleets.
A one year extension of the buddy-up (bridging) system for the greater than 40’ fleets was approved for 2009. Criteria included:
- Buddy-up arrangements must be between the same two partners involved in arrangements approved in 2008;
- An arrangement must last for the entire fishing season;
- The licence holder, who is not the owner of the vessel being used in the arrangement, must be on board during the period that the buddy-up species is being fished.
Buddy-up arrangements with these conditions address the concerns heard from harvesters and create a level playing field with those enterprises that have combined.
Enterprise Combining
The enterprise combining policy gives those on the water, in their boats, greater control of their economic future and greater opportunity to decide for themselves, their place in this industry. The introduction of a new enterprise combining policy represents a significant step forward in how the Newfoundland and Labrador fishery is managed.
Under the new policy, individual Independent Core (IC) licence holders can buy other IC licences (or Core licences) for the purpose of combining enterprises. Initially, a maximum of two enterprises combining into one will be permitted - with the provision that individuals will be permitted to acquire a maximum of two times the Individual Quota level in their fleet. Any combining transaction must result in the removal of one IC (or Core) enterprise, a vessel registration and any duplicate species licences.
Vessel Replacement Policy
The Vessel Replacement Policy eliminated cubic measurement criteria and has only three length barriers: 39’11”, 64’11”, and 89’11”. The revised vessel replacement rules provided Core enterprise owners with the flexibility to acquire vessels based on their allocations and the distance from shore that they fish. It generally allowed Core enterprise owners to acquire larger vessels if required by their fishing business model. Core enterprise owners with a vessel under 34’11” were permitted to replace their vessel with a vessel up to 39’11”. Core licence holders with a vessel between 35’ and 64’11” were permitted to replace their vessel with a vessel up to 65’11”. As well, these license holders who predominately fish for crab, shrimp and/or other species in offshore waters up to 230 miles from shore were permitted to replace their vessel with a vessel up to 89’11”. The 89’11” length barrier applied to the full-time crab fleets in 2J3KL, the 2J3K supplementary crab fleet, the 3L large supplementary crab fleet and the 4R shrimp fleet and 3L small supplementary crab license holders who also hold a shrimp licence.
Acquisition of a larger vessel by Core enterprise owners in the 35’ to 64’11” fleet sector did not result in any changes in allocations, fleet shares or access. Individuals who currently fish in the nearshore area who opt to acquire a vessel up to 64’11”, for example, will not be able to use this vessel as justification for access/allocations in the offshore area in the future.
4.4 Soft-Shell Closures
From 1997 to 2000, various forms of mandatory mid-season soft-shell closures were implemented. Generally, the fishery closed during the August to September period. This period was identified as a time with high probability of occurrence of soft-shelled Crab, although data are limited. When there is a high occurrence of soft-shell Crab there is likely to be a high percentage of dumping at sea, as these animals are not suitable for market purposes. Very few soft-shelled animals that are discarded, survive.
An examination of landing patterns showed that over the years, 90-95% of the Snow Crab harvest in Newfoundland and Labrador occurred before the end of July. It was felt that harvesting the remaining 5-10% in August was considered a lower conservation risk than harvesting this amount in a protracted autumn fishery. In 2001, the Snow Crab season ended on August 31 and there was no re-opening in the fall. The August 31 season end date has continued since 2001. In addition, any area that had a high incidence of soft-shell would be closed as required before the end of August.
Beginning in 2004, soft shell protocols were implemented in divisions 2J and 3K, where the fishing areas was divided into grids (10 minute X 10 minute) and the individual grids were closed when the incidence of soft shell Crab was observed by an at-sea-observer to be 20% or greater. With some modification, this type of system was implemented on all areas for 2006. Areas that close due to high incidence of soft-shelled crab will remain closed for the remainder of the year. In addition, reductions to the fishing season were made in areas where there had been a high incidence of soft shell Crab encountered in early summer.
In 2009, closure of grids in Divisions 2HJ 3K 3Ps and 4R will occur when the incidence of soft shell Crab observed by an at-sea-observer is 20% or greater. In Division 3LNO individual grids will close when the incidence of soft shell Crab observed by an at-sea-observer is 15% or greater.
Soft Shell Protocol Licence Conditions
The Snow Crab fishery is subject to a Soft Shell Crab Protocol as outlined in Schedule 22 which must be attached to the licence conditions. When a grid is closed in accordance with the soft shell protocol, harvesters are required to stop fishing in that grid when notified by one of the following methods:
- broadcasting the notice over a commercial or marine radio station, a radio station operated by the Department of Fisheries and Oceans (“Department”) or a radio station located on a vessel under contract to the Department that broadcasts in the area or vicinity of the area affected by the closure notice; or
- transmitting the notice by electronic means to the licence holder; or
- having a fishery officer or fishery guardian give oral notice thereof.
4.5 Small Crab Escape Mechanisms
In order to ensure conservation of the resource, measures have been implemented to reduced handling mortality of undersized Snow Crab. For the 2009 Snow Crab fishery all harvesters will be permitted, on a voluntary basis, to install in each crab trap (pot) a “small crab escape mechanism”. Harvesters, who choose to use the escape mechanism, should install no more than three of these mechanisms in any one crab pot. These mechanisms are to be installed one mesh above the bottom ring of the trap, in the horizontal orientation. The opening diameter of the mechanism cannot be less than 95 mm. Only professionally fabricated mechanisms provided by or through the Marine Institute of Memorial University of Newfoundland and Labrador are currently permitted.
4.6 Additional Criteria for Inshore Licenses
In addition to the eligibility criteria set by the Department for the issuance of inshore licences, local fish harvesters’ committees can recommend additional criteria.
4.7 Oceans and Habitat Considerations
Closed Areas
Closed areas in the Snow Crab fishery have been established through consultation using a co-management approach with fleet committees in various crab management areas throughout the region.
Division 4R
Located in the Bonne Bay area (Cape St. Gregory to Broom Point) is closed for the 2009 – 2010 Snow Crab season. This is a voluntary closure proposed by local Snow Crab harvesters to allow for further recruitment in the area.
This area of fishing is restricted to that portion of Crab Fishing Area 12 known as ZONE G defined as being inside and shoreward of straight lines drawn connecting the following coordinates:
- 49 degrees 24 minutes 00 seconds N, 58 degrees 14 minutes 00 seconds W (Cape St. Gregory); to
- 49 degrees 25 minutes 00 seconds N, 58 degrees 25 minutes 30 seconds W; to
- 49 degrees 50 minutes 30 seconds N, 58 degrees 04 minutes 30 seconds W; to
- 49 degrees 50 minutes 00 seconds N, 57 degrees 52 minutes 00 seconds W (Broom Point).
Divisions 3LNO
Inshore Fleet
Crab Fishing Area 8A – Inshore Southern Avalon
A special Snow Crab Conservation Exclusion Zone has been established for Crab Fishing Area 8A (Southern Shore). This exclusion zone is a one-half nautical mile wide corridor running along the northern, eastern, southern and western boundaries of Crab Fishing Area 8A.
The Exclusion Zone is further defined as the area contained within straight lines drawn between the coordinates:
- 46 degrees 55 minutes N, 52 degrees 54.5 minutes W (at the shore); to
- 46 degrees 55 minutes N, 52 degrees 19 minutes W; to
- 46 degrees 28 minutes N, 52 degrees 31 minutes W; to
- 46 degrees 12 minutes N, 53 degrees 32 minutes W; to
- 46 degrees 36.6 minutes N, 53 degrees 32 minutes W (Cape Pine); to
- 46 degrees 36.6 minutes N, 53 degrees 31.3 minutes W (at the shore); to
- 46 degrees 12.5 minutes N, 53 degrees 31.3 minutes W; to
- 46 degrees 28.4 minutes N, 52 degrees 31.6 minutes W; to
- 46 degrees 54.5 minutes N, 52 degrees 19.8 minutes W; to
- 46 degrees 54.5 minutes N, 52 degrees 54.4 minutes W (at the shore); and back to
- 46 degrees 55 minutes N, 52 degrees 54.5 minutes W.
Crab Fishing Area 5A - Inner Bonavista Bay
A special Snow Crab Conservation Exclusion Zone has been established for Bonavista Bay Inner. This exclusion zone (hereby known as Exclusion Zone A) is one nautical mile wide stretching across the mouth of the bay from Cape Bonavista to Cape Freels.
Exclusion Zone A is further defined as the area contained within straight lines drawn between the coordinates:
- 48 degrees 42 minutes N, 53 degrees 06.5 minutes W; to
- 49 degrees 15 minutes N, 53 degrees 29.5 minutes W; to
- 49 degrees 15 minutes N, 53 degrees 28 minutes W (Cape Freels); to
- 48 degrees 42 minutes N, 53 degrees 05 minutes W (Cape Bonavista); and back to
- 48 degrees 42 minutes N, 53 degrees 06.5 minutes W.
Crab Fishing Area 5A – Outer Bonavista Bay
Two special Snow Crab Conservation Exclusion Zones have been established for Bonavista Bay. Exclusion Zone A is one nautical mile wide across the mouth of the bay from Cape Bonavista to Cape Freels. Exclusion Zone B is a one-half nautical mile wide corridor running along the northern, eastern and southern boundaries of Outer Bonavista Bay.
Exclusion Zone A is further defined as the area contained within straight lines drawn between the coordinates:
- 48 degrees 42 minutes N, 53 degrees 06.5 minutes W; to
- 49 degrees 15 minutes N, 53 degrees 29.5 minutes W; to
- 49 degrees 15 minutes N, 53 degrees 28 minutes W (Cape Freels); to
- 48 degrees 42 minutes N, 53 degrees 05 minutes W (Cape Bonavista); and back to
- 48 degrees 42 minutes N, 53 degrees 06.5 minutes W.
Exclusion Zone B is further defined as the area contained within straight lines drawn between the coordinates:
- Cape Bonavista at 48 degrees 42 minutes N, 53 degrees 05 minutes W; to
- 48 degrees 42.5 minutes N, 53 degrees 05 minutes W; to
- 48 degrees 42.5 minutes N, 52 degrees 36.75 minutes W; to
- 49 degrees 14.5 minutes N, 52 degrees 51.75 minutes W; to
- 49 degrees 14.5 minutes N, 53 degrees 28 minutes W; to
- 49 degrees 15 minutes N, 53 degrees 28 minutes W (Cape Freels); to
- 49 degrees 15 minutes N, 52 degrees 51 minutes W; to
- 48 degrees 42 minutes N, 52 degrees 36 minutes W; and back to Cape Bonavista.
Crab Fishing Area 6A – Inner Trinity Bay
Two special Conservation Exclusion Zones have been established for Trinity Bay. Zone A stretches one nautical mile wide across the mouth of the bay from North Head to the northern part of Baccalieu Island. This Exclusion Zone is defined as the area contained within straight lines drawn between the coordinates:
- 48 degrees 10 minutes N, 52 degrees 48.708 minutes W; to
- 48 degrees 21 minutes N, 52 degrees 54.523 minutes W; to
- 48 degrees 32.964 minutes N, 53 degrees 00.872 minutes W; to
- 48 degrees 32.964 minutes N, 52 degrees 59.369 minutes W; to
- 48 degrees 21 minutes N, 52 degrees 53.025 minutes W; to
- 48 degrees 10 minutes N, 52 degrees 47.209 minutes W; and back to
- 48 degrees 10 minutes N, 52 degrees 48.708 minutes W.
Zone B stretches one-half nautical mile wide across the northern boundary of Trinity Bay outer. This Exclusion Zone us further defined as the area contained within straight lines drawn between the coordinates:
- 48 degrees 42.02 minutes N, 53 degrees 05.09 minutes W; to
- 48 degrees 42 minutes N, 52 degrees 36 minutes W; to
- 48 degrees 41.5 minutes N 52 degrees 35.75 minutes W; to
- 48 degrees 41.52 minutes N, 53 degrees 05.09 minutes W; and back to
- 48 degrees 42.02 minutes N, 53 degrees 05.09 minutes W.
Crab Fishing Area 6A – Outer Trinity Bay
Two special Conservation Exclusion Zones have been established for Trinity Bay. Zone A stretches one nautical mile wide across the mouth of the bay from North Head to the northern part of Baccalieu Island. This Exclusion Zone is defined as the area contained within straight lines drawn between the coordinates:
- 48 degrees 10 minutes N, 52 degrees 48.708 minutes W; to
- 48 degrees 21 minutes N, 52 degrees 54.523 minutes W; to
- 48 degrees 32.964 minutes N, 53 degrees 00.872 minutes W; to
- 48 degrees 32.964 minutes N, 52 degrees 59.369 minutes W; to
- 48 degrees 21 minutes N, 52 degrees 53.025 minutes W; to
- 48 degrees 10 minutes N, 52 degrees 47.209 minutes W; and back to
- 48 degrees 10 minutes N, 52 degrees 48.708 minutes W.
Zone B stretches one-half nautical mile wide across the northern boundary of Trinity Bay outer. This Exclusion Zone is further defined as the area contained within straight lines drawn between the coordinates:
- 48 degrees 42.02 minutes N, 53 degrees 05.09 minutes W; to
- 48 degrees 42 minutes N, 52 degrees 36 minutes W; to
- 48 degrees 41.5 minutes N 52 degrees 35.75 minutes W; to
- 48 degrees 41.52 minutes N, 53 degrees 05.09 minutes W; and back to
- 48 degrees 42.02 minutes N, 53 degrees 05.09 minutes W.
Crab Fishing Area 6B– Outer Conception Bay
A special Snow Crab Conservation Exclusion Zone has been established for Crab Fishing Area 6B Outer (Conception Bay Outer). This exclusion zone is one-half nautical mile wide running along the eastern boundary of Conception Bay Outer.
The Exclusion Zone is further defined as the area bounded by a line drawn from:
- 48 degrees 10 minutes N, 52 degrees 22 minutes W to
- 47 degrees 48.3 minutes N, 52 degrees 12.3 minutes W to
- 47 degrees 48.3 minutes N, 52 degrees 13.1 minutes W to
- 48 degrees 10 minutes N, 52 degrees 22.8 minutes W and back to
- 48 degrees 10 minutes N, 52 degrees 22 minutes W.
Crab Fishing Area 6C– Eastern Avalon
A special Snow Crab Conservation Exclusion Zone has been established for Crab Fishing Area 6C (Eastern Avalon). This exclusion zone is a one-half nautical mile wide corridor running along the northern, eastern and southern boundaries of Crab Fishing Area 6C.
The Exclusion Zone is further defined as the area contained within straight lines drawn between the coordinates:
- Cape St. Francis at 47 degrees 48.3 minutes N, 52 degrees 47.46 minutes W to
- 47 degrees 48.3 minutes N, 52 degrees 12.3 minutes W to
- 47 degrees 26 minutes N, 52 degrees 03 minutes W to
- 46 degrees 55 minutes N, 52 degrees 19 minutes W to
- 46 degrees 55 minutes N, 52 degrees 54.54 minutes W (at the shoreline) to
- 46 degrees 55.5 minutes N, 52 degrees 54.54 minutes W (at the shoreline) to
- 46 degrees 55.5 minutes N, 52 degrees 19.7 minutes W to
- 47 degrees 26 minutes N, 52 degrees 03.7 minutes W to
- 47 degrees 47.8 minutes N, 52 degrees 13 minutes W to
- 47 degrees 47.8 minutes N, 52 degrees 47.46 minutes W (at the shoreline) to
- Cape St. Francis
Small Supplementary Fleet
Crab Fishing Area - Near Shore, Mid Shore, 8BX
Two special Snow Crab Conservation Exclusion Zones have been established for the Small Supplementary fleet sector, one in the Near Shore quota area and the other in 8BX. The Near Shore Conservation Exclusion Zone is one-half nautical miles wide stretching along the north-west boundary of the Near Shore Area and is further defined as the area bounded by a line drawn from points;
- 47 degrees 26 minutes N, 52 degrees 03 minutes W; to
- 49 degrees 15 minutes N, 52 degrees 51 minutes W; to
- 49 degrees 15 minutes N, 52 degrees 50.25 minutes W; to
- 47 degrees 26 minutes N, 52 degrees 02.25 minutes W; and back to
- 47 degrees 26 minutes N, 52 degrees 03 minutes W.
The 8BX quota area conservation exclusion zone is a one-half mile corridor stretching along the eastern and southern perimeter of 8BX and is further defined as the area bounded by lines connecting the following points:
- 46 degrees 55 minutes N, 48 degrees 47 minutes W and following an outer boundary running 30 miles inside the 200 mile limit to
- 43 degrees 50.8 minutes N, 54 degrees 30 minutes W; to
- 43 degrees 51.3 minutes N, 54 degrees 30 minutes W and following an outer boundary running 30.5 nautical miles inside the 200 mile limit to
- 46 degrees 55 minutes N, 48 degrees 47.75 minutes W; and back to
- 46 degrees 55 minutes N, 48 degrees 47 minutes W.
4.8 Gear Impacts
In order to get a better understanding of potential lost gear impacts in the Snow Crab fishery, mandatory reporting of lost gear has been introduced for the 2009 fishing season. Any harvester fishing for Crab in the NL Region is required to report all lost crab traps / pots to the nearest DFO Conservation and Protection Detachment office within 48 hours of landing from the fishing trip that the harvester became aware of the loss.
5.0 OBJECTIVES
5.1 Long Term Objectives for The Fishery
The long-term objectives of the Snow Crab fishery in Newfoundland and Labrador are:
- To conserve the Snow Crab resource to provide commercial sustainability to fish harvesters.
- To promote a fishery that operates in an efficient and orderly manner for both harvesters and processors.
- To ensure that reliable and adequate information is collected for management and science.
- To provide equitable and fair access to those who harvest the Snow Crab resource.
5.2 Management Plan Objectives
To achieve conservation and commercial sustainability it is necessary to:
- Maintain the reproductive capacity of the resource.
- Prohibit the retention of female Crabs, and male Crabs less than 95mm in width.
- Minimize other sources of fishery induced mortality by:
- Minimizing fishing activity during times of peak soft-shell to avoid discard mortality;
- Promoting proper handling practices and minimizing the by-catch of crab in other fisheries; and
- Introducing disincentives to high-grading as well as appropriate monitoring and enforcement measures.
- Maintain stable or increasing quotas.
- Prosecute the fishery at appropriate levels of exploitation to increase the probability that economical catch rates will be maintained.
- Recognize uncontrollable ecosystem impacts.
- Recognize and consider effects like predation, oceanographic conditions and disease even though these are currently unknown and uncontrollable.
To ensure that the fishery operates in an efficient and orderly manner we must:
- Clearly define roles and responsibilities for both the fishing industry and DFO.
- Implement supportive management measures. The use of DFO legislative instruments and the timely announcement of management plans are used to support industry.
There are several reporting tools that provide DFO managers and scientists with appropriate information and basic data required to manage the Snow Crab fishery:
- A reliable dockside monitoring program.
- An adequate level of at-sea observer coverage, both spatial and temporal.
- The accurate completion of logbooks.
Fishery managers must also implement measures that discourage illegal practices. The two main measures that create problems in the data collection process are the large number of management areas as well as the restriction on the number of Crab pots permitted.
To provide equitable and fair access to Snow Crab resources there must be respect for:
- Economic viability and dependence.
- Historical attachment to the Snow Crab fishery.
- Adjacency to the resource.
- Transparent sharing principles.
5.3 Socio-Economic Objectives
The Socio-Economic Objectives of the management of the Snow Crab fishery are:
- To facilitate an orderly and productive fishery through maximizing benefits within the industry, adjacent communities and the Province.
- To provide the fishermen with increased opportunity to develop long-term business plans.
- To promote the development and use of good fishing practices.
The measurable activities supporting these objectives:
- Stabilization of the access and allocation process.
- No additional access or effort will be provided in this fishery under the current agreement as set out in this IFMP.
- Improved management of fishery through co-management.
- Inclusive and open consultations in the development of the IFMP.
- Management decisions are made through the annual harvest planning process.
- First Nations access and allocation formulas are maintained in the IFMP and opportunities for additional access are addressed through the Fisheries Access Program.
- Development of multi-year fisheries management plan (3-5 years).
- Use of top entry traps.
- Research on designing improved traps.
5.4 Aboriginal Objectives
The Aboriginal Fisheries Strategy Program (AFS) is designed to encourage Aboriginal involvement in commercial fisheries and related economic opportunities. The Allocation Transfer Program (ATP) component of AFS has been the primary instrument used to voluntarily retire licences from the commercial fishery and subsequently transfer to Aboriginal groups on a communal basis. Any fishing licences, including those with crab components, acquired by Aboriginal groups and organizations through the AFS program are subject to the same licence conditions as those applied to non-Aboriginal commercial licences.
The Nunatsiavut Government (NG) holds a Communal Snow Crab licence and allocation north of 54 degrees 40 minutes N in NAFO Divisions 2GHJ. The NG is the sole licence holder in this area.
6.0 ACCESS AND ALLOCATION
The Total Allowable Catch (TAC) for Snow Crab is set annually. Following this decision, allocations are established for each Crab management area and the fleet sectors that have access to this stock. These allocations are determined based on annual consultations with industry and sharing arrangements that have been in place for a number of years. No new access is provided under the current management plan.
* The Minister can, for reasons of conservation or for any other valid reasons, modify access, allocations and sharing arrangements pursuant to the Fisheries Act.
6.1 Sharing Arrangements
Sharing Principles
As there are no longer temporary seasonal crab permits, the reference in previous plans to the issuance of permits while the Divisional quotas remain at or above 1998 levels is no longer applicable. While the quota allocated to the inshore sector is dependent on the overall resource in each NAFO Division, inshore licenses are valid for inshore Crab Fishing Areas only and their issuance is not contingent on the overall NAFO Division quota. The issuance of the inshore licences was contingent on a self-rationalization plan should quota levels decline.
Inshore fleets
Most Snow Crab allocations in inshore areas are to inshore fleets. All future quota increases in the inshore areas will be allocated to the inshore fleets.
Access for inshore fleets will be limited to inshore areas.
The vessel replacement barrier at 39’11” LOA is permanent.
Small Supplementary fleets
While individuals in these fleets were provided the option to remain in inshore areas, most have now opted to move to nearshore and offshore areas.
For the most part, those who remain in inshore areas are capped at 1998 IQ levels. Supplementary licence holders still fishing in the inshore areas are permitted to move further from shore out of the inshore areas, and will be assigned the IQ of the lowest supplementary group in that NAFO Division.
Offshore Large Supplementary fleets and Full-time fleets
Quota increases in offshore areas (e.g., outside inshore areas) will be allocated to the fleets that currently have access to those areas on a pro-rata basis.
6.2 Principles for Declining Quotas
Principles to guide allocation decisions in the event of quota declines are provided for two areas: outside 200 miles from land in Divisions 3LNO and inside 200 miles in all other areas. This separation was necessary because in the area outside 200 miles there were relatively new exploratory licenses and substantial replacement / compensatory quotas for 3L full-time and supplementary fleets.
Principles for most areas: In the event of quota declines, these reductions will be shared pro-rata by fleets who share the allocations in the area where these declines occur.
Principles for outside 200 miles - 3LNO: A threshold level for the area outside 200 miles is established and will include the 1999 allocations for the full-time (1,450mt) and supplementary fleets (3,000mt), and the 1998 allocations to exploratory license holders (800mt) for a total of 5,250mt. In the event of quota declines in this area all reductions will occur for the exploratory license holders in the reverse order that allocations were made until the overall 3LNO quota outside 200 miles is reduced to 5,250mt. Quota reductions lower than this base level will be allocated on a pro-rata basis to all fleets fishing in this area.
6.3 Quotas and Allocations
Crab Fishing Areas / Zones
At one point there were over 40 different Crab Fishing Areas used to regulate the Snow Crab fishery in Newfoundland and Labrador. Increasing the number of CFAs was used as a mechanism to explore areas that had not been fished in the past. There is no scientific reason to have a large number of CFAs as scientific advice is generally provided on a NAFO Division basis.
The use of separate CFAs is a sound management tool to spread fishing effort over a wide area. This broad distribution of fishing effort reduces the probability of over-exploitation of localized areas. However, there are concerns of misreporting of catches from some areas, creating flawed data for assessment purposes. The use of smaller fishing areas is also a useful allocation tool, especially in inshore areas, as it facilitates quota distribution for license holders.
| NAFO Division | Inshore Crab Fishing Areas | Offshore Crab Fishing Areas |
|---|---|---|
| 2J | Not Defined | Outside 20 nm |
| 3K | 3A, 3B, 3C, 3D, 3BC | 4 |
| 3L | 5A, 6A, 6B, 6C, 8A, 9A | NS, MS, 8B, 8Bx, MS/EX, 170-200, outside 200 miles |
| 3Ps | 10A, 11 (north of 47° lat.), 11E, 11W, 11S, 11SX | 10BCD, 10X, 11S |
| 3Pn, 4R | 12A, 12B, 12C, 12D, 12E, 12F, 12G, 12H | South of Table Point - 3Pn, Bay of Islands, Bay St. George |
In previous management plans there has been a move to combine some offshore CFAs. For example in 2002 all offshore areas in 3K were combined to form one CFA. An examination of the fishing patterns in 2002 indicated that there was a good distribution of effort and as a result the single area continued in 2003. This combining of offshore CFAs gives fishers flexibility to harvest their quotas over a wider geographic area and reduces the workload of DFO enforcement.
While it is necessary to maintain some CFAs that relate to distance from land, it may not be necessary to maintain all current boundaries.
7.0 MANAGEMENT MEASURES
A Departmental priority for all management plans is to provide timely announcements to allow the fishing industry to prepare for the upcoming fishing season. A key to such timeliness is the implementation of multi-year management plans. For species that are conducive to multi-year planning, this is the approach adopted by DFO.
The current Integrated Fisheries Management Plan for Snow Crab will be in place for three years, 2009 to 2011 inclusive. While management plan measures and principles will be in place for three years, quotas will be subject to annual review and possible adjustment based on updated science. As is the case with all multi-year management plans, any new scientific evidence that warrants a change to total allowable catches will be acted upon at any time during the three-year period.
7.1 Integrated Fisheries Management Plan - Effective 2009
2009 is the first year of a new evergreen Integrated Fisheries Management Plan (IFMP), for Snow Crab in the Newfoundland and Labrador Region.
The management approach supports sustainability of the Snow Crab resource, and recognizes improvements in the resource due to recent management measures developed between Fisheries and Oceans Canada scientists, fisheries managers and crab harvesters. This approach includes the continuation of early and shortened fishing seasons, mandatory sorting of undersized crab on deck, improved soft-shell protocols with effective monitoring, at-sea observer coverage, quota increases in some areas that showed continued improvements in 2008 and quota decreases in areas where the resource is declining.
Some fleets will be ready to fish immediately. An early opening in these areas is essential to providing the best opportunity to avoid high incidence of soft shell during the fishery and to spread the landings over a longer period of time, consistent with market considerations and the Ocean–to-Plate direction. In addition, grid based soft-shell protocols are continued in all areas and will be improved in the offshore areas of 3LNO. Areas closed as a result of soft-shell crab will remain closed for the remainder of the year.
7.2 Total Allowable Catch
There is little change in the overall quota levels for 2009. However, there are substantial quota reductions in the offshore areas of Division 3LNO. These reductions apply inside and outside 200 miles. The total cumulative reduction for the offshore areas in Division 3L is 18%. There are increases in quotas in Divisions 3K (9%) and 3Ps (21%). There is a quota reduction in 4R3Pn (25%). No change in Divisions 2HJ.
| Area | 2009 Quota (mt) |
|---|---|
| 2J | 2,466 |
| 3K | 16,475 |
| 3LNO | 28,979 |
| 3Ps | 5,280 |
| 4R3Pn | 970 |
| Total Quota | 54,145 |
7.3 2009 Quotas Inside 200 Miles
The quotas for 2009 in areas inside 200 miles are as follows:
| Description | Inshore | Supplementary | Fulltime | Total |
|---|---|---|---|---|
| 2H Communal South of 55o 50’ | 100 | |||
| 2J Communal North of 54o 40’ | 362 | |||
| 2J Offshore | 1,330 | 315 | ||
| 2J Inshore | 359 | 359 | ||
| Total – 2009 | 359 | 1,330 | 315 | 2,466 |
| Area | Description | Inshore | Supplementary | Fulltime | Total |
|---|---|---|---|---|---|
| 3A | Canada Bay | 425 | 425 | ||
| 3B | White Bay | 500 | 500 | ||
| 3C | Green Bay | 740 | 740 | ||
| 3D | Fogo/Twillingate | 1,730 | 1,730 | ||
| 3BC | Inshore 3K | 300 | 300 | ||
| 4 | Nearshore 3K | 50 | 50 | ||
| 4 | Offshore 3K | 9,760 | 2,970 | 12,730 | |
| Total – 2009 | 3,745 | 16,475 | |||
| Area | Description | Inshore | Supplementary | Fulltime | Total | |
|---|---|---|---|---|---|---|
| Small | Large | |||||
| 5A | Bonavista Bay | 1,637 | 1,637 | |||
| 6A | Trinity Bay | 1,029 | 1,029 | |||
| 6B | Conception Bay | 1,282 | 1,282 | |||
| 6C | Eastern Avalon (inside 25) | 1,576 | 1,576 | |||
| 8A | Southern Shore (inside 25) | 1,060 | 1,060 | |||
| 9A | St. Mary’s Bay | 626 | 626 | |||
| NS | Near Shore | 5,500 | 5,500 | |||
| MS | Mid Shore | 2,580 | 602 | 668 | 3,850 | |
| 8B | Southern Avalon (offshore) | 680 | 680 | |||
| 8Bx | Southern Avalon | 2,720 | 2,720 | |||
| MS/EX | Mid-shore extended | 1,427 | 1,386 | 2,813 | ||
| 170-200 | Between 170 and 200 miles | 1,426 | 999 | 2,425 | ||
| Total – 2009 | 7,210 | 11,480 | 3,455 | 3,053 | 25,198 | |
| Fleet | Total |
|---|---|
| 3L Fulltime | 1,044 |
| 3L Supplementary (>40 grt) | 1,044 |
| Fixed gear vessels >65’ | 1,044 |
| TOTAL 2009 | 3,781 |
| AREA | Description | Inshore | Supplementary | Total |
|---|---|---|---|---|
| 10A | Placentia Bay north of 46o30’N | 1,500 | 1,500 | |
| 10BCD | CFA 10 from 46o30’N to 45o35’N | 2,900 | 2,900 | |
| 10X | CFA 10 south of 45o35’N | 520 | ||
| 11S | CFA 11 south of 46o30’N (>40’ fleet) | 50 | 210 | |
| 11SX | 100 | 100 | ||
| Total – 2009 | 1,650 | 3,630 | 5,280 | |
| Description | Inshore | Commercial | Total |
|---|---|---|---|
| South of Table Pt, 3Pn (outside 8) Group 1 | 38 | 38 | |
| South of Table Pt, 3Pn (outside 8) Group 2 | 307 | 307 | |
| South of Table Pt, 3Pn (outside 8) Group 3 | 73 | 73 | |
| Bay of Islands | 64 | 64 | |
| Bay St. George | 15 | 15 | |
| Lapoile Bay | 8 | 8 | |
| Cape Ray to Johnson’s Cove | 18 | 18 | |
| Johnson’s Cove to Cp St. George | 143 | 143 | |
| Cape St. George to Bear Head | 76 | 76 | |
| Bear Head to Cape St. Gregory | 56 | 56 | |
| Inner Bay of Islands | 54 | 54 | |
| Cape St. Gregory to Broom Point | 0 | Voluntary 2-Year Moratoria |
|
| Broom Point to Table Point | 56 | 56 | |
| Total – 2009 | 412 | 498 | 910 |
7.4 Individual Quotas
Throughout the 1970s, 1980s and into the 1990s all Snow Crab fisheries in the Newfoundland and Labrador Region were conducted on a competitive basis. Individual quotas were implemented for the first time in 1995. During that year the full-time fleet in 3K participated in a pilot IQ program. In addition, all enterprises that were issued temporary seasonal permits during 1995 fished with an individual or boat quota. The use of IQs expanded after 1995 and currently all fleets are fishing under this management regime.
The basic criterion for movement from a competitive fishery to an individual quota regime was at least two-thirds agreement of the license holders in each fleet. Fleet representatives determined the specific quota sharing arrangements.
7.5 Fishing Seasons
A general agreement has been reached on opening dates between the harvesting and processing sectors. All parties have requested a single opening date for all fleets with that date being as close to April 1 as possible. In 2009 the season opened on April 1.
Because of the high occurrence of soft shell in some areas, shorter fishing seasons was a key component of the overall management measures for 2009. The season end date is variable among the different fishing areas as illustrated in the table below.
| NAFO Division | 2009 Season Dates | |
|---|---|---|
| 2J | 2J South 2J North |
May 1 – July 15 June 15 – Aug 30 |
| 3K | 3A, 3B, 3C, 3BC 3D 4 |
April 1- July 7 April 1- June 15 April 1- June 15 |
| 3LNO | 5A,6B, 6C, 8A, 7A 6A 8B MS, MS EX, 3L EX, 3N 200 3L 200 |
April 1- July 31 April 01- June 30 April 1- June 30 April 1- July 15 April 1 – June 30 |
| 3Ps | 10 BCD, 10x, 11S, 11Sx 10A |
April 1 – May 31 April 1 – June 20 |
| 4R3Pn | April 1 – June 30 | |
7.6 Trip / Week Landing Limits & Landing Weeks
A measure that helps maintain orderly harvesting and processing throughout the Snow Crab season are trip and week landing limits.
At the request of industry, trip and weekly limits are included in Snow Crab licence conditions.
| Fleet | Landing Limit | Effective |
|---|---|---|
| 2J Fulltime and Supplementary | 45,000 lbs per trip 25,000 lbs per trip |
May June 1 to end of season |
| 3K Fulltime and Supplementary 3K Supplementary 3K Fulltime 3K Buddy-Up & Combined |
45,000 lbs per trip 27,000 lbs per trip 40,000 lbs per trip 44,000 lbs per trip |
April 1 to May 12 May 12 to end of season May 12 to end of season May 12 to end of season |
| 3L Fulltime & Large Supplementary |
45,000 lbs per trip 40,500 lbs per trip |
April May 1 to end of season |
| 3L Small Supplementary | 25,000 lbs per trip 26,000 lbs per week[2] |
April May |
| 3L Buddy-Up and Combined | 26,000 lbs per trip or 50,000 lbs per week | May |
| 3L Midshore | 30,6000 per week | May |
| All Vessels | 25,000 lbs per trip | June 1 to end of season |
| 3Ps | 25,000 lbs per trip | All Season |
| RSW OPTION | 60,000 lbs per week[1] 35,000 lbs per trip or 50,000 lbs per week 60,000 lbs per week[2] |
April May June 1 to end of season |
| 1 A week begins at 00:01 hours on Monday and ends at 24:00 (midnight) hours on Sunday 2 25,000lbs per trip and 50,000 per week for Buddy-up and Combined enterprises |
||
7.7 Trap Limits
Snow Crab trap limits for each fleet or area for 2009 are based on three categories: Single, Buddy-up and Combined Enterprises.
| NAFO | Fleet | Single | Buddy Up | Combined |
|---|---|---|---|---|
| 2HJ | Inshore | 200 | N/A | N/A |
| Supplementary | 800 | 800 | 800 | |
| Fulltime | 800 | 800 | 800 | |
| 3K | 3A | 150 | 300 | 300 |
| 3B,C, D & BC | 100 | 100 | 100 | |
| >10GRT | 200 | 200 | 200 | |
| Supplementary | 800 | 800 | 800 | |
| Fulltime | 800 | 800 | 800 | |
| 3LNO | Inshore | 150 | 200 | 200 |
| Small Supplementary | 400 | 600 | 600 | |
| Large Supplementary | 1200 | 1200 | 1200 | |
| Fulltime | 1200 | 1200 | 1200 | |
| 3Ps | 10A | 150 | 150 | 150 |
| 11E | 100 | N/A | N/A | |
| 11W | 100 | N/A | N/A | |
| 11SX | 300 | N/A | 300 | |
| 11S* | 300 | N/A | N/A | |
| Supplementary | 300 | 450 | 450 | |
| 4R | Zones A-H | 100 | 200 | N/A |
| Outside 8 | 250 | 500 | N/A | |
| *11S only available with 11SX or supplementary licences and thus when combined will have either 300 or 450 trap limit. | ||||
Individual fleets can request modifications to the trap limits in specific areas.
7.8 Control and Monitoring of Removals
The Fisheries Management Controls are the specific actions that are taken to ensure the execution of the Fisheries Management Strategies. The development of the Fisheries Management Controls involves identifying, analyzing and controlling hazards related to the implementation of the fisheries management strategy.
Fisheries Management Controls
- Quota monitoring
- IQ monitoring through the Dockside Monitoring Program (DMP)
- Industry self-reporting
- Licence re-issuance monitored by DFO.
- Fishing monitored by at-sea observer coverage.
- Random gear inspections: dockside and at-sea by Conservation and Protection (C&P) Division.
- Random inspection of catch at sea and at dockside by C&P.
- Adherence to soft-shell protocol monitored by at-sea Observers.
- Reporting to fleets on the % of soft-shell crab catch in the various sub-areas.
- Exploitation level within the range of the exploitable biomass index.
- Comparison of catch composition from observed to non-observed fishing vessels.
- Established fishing season.
Control and Monitoring Activities
- Dockside inspections will be performed by Fishery Officers, on a random basis to verify that the fishing gear and traps comply with the regulatory requirements.
- Industry self reporting through logbook data and dockside monitoring.
- Surveillance at sea activities will be performed by Fishery Officers on board DFO designated patrol vessels to monitor the fishing fleet and its activities to verify fishing boundaries are respected, no illegal gear is being fished, no fishing is occurring during closures and to ensure no poaching by unlicensed vessels occurs.
- At sea boardings will occur where Fishery Officers suspect illegal fishing practices are taking place.
- Air surveillance will be performed by DFO to deter poaching, verify fishing closures and to ensure boundaries are respected. Industry may request and contribute financially to additional air and sea patrols.
- Observers at sea will be deployed on the crab fleet throughout the fishing season to verify the amount of soft shell crab catch and verify that under sized crab and females are returned to the water.
- 100% Dockside Monitoring will be performed by an independent third party, DFO approved, monitoring company. Monitors will verify landings and make information available to DFO for ensuring the TAC is not overrun and that under sized crab, soft-shell crab or female crab are not landed nor processed.
- C&P will monitor and audit Dockside Monitors to ensure information collected is accurate and consistent with DFO specifications.
- Industry communication strategy will be put in place to keep DFO and fishers informed of the incidence of soft-shell catches and to report any violations or operational hazard.
- Science sampling will take place at dockside during landings to capture population data on the crab stock. Incidences of under size and female crab will be reported to C&P.
7.9 Amendments to Management Plan
Some aspects of the Snow Crab management plan are designed to address DFO’s key mandate of conservation. Other management plan measures (i.e., trip/week harvest limits, landing weeks) are included to ensure orderly harvesting and processing of crab throughout the fishing season. To a large degree the orderly harvesting/processing measures are the responsibility of industry and are developed based on the consensus of industry participants.
Changes to these measures will only be considered if there is written agreement to make these changes from both sectors of the industry (harvesters and processors).
7.10 Other Management Measures
Transport of Crab
Under existing regulations transport licenses are required to transport crab by vessels other than fishing vessels. Transport licenses will only be issued for transporting crab that has been landed on shore. Transhipment from fishing vessels will not be permitted.
Logbooks
Logbooks are one of the monitoring tools used in the fishery. All licence holders are required to complete and return logbooks to DFO under authority of Section 61 of the Fisheries Act. Logbooks must be completed accurately in accordance with instructions provided. Logbook data is vital to monitoring catch and the science assessment process. The completion and return of logbooks is managed as a condition of licence.
Dockside Monitoring
Since 1995 all license holders have been required to have all Snow Crab landings dockside monitored. This requirement will continue for 2009-2011 with all costs being the responsibility of individual fishers or fishing fleets. It is also the responsibility of license holders to ensure that monitors who oversee the offloading of catches are certified by the Fisheries and Oceans Canada.
Observers
The fishing industry will be responsible for the payment of fees to cover at-sea observer coverage. Harvesters will contribute 2/3 a cent per pound for the amount of their respective individual quota. Fishers will be required to carry at-sea observers at the request of DFO. Licence conditions are not valid unless a letter of arrangement from the observer company is attached confirming payment of observer fees. All fleets will contribute to the overall observer coverage for the Snow Crab fishery.
Vessel Monitoring System
The vessel monitoring system (VMS) is used as tool in managing this fishery. Vessels 40’ and greater directing for Snow Crab are required to have an automatic location and communication (ALC) device that will transmit the vessel’s position to DFO. This is managed by way of a condition of licence. Fishers are responsible for covering the cost of the ALC device, its installation on-board their vessel, and the cost of operation.
Species at Risk Act
Under the Species at Risk Act (SARA) species may be identified as “at risk”. The purposes of the Act are: “…to prevent wildlife species from being extirpated or becoming extinct, to provide for the recovery of wildlife species that are extirpated, endangered or threatened as a result of human activity and to manage species of special concern to prevent them from becoming endangered or threatened.” Two issues related to species at risk are the incidental capture of Wolffish and the entanglement of the Leatherback Turtle in fishing gear, specifically, Snow Crab traps. Their status as species at risk in Canada results in legal protection and mandatory recovery requirements. Protection under the Act prohibits killing, harming and harassing of individuals and also prohibits damaging or destroying their residence, i.e., protection of critical habitat.
Three species of Wolffish are commonly found in crab pots and they are captured over most of the extent of the Crab grounds. Wolffish are attracted by the bait and enter the traps. (They are not after the Crab). Two species, the northern wolffish (Anarhichas denticulatus) and the spotted wolffish (Anarhichas minor), are listed as “threatened” under SARA and therefore protected by the Act. Both species have undergone a decline in population size of more than 90% since the late 1970’s. For these two species, current management measures, as conditions of license for the fishery, require that they be returned to the water at the site where they are captured. Release should be done as quickly as possible without harm to the Wolffish in order to maximize the animal’s survival. A third species, the Striped Wolffish (Anarhichas lupus), is listed as “special concern” and also must be returned safely to the water.
To address the condition of these stocks, DFO, in conjunction with industry, fish harvesters and other governmental departments, has developed a Wolffish Recovery Strategy that will identify actions to protect and recover these species.
The Leatherback Turtle is undergoing a severe global decline (more than a 70% decline in population in 15 years). In Canadian waters, incidental capture in fishing gear is a major cause of mortality. Leatherback Turtles seem to be the most vulnerable to entanglement in fishing gear such as lines associated with fixed trap gear and gillnet, buoys, anchors and other ropes and cables. The Leatherback Turtle is currently listed as Endangered in Canada and as Critically Endangered on a global status.
Leatherback Turtles are caught accidentally, especially in fisheries located in foraging areas and in migratory corridors. They are especially vulnerable to entanglement in fishing gear because their massive front flippers hook up in lines and are vulnerable not only to gear in use (especially un-monitored gear), but also to abandoned gear. They may also be attracted to gelatinous organisms and algae that collect on buoys and buoy lines at or near the surface. Entangled turtles will drown if unable to free themselves, but may also lose limbs or become more vulnerable to predation. Trailing gear may still encumber turtles that break free.
Leatherback Turtle entanglements have been recorded historically and presently occur in crab pot gear. The timing of the Crab fishery overlaps with the seasonal occurrence of leatherbacks in local waters. However, the current interaction rate of sea turtles with the Crab fishery in Newfoundland and Labrador waters is believed to be low. Rates could be lowered further with the increased use of weighted lines, which decrease the probability of entanglement by reducing the amount of slack rope present at the surface.
Bitter Crab Disease
Bitter Crab Disease (BCD) is caused by a microscopic blood parasite, and will usually kill newly moulted crab within a year. Although it is harmless to humans, it causes the meat to taste bitter. Bitter crab can contribute to a decline the stock, and impairs market quality. Bitter crab has a cooked appearance; crab legs are opaque white and in early stages may show white streaks on the translucent underside. The usually red-brown back may have a pink or orange tint.
In order to prevent the spread of the disease:
- BCD affected crab should not be thrown back into the ocean but retained until dockside,
- BCD affected crab should be separated from the catch and placed in a leak proof container.
- BCD affected crab should be disposed of in a landfill site.
7.11 Licensing
The snow crab fishery is a limited entry fishery. There are no new licences available. The Minister of Fisheries and Oceans has absolute discretion under the Fisheries Act for the issuance of fishing licences. Licences may be reissued to a qualified new entrant, upon request of the current licence holder. As well, in 2008 Fisheries and Oceans Canada implemented enterprise combining; a voluntary fleet self-rationalization policy which allows most fish harvesters to acquire IQ from an exiting enterprise.
With the introduction of enterprise combining the total number of licences are now described as licence shares since the number of licences issued will decrease over time, but the number of licence shares will remain constant.
In 2009, there were 3,455 Snow Crab licence shares based in Newfoundland and Labrador Region managed areas. This included 2,683 inshore, 697 supplementary, 71 fulltime and 4 greater than 65’ vessels.
| Area | Inshore | Supplementary | Fulltime | 65’ and Greater | Total | |
|---|---|---|---|---|---|---|
| Less than 40 GRT |
40 GRT and Greater |
|||||
| 2J | 66 | 31 | 4 | - | 101 | |
| 3K | 656 | 240 | 29 | - | 922 | |
| 3L | 836 | 247 | 79 | 38 | 4 | 1,207 |
| 3Ps | 713 | 100 | - | - | 813 | |
| 4R 3Pn | 412 | - | - | - | 412 | |
| Total | 2,683 | 697 | 71 | 4 | 3,455 | |
Enterprise Combining
Fulltime and Supplementary Fleets
The 2J3KL fulltime, 2J3K supplementary and 3L large supplementary crab fleets may acquire up to the maximum individual quota held by a fulltime licence in the respective NAFO Division. The maximum amount of quota that an enterprise (fulltime or supplementary) may acquire from the supplementary fleet is the maximum individual quota held by a supplementary licence in the respective NAFO Division.
The 3L small supplementary and 3Ps supplementary crab fleets may acquire a maximum of two times the maximum individual quota held by a small supplementary or supplementary licence in the respective NAFO Division.
The 35’-44’ LOA 3Ps exploratory fleet is eligible to enterprise combine within the exploratory fleet or with the 3Ps supplementary fleet.
Inshore Fleets
The inshore crab fleet in 2J3KL and Crab Fishing Area 13 may acquire a maximum of two times the maximum individual quota held by an inshore licence in a given Crab Fishing Area.
The 35’-44’ LOA 3K Crab fleet may opt to a) remain in CFA 4, retain their current crab IQ and be eligible to combine with a fulltime or supplementary crab licence; or b) move into the inshore CFA of their homeport, obtain the inshore crab IQ for that CFA, and be eligible to combine with a inshore crab licence.
The 35’-44’ LOA 3L Crab fleet may combine with an inshore crab licence holder within the respective CFA.
The 3Ps (Placentia Bay) inshore crab fleet and 35-44’ LOA 3Ps Crab fleet may acquire a maximum of two times the maximum individual quota held by a 10A or 10A (outer) licence.
The CFA 11 (Fortune Bay) and 4R (outside 8 miles) inshore Crab fleets are not eligible for enterprise combining.
8.0 Oceans Initiatives Promoting Shared Stewardship
The Oceans Act and Canada’s Ocean Strategy is the legislative framework for integrated management in Canada and together commit the federal government to undertaking integrated oceans management in five Large Ocean Management Areas (LOMAs) across Canada. Within our Region, LOMAs are further subdivided to include Coastal Management Areas (CMAs).
The LOMA process requires a governance structure reflecting a collaborative approach. It is founded on principles such as shared responsibility for supporting the sustainable development of marine resources and inclusiveness of stakeholders affected by marine resource or activity management decisions. As a result, the integrated management governance model is one of co-operative planning which intrinsically promotes stewardship.
Recognizing the need to manage Canada’s fisheries and oceans using an ecosystem approach, the Department is leading the development of integrated oceans management plans for the LOMAs. Similarly, this ecosystem approach has also predicated the development of Departmental integrated fisheries management plans. Linking to two will allow for integration of fisheries and non-fisheries related uses of Canada’s oceans. Embedding fisheries management, as far as feasible, within the broader ecosystem approach will help to minimize resource conflicts and achieve sustainable management.
8.1 Integrated Management Bodies
Integrated management bodies such as the Placentia Bay Brand Banks LOMA, the Gulf of St. Lawrence Integrated Management (GOSLIM) LOMA and the CMAs nested within them provide a forum for consultation with the stakeholders who want to be engaged in decisions that affect them. Snow crab is very important to the economy, history, and culture of our Province, it is important that DFO avail of the best possible mechanisms to engage stakeholders for feedback which will inform management decisions for this resource.
LOMAs are composed of both governmental and non-governmental representatives with interests within the LOMA boundaries. A Placentia Bay Grand Banks LOMA Committee has been established since December 2007 and an integrated management plan is being drafted with expected completion in 2010. A GOSLIM LOMA, integrated management plan is expected by 2012. These plans will include ecosystem, socio-economic, cultural and institutional objectives that will inform decision-making within the LOMAs. Given current management practices, fisheries will often emerge as being a source of important objectives and also the source of a number of different risks (exploitation of target species, impacts on conservation species and habitats, etc.). Linking the IFMP objectives with integrated management plan objectives will allow for consideration of these risks in relation to those from other sectors, and also broader societal objectives, to more effectively mitigate these risks in support sustainable fisheries management.
Within the Placentia Bay Grand Banks LOMA, there are two CMAs: the Placentia Bay Integrated Management Planning Committee (PBIMPC) and the Coast of Bays Integrated Coastal Zone Management Committee. There are three NL Region CMAs within the GOSLIM LOMA: The ACAP Humber Arm CMA, the Bay St. George-Port au Port Peninsula CMA and the Great Northern Peninsula CMA. CMAs allow the Department to work with local community groups and individuals who provide “on the ground expertise” of ocean resource issues at a coastal scale, ensuring that the planning process and associated actions are relevant to the area.
8.2 Working Arrangements/Existing Agreements
The Contribution Agreement between DFO and the FFAW supports the Fisheries Stewardship Program, which enables fish harvesters province wide to share and expand their knowledge and to develop tools necessary to adopt sustainable fishing practices as part of shared stewardship and to implement a broader fisheries conservation ethic.
9.0 COMPLIANCE PLAN
9.1 Conservation and Protection Program Description
The deployment of Conservation and Protection resources in the 2HJ 3KLNOPsn 4R Snow Crab fishery is conducted in conjunction with the management plan objectives as well as in response to emerging issues. The mix of enforcement options available and overriding conservation objectives determine the level and type of enforcement activity. The enforcement work-planning process is designed to establish priorities based on management objectives and conservation concerns. The monitoring and evaluation elements of enforcement work-plans facilitate in-season adjustments should conservation concerns and/or significant non-compliance emerge.
9.2 Regional Compliance Program Delivery
The Conservation and Protection program promotes and maintains compliance with legislation, regulations and management measures implemented to achieve the conservation and sustainable use of Canada’s aquatic resources, and the protection of species at risk, fish habitat and oceans.
The program is delivered through a balanced regulatory management and enforcement approach including:
- promotion of compliance through education and shared stewardship;
- monitoring, control and surveillance activities; and,
- management of major cases /special investigations in relation to complex compliance issues.”
Pillar 1: Education and Shared Stewardship
Conservation and Protection Supervisors and Area Chiefs will actively participate in annual consultations with the fishing industry and aboriginal organizations. Compliance issues will be presented and recommendations requested for resolution. As well, informal meetings will continue on an ad hoc basis to resolve in-season matters.
Part of the education pillar will have Fishery Officers present and discuss fisheries conservation during visits to local schools, plus they will interact with fishers on a regular basis. The resulting information will be used as part of the planning process within C&P.
Pillar 2: Monitoring Control & Surveillance
Compliance Monitoring
C&P will promote compliance with the management measures governing the 2HJ 3KLNOPsn 4R Snow Crab fishery by the following means: C&P Patrols, Dockside Inspections, At-Sea Inspections, Aerial Surveillance, Vessel Monitoring System review, and through At-Sea Observer Deployments.
C&P Detachments will conduct Snow Crab fishery patrols by vehicle, vessel, and fixed wing aircraft. Middle distance patrols will be conducted using CCG and DND vessels.
Each detachment will ensure that monitoring and inspections of fish landing activity are to be carried out on a routine basis. Where a vessel is selected for a comprehensive inspection, officers will ensure that catch composition, weight verification and size variation sampling is conducted.
Conservation and Protection Supervisors responsible for 2HJ 3KLNOPsn 4R Snow Crab fishery, will ensure that surveillance flights are conducted on a routine basis. Flights will be tasked to both offshore and inshore fisheries.
The VMS system will be relied upon to provide real-time data on the location of vessels within portions of this fleet. Utilization of this resource will assist officers in determining where the enterprise is fishing, the port of destination and the estimated time of arrival to port. The VMS data will also be relied upon to conduct future analysis and comparisons of fishing activity.
At-Sea Observers will be randomly deployed to observe, record and report aspects of the fishing activity. The resulting data will be utilized to compare catch composition of vessels (observed trips vs. non observed trips). At-Sea Observers will also be deployed to address conservation issues as required such as soft shell crab, misreporting of catch, undersize catch, or high levels of incidental catch.
Fishery Officers will review quota monitoring reports to ensure individual quotas are not exceeded.
Compliance Performance
Post season analysis sessions will be conducted with Conservation and Protection and Resource Management staff to review issues encountered during the previous season and to make recommendations on improving management measures. The initial sessions will be conducted at the Area level, followed by a regional session that will be held with other sectors.
Pillar 3: Major Case
Current Compliance Issues
Compliance issues in this fishery include: fishing gear requirements; quota overruns; unmonitored landings; misreporting of catch by management area; misreporting of catch amounts; having unattended fishing gear left in the water and fishing during closure.
The primary focus of C&P efforts for the duration of this Integrated Fisheries Management Plan will verifying compliance to the requirement to report accurately all fishing activities related to this species.
A secondary focus will be on the detection of unmonitored landings and the landing undersized crab.
Compliance Strategy
C&P has developed an operational plan that outlines monitoring and compliance activities that will be carried out by C&P personnel adjacent to the 2HJ 3KLNOPsn 4R management areas. The plan will provide guidance; promote effective monitoring and enable personnel to effectively maintain compliance with management measures governing the 2HJ 3KLNOPsn 4R snow crab fisheries.
The objectives of the operational plan are to provide a body of information that will provide guidance to C&P personnel, while engaged in monitoring and reviewing this fishery, to ensure compliance and conduct investigations. Sources of information to be used include vessel positioning data, officer inspection data, fishing logs, DMP records, At Sea Observer records and purchase transactions.
10. PERFORMANCE REVIEW
The Performance Review outlines the activities and controls that are used in achieving Fisheries Management Objectives. Table 15 identifies the specific strategies that are used to achieve Fisheries Management Objectives.
| Measurable Objectives/Activities | Fisheries Management Strategies |
|---|---|
|
|
|
|
|
|
|
|
|
|
11. Glossary of terms
Abundance: Number of individuals in a stock or a population.
Area/Subarea: an area defined by the Convention on Future Multilateral Cooperation in the Northwest Atlantic Fisheries by NAFO, and as described in the Atlantic Fishery Regulations, 1985.
Biomass: total weight of all individuals in a stock or a population.
By-catch: The unintentional catch of one species when the target is another.
Catch per Unit Effort (CPUE): The amount caught for a given fishing effort. Ex: tons of shrimp per tow, kilograms of fish per hundred longline hooks.
Communal Commercial Licence: Licence issued to First Nations organizations pursuant to the Aboriginal Communal Fishing Licences Regulations for participation in the general commercial fishery.
Discards: Portion of a catch, thrown back into the water after they are caught in fishing gear.
Dockside Monitoring Program (DMP): A monitoring program that is conducted by a company that has been designated by the Department, which verifies the species composition and landed weight of all fish landed from a commercial fishing vessel.
Fishing Effort: Quantity of effort using a given fishing gear over a given period of time.
Fishing Mortality: Death caused by fishing, often symbolized by the Mathematical symbol F.
Landings: Quantity of a species caught and landed.
Mesh Size: Size of the mesh of a net. Different fisheries have different minimum mesh size regulation.
Metric Tonne: 1000kg or 2204.6lbs.
Observer Coverage: When a licence holder is required to carry an officially recognized observer onboard their vessel for a specific period of time to verify the amount of fish caught, the area in which it was caught and the method by which it was caught.
Population: Group of individuals of the same species, forming a breeding unit, and sharing a habitat.
Quota: Portion of the total allowable catch that a unit such as vessel class, country, etc. is permitted to take from a stock in a given period of time.
Recruitment: Amount of individuals becoming part of the exploitable stock e.g. that can be caught in a fishery.
Research Survey: Survey at sea, on a research vessel, allowing scientists to obtain information on the abundance and distribution of various species and/or collect oceanographic data. Ex: bottom trawl survey, plankton survey, hydroacoustic survey, etc.
Species at Risk Act (SARA): The Act is a federal government commitment to prevent wildlife species from becoming extinct and secure the necessary actions for their recovery. It provides the legal protection of wildlife species and the conservation of their biological diversity.
Stock: Describes a population of individuals of one species found in a particular area, and is used as a unit for fisheries management. Ex: NAFO area 4R herring.
Stock Assessment: Scientific evaluation of the status of a species belonging to a same stock within a particular area in a given time period.
Total Allowable Catch (TAC): The amount of catch that may be taken from a stock.
Trawl: Fishing gear: cone-shaped net towed in the water by a boat called a "trawler". Bottom trawls are towed along the ocean floor to catch species such as groundfish. Mid-water trawls are towed within the water column.
Validation: The verification, by an observer, of the weight of fish landed.
Vessel Size: Length overall.
Year-class: Individuals of a same stock born in a particular year. Also called "cohort".
12. Appendices
| Fisheries Management Strategies | Operational Hazards | Fisheries Management Controls |
|---|---|---|
|
|
|
|
|
|
|
|
|
|
|
|
|
|
|
Appendix 2: Regulatory Measures Respecting Snow Crab
A) In accordance with the Atlantic Fishery Regulations, 1985 (AFR),
52. No person shall, in a Crab Fishing Area set out in column I of an item of Schedule XII, during the close time set out in column II of that item,
- subject to section 55, fish for crab,
- possess any crab unless the crab is being transported under the authority of a fish transporting licence issued under these Regulations; or
- subject to section 52.1, have a crab trap on board a vessel.
52.1
- A fishery officer may in writing authorize a person to transport crab traps during a close time in a Crab Fishing Area for the purpose of the sale, repair or storage of those traps.
- A person shall not transport crab traps pursuant to an authorization referred to in subsection (1) except from and to locations, in such quantities and on such dates as are set out in that authorization.
53. No person shall have in his possession:
- any female crab
- any Snow Crab that is less than 95 mm in width; or
- in a Crab Fishing Area, any crab part or crab meat separated from the carapace of a crab.
54.
- Subject to section 55, no person shall fish for crab except from a vessel and with a crab trap.
- No person shall fish with or have on board a vessel
- a crab trap that has a mesh size less than 65 mm; or
- a crab trap the volume of which exceeds 2.1m3 when measured on the exterior.
- In Crab Fishing Area 1 – 11, no person shall fish with or have on board a vessel
- a crab trap other than a cone-shaped trap; or
- a cone-shaped trap that has a bottom ring with an inside diameter greater than 133 cm.
| Contact | Telephone | Fax | |
|---|---|---|---|
| P. O. Box 5667, St. John’s, NL, A1C 5X1 | |||
| REGIONAL HEADQUARTERS, ST. JOHN’S | |||
| Annette Rumbolt Resource Manager - Shellfish |
(709)772-4911 | (709)772-3628 | annette.rumbolt@dfo-mpo.gc.ca |
| Earl Dawe, Scientist | (709)772-2076 | (709)772-4105 | earl.dawe@dfo-mpo.gc.ca |
| Trevor Fradsham Chief - Conservation & Protection |
(709)772-4345 | (709)772-4327 | trevor.fradsham@dfo-mpo.gc.ca |
| Patricia Williams Resource Manager – Aboriginal Fisheries |
(709)772-3732 | (709)772-3628 | patricia.williams@dfo-mpo.gc.ca |
| Frank Corbett, Policy Analyst | (709)772-6935 | (709)772-4583 | frank.corbett@dfo-mpo.gc.ca |
| AREA OFFICES – RESOURCE MANAGEMENT | |||
| Leonard Knight Area Chief (3LNO), St. John’s |
(709)772-5845 | (709)772-2659 | leonard.knight@dfo-mpo.gc.ca |
| Leon Slaney Area Chief (3Ps), Grand Bank |
(709)832-3014 | (709)832-3015 | leon.slaney@dfo-mpo.gc.ca |
| Kevin Hurley Area Chief, (3K), Grand Falls - Windsor |
(709)292-5167 | (709)292-5205 | kevin.hurley@dfo-mpo.gc.ca |
| Wayne King Senior Area Representative (2J), Happy Valley – Goose Bay |
(709)896-6157 | (709)896-8419 | wayne.king@dfo-mpo.gc.ca |
| Don Ball Area Chief (4R), Corner Brook |
(709)637-4310 | (709)637-4445 | donald.ball@dfo-mpo.gc.ca |
| AREA OFFICES – CONSERVATION & PROTECTION | |||
| Ben Rodgers Area Chief (3LPs), St. John’s |
(709)772-5857 | (709)772-2659 | ben-rogers@dfo-mpo.gc.ca |
| Wade Barney Area Chief (2GHJ3K), Grand Falls - Windsor |
(709)292-5166 | (709)292-5205 | wade.barney@dfo-mpo.gc.ca |
| Ronald Burton Area Chief, (4R), Corner Brook |
(709)637-4334 | (709)637-4445 | ron.burton@dfo-mpo.gc.ca |
Appendix 4: Division 3L Conservation Areas
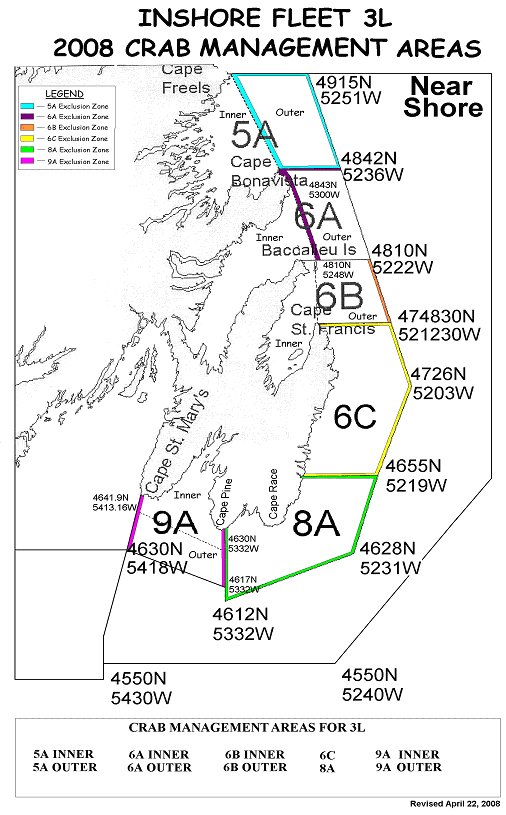
Appendix 5: Map of Crab Fishing Areas
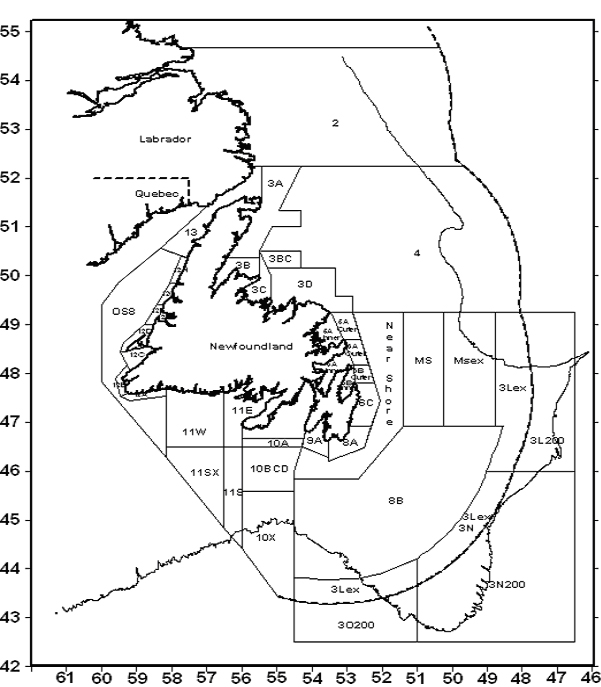
Footnotes
- Footnote 1
-
Active vessels are defined as vessels with landings in the calendar year.
- Footnote 2
-
Overview of the Atlantic Snow Crab Industry - Gardner Pinfold
- Date modified: