
Data on lost and retrieved gear
Ghost Gear Program retrieval statistics (as of October 2024)
- 3,477 at-sea, shoreline and aquaculture trips
- 40,767 units of gear retrieved *excludes rope
- 925 km of rope retrieved
- A total of 2,470 tonnes retrieved including fishing gear and aquaculture debris *excludes rope and buoys
Return of gear (as of October 2024)
If the owner of retrieved gear can be identified, they are contacted to inform them that their gear has been recovered. Owners are then given the option to collect their gear or relinquish ownership.
- Gear successfully returned to owner: 3,076
- Total number of gear matched to harvester: 4,896
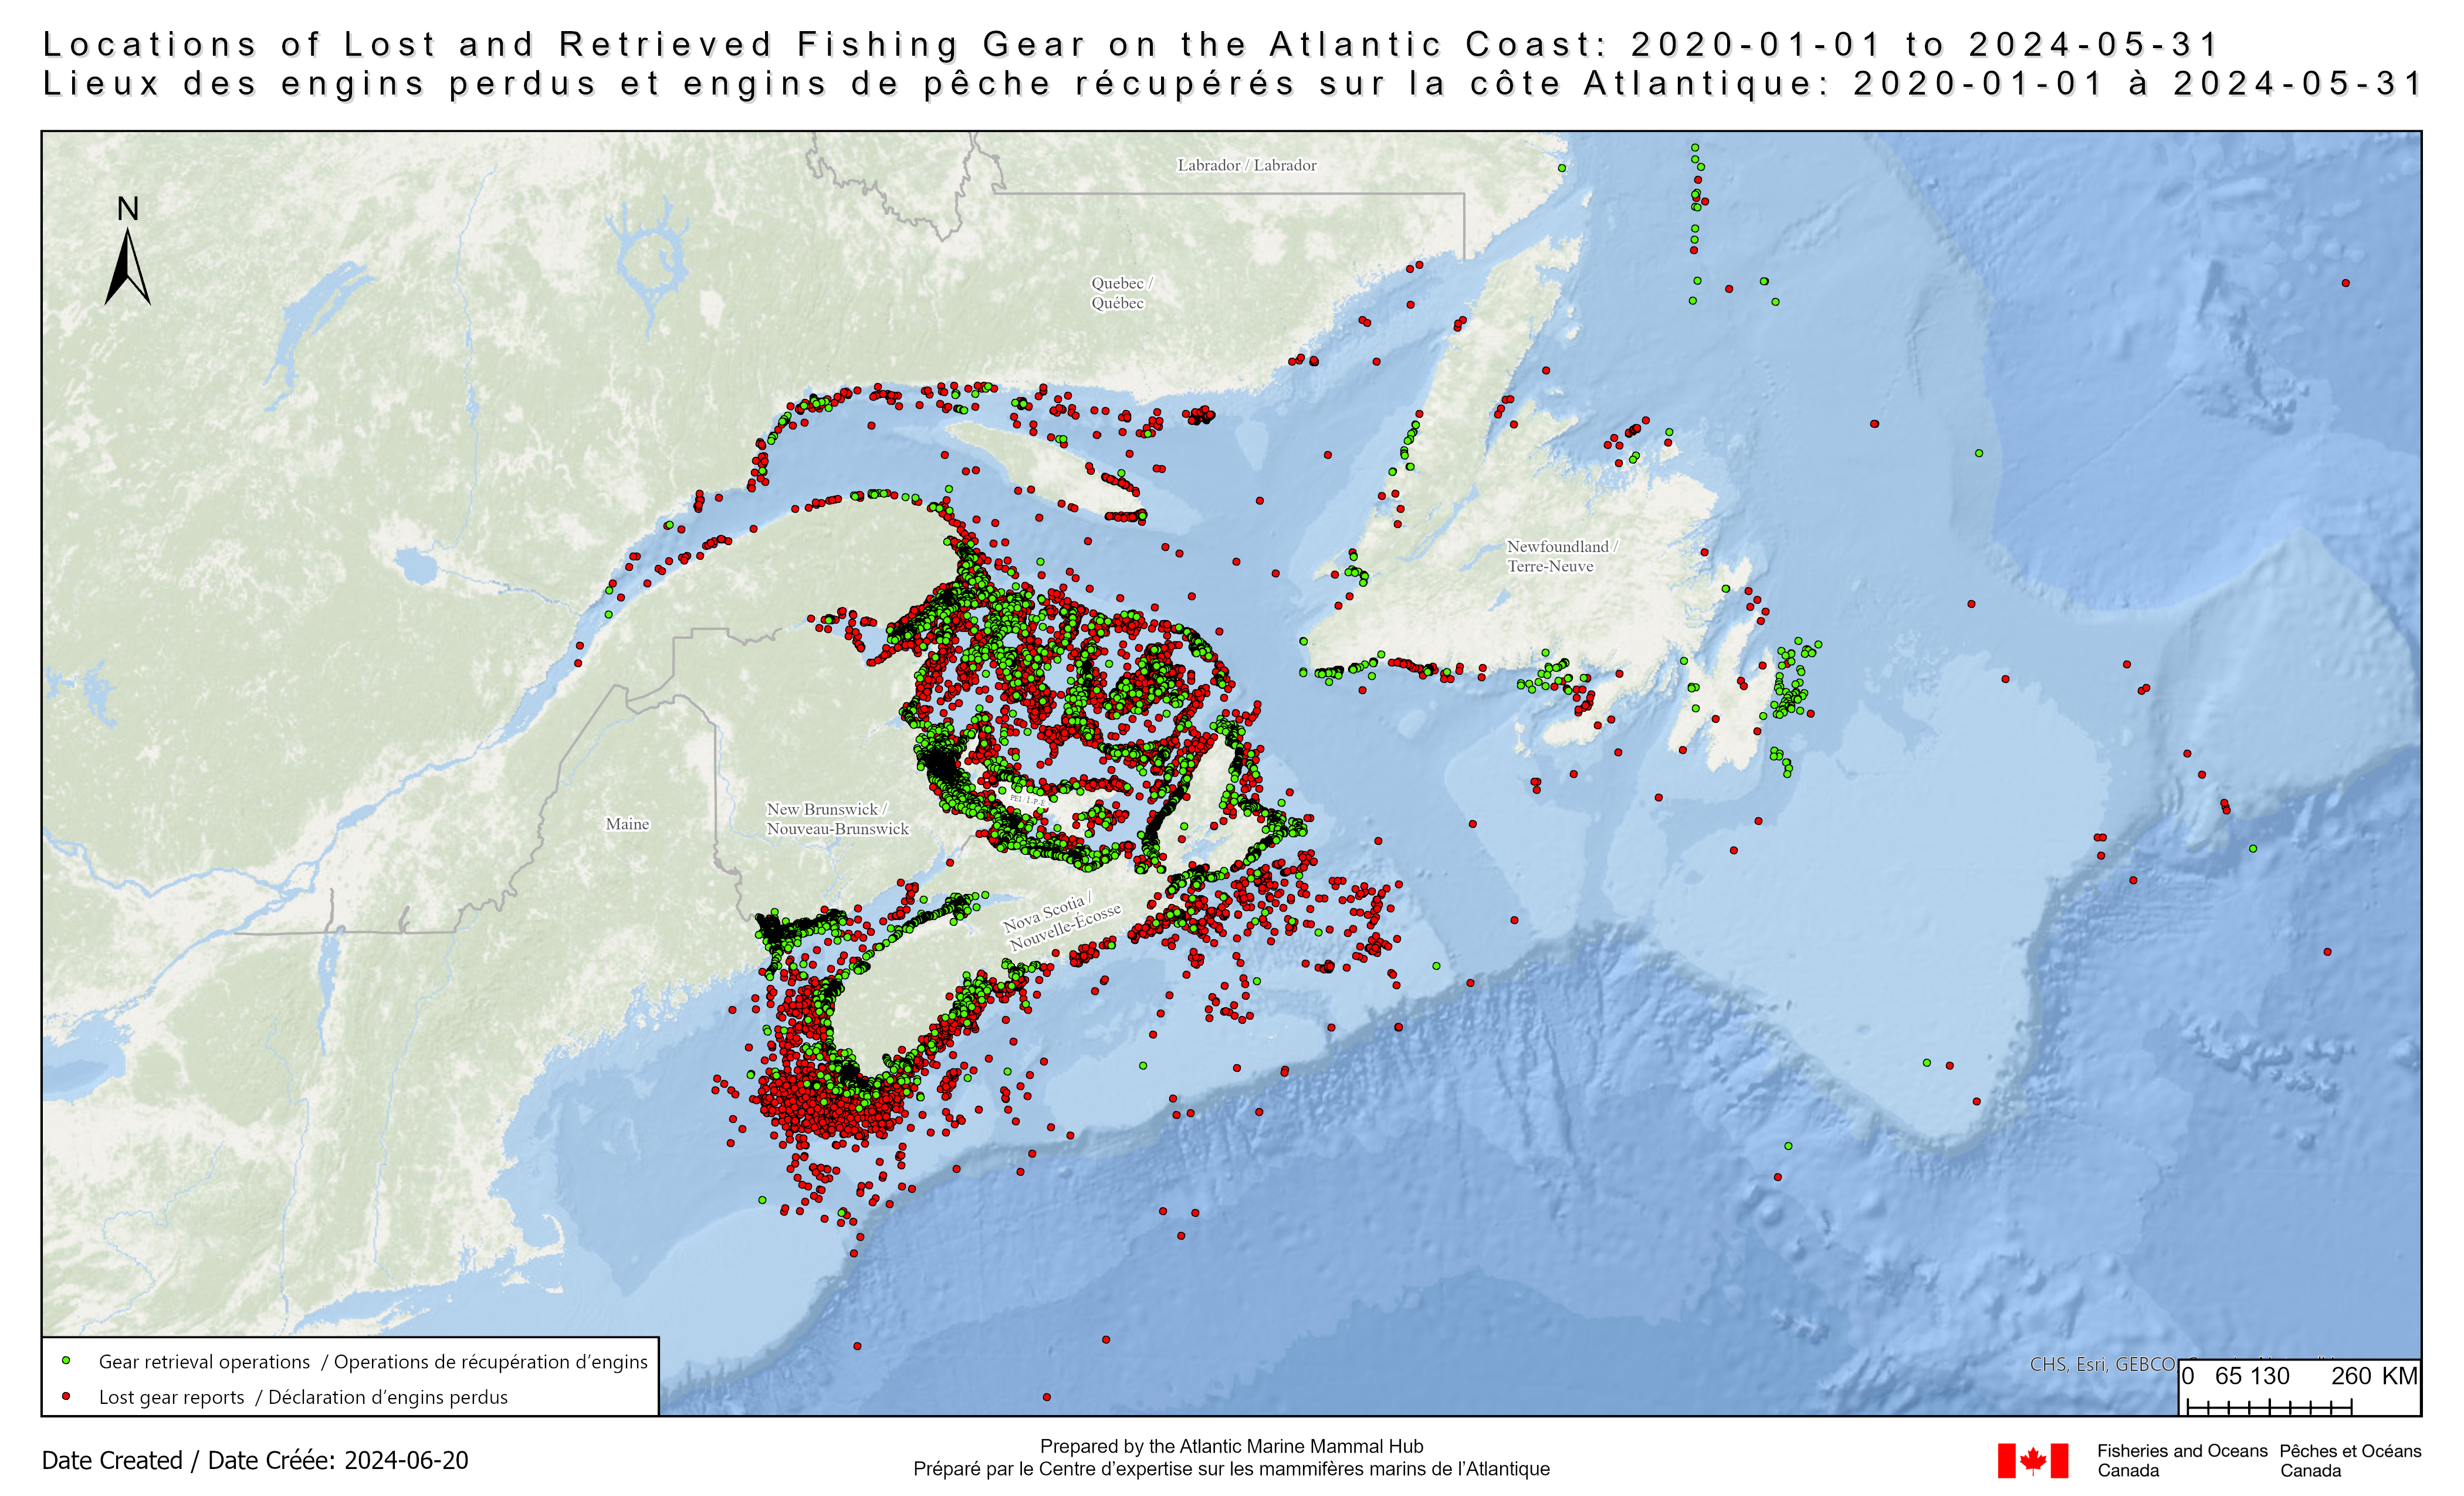
Map A: Map displaying the locations of lost gear reports submitted to DFO (red dots) and the locations of ghost gear retrieval operations (green dots) on Canada’s Atlantic coast since 2020.
Note: Each lost gear report (red dot) and each gear retrieval operation (green dot) may include multiple units of gear.
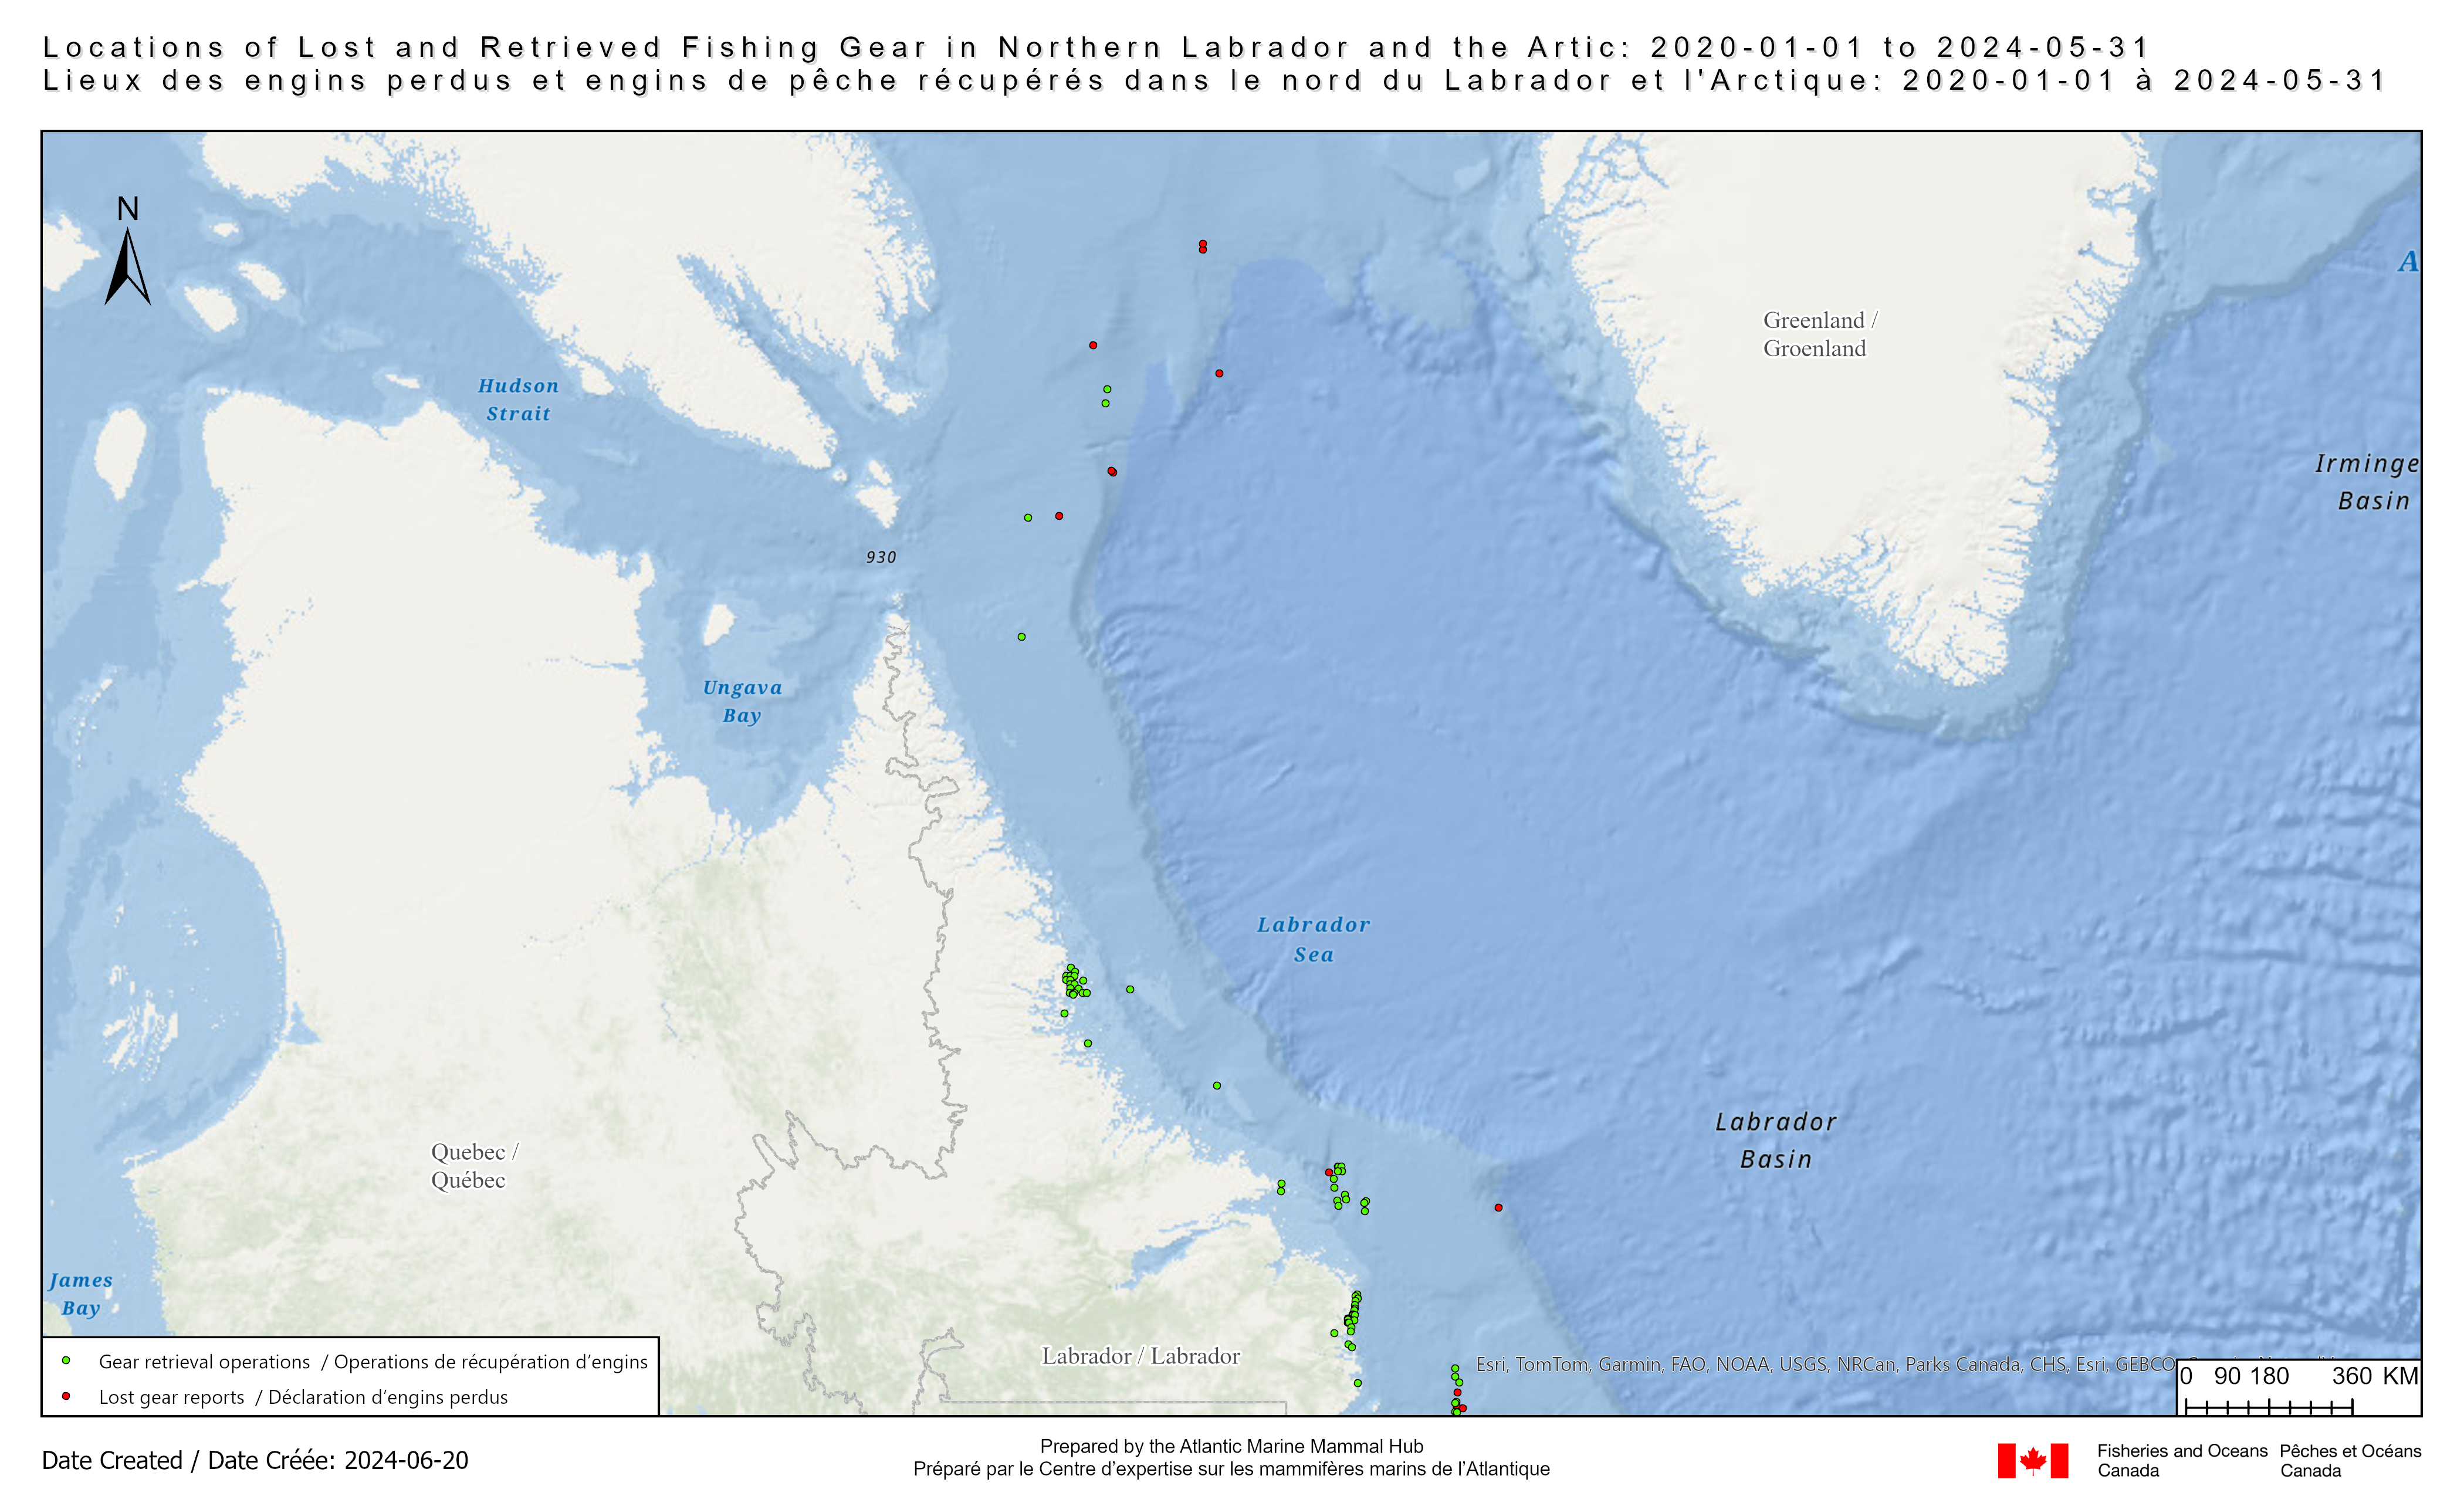
Map B: Map displaying the locations of lost gear reports submitted to DFO (red dots) and the locations of ghost gear retrieval operations (green dots) in Northern Labrador and Canada’s Arctic coast since 2020.
Note: Each lost gear report (red dot) and each gear retrieval operation (green dot) may include multiple units of gear.
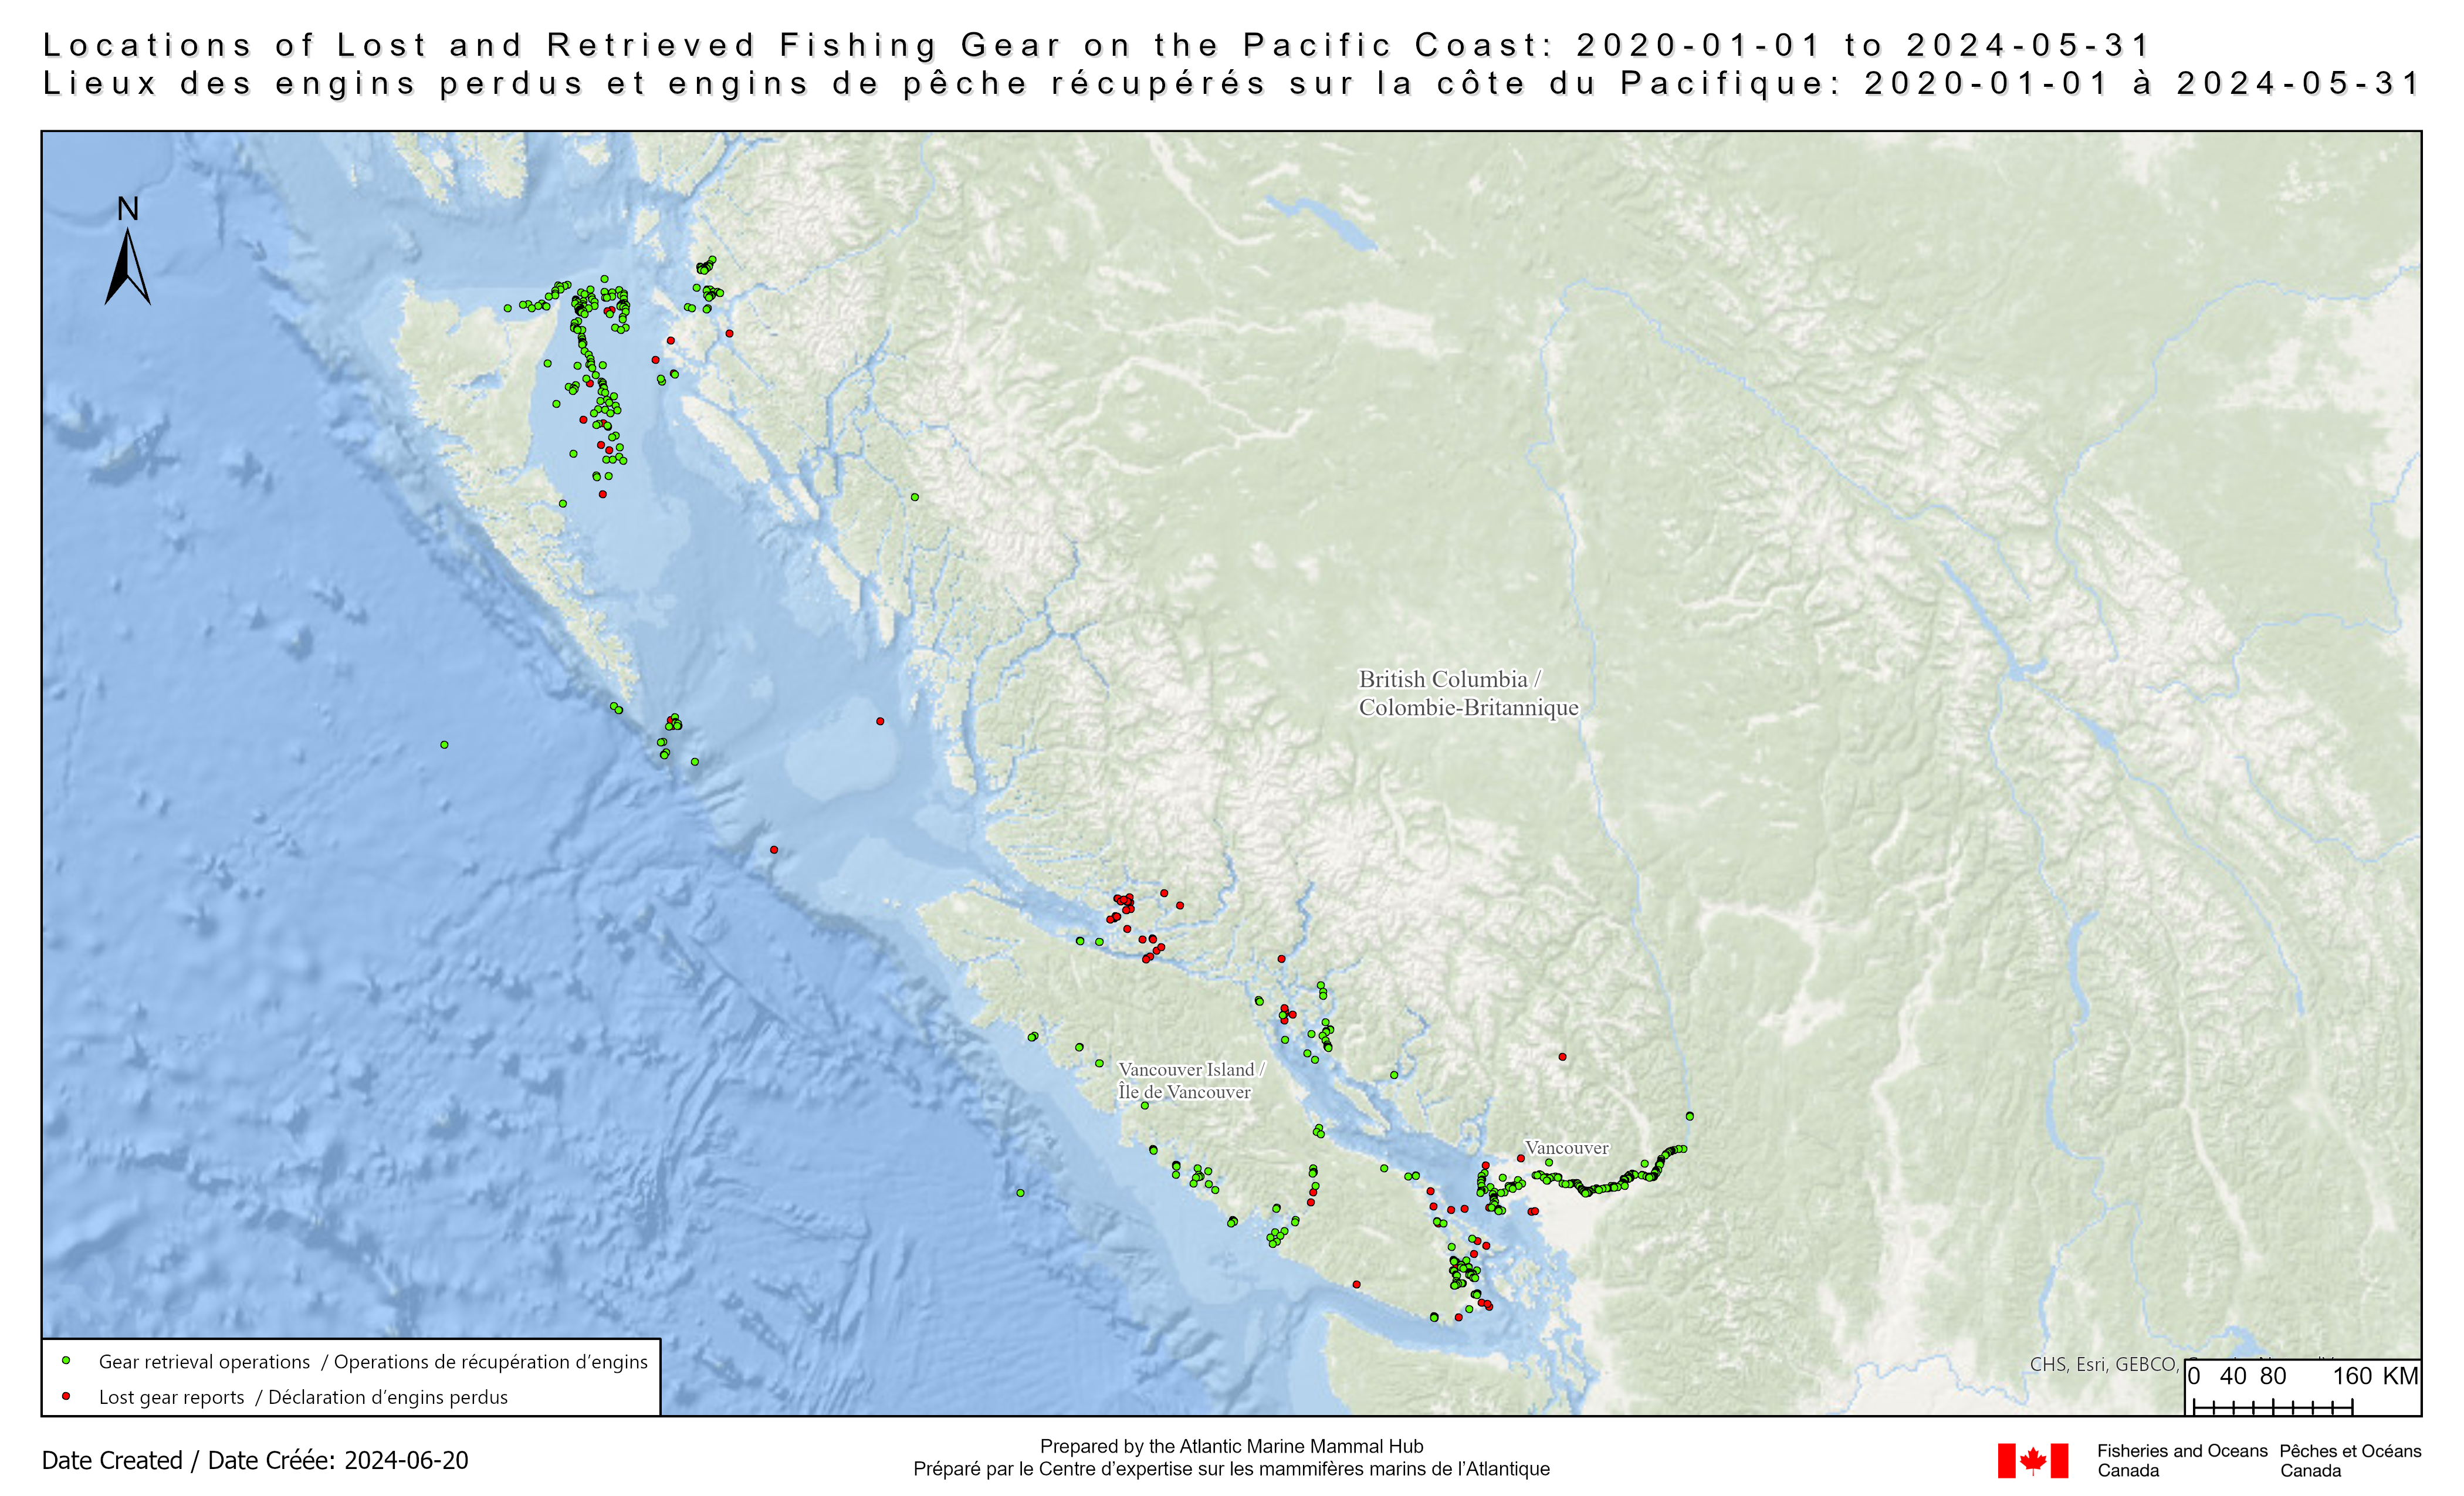
Map C: Map displaying the locations of lost gear reports submitted to DFO (red dots) and the locations of ghost gear retrieval operations (green dots) on Canada’s Pacific coast since 2020.
Note: Each lost gear report (red dot) and each gear retrieval operation (green dot) may include multiple units of gear.
Lost and retrieved gear in 2020-2024
This table displays the number of lost gear reports submitted to DFO, the percentage of lost gear reports submitted to DFO, the number of gear units reported lost, and the number of gear units retrieved for each DFO Region from January 2020 to October 2024.
| Region | Number of lost gear reports | Percentage of lost gear reports | Number of gear units reported lost | Number of gear units retrieved* |
|---|---|---|---|---|
| Arctic | 6 | 0.03% | 60 | 157 |
| Gulf | 6,629 | 32.92% | 19,432 | 8,388 |
| Maritimes | 4,548 | 22.59% | 22,961 | 23,913 |
| Newfoundland and Labrador | 234 | 1.16% | 3,454 | 2,796 |
| Quebec | 8,430 | 41.87% | 29,945 | 1,990 |
| Pacific | 288 | 1.43% | 1,950 | 5,157 |
| Ontario & Prairies | - | - | - | - |
| Total | 20,135 | 100% | 77,802 | 42,401 |
*Excludes length of rope
Percentage of lost gear reports submitted by fishery in 2020-2024: Footnote *
- Lobster – 71%
- Crab – 27%
- Groundfish – 0.6%
- Prawn – 0.5%
- Other – 0.9%
- Date modified: