
Canada's Fisheries Fast Facts 2023
On this page
- National overview
- Regional overview
- Species highlights
- International trade statistics
- Marine economy
National overview
Principal statistics, 2022
| Details | Amount |
|---|---|
| Gross Value of Outputs (CAD $'000) | |
| Commercial sea and freshwater fisheries landings | 4,819,402 |
| Aquaculture production 1 | 1,342,553 |
| Seafood product preparation & packaging revenues 2 | 7,545,532 |
| Employment (number of persons) | |
| Commercial fish harvesters and crew 3 | 45,064 |
| Aquaculture | 3,845 |
| Seafood product preparation & packaging | 20,264 |
| Commercial seafisheries | |
| Total weight of landings (metric tonnes) | 686,821 |
| Total value of landings (CAD $'000) | 4,730,349 |
| Commercial freshwater fisheries | |
| Total weight of landings (metric tonnes) | 25,880 |
| Total value of landings (CAD $'000) | 89,053 |
| International trade statistics (CAD $'000) 4 | |
| Total value of fish and seafood exports | 8,450,822 |
| Total value of fish and seafood imports | 5,522,420 |
| Trade balance | 2,928,402 |
- Statistics Canada. Table 32-10-0107-01 Aquaculture, production, and value
- Statistics Canada. Table 16-10-0117-01 Principal statistics for manufacturing industries, by North American Industry Classification System (NAICS) (x 1,000)
- Employment is estimated based on the number of registered fishers and the number of personal commercial licenses granted
- Department of Fisheries and Oceans (2023), EXIM [database], Ottawa.
Regional overview 1
Landings and production statistics, 2022
| Commercial sea and freshwater fisheries | Pacific | Inland | Atlantic | Canada |
|---|---|---|---|---|
| Number of registered fishing vessels 2 | 2,165 | 150 | 14,388 | 16,703 |
| Total weight of landings (metric tonnes) | 114,603 | 25,880 | 572,218 | 712,701 |
| Total value of landings ($'000) | 441,328 | 89,053 | 4,289,021 | 4,819,402 |
| Aquaculture | ||||
| Number of aquaculture establishments 3 | 216 | 126 | 516 | 858 |
| Total weight of production (metric tonnes) 4 | 96,507 | 6,409 | 63,349 | 166,265 |
| Total value of production ($'000) 4 | 916,924 | 37,532 | 388,097 | 1,342,553 |
| Totals may not add up due to rounding | ||||
- Atlantic: Newfoundland and Labrador, Prince Edward Island, Nova Scotia, New Brunswick, Quebec; Inland: Ontario, Manitoba, Saskatchewan, Alberta, Northwest Territories and Nunavut; Pacific: British Columbia and Yukon
- Inland vessel count is for Ontario Great Lakes only
- Statistics Canada, Survey of Aquaculture Industry, unpublished data.
- Inland totals include Ontario, Territories, and suppressed values for Manitoba, Saskatchewan, and Quebec
Species highlights
Commercial seafisheries landings by species groups and region, 2022 – Weight (metric tonnes)
| Details | Atlantic | Pacific | Canada | |
|---|---|---|---|---|
| Other | 16,403 | 0 | 16,403 | |
| Groundfish | 75,838 | 82,839 | 158,676 | |
| Pelagics | 89,230 | 15,598 | 104,827 | |
| Shellfish | 390,748 | 16,166 | 406,914 | |
| Total Weight of Landings (metric tonnes) | 572,218 | 114,603 | 686,821 | |
| Totals may not add up due to rounding | ||||
Commercial seafisheries landings by species groups and region, 2022 - Value ($'000)
| Details | Atlantic | Pacific | Canada | |
|---|---|---|---|---|
| Other | 17,663 | 0 | 17,663 | |
| Groundfish | 262,603 | 155,692 | 418,296 | |
| Pelagics | 130,857 | 62,363 | 193,220 | |
| Shellfish | 3,877,898 | 223,272 | 4,101,170 | |
| Total Value of Landings ($'000) | 4,289,021 | 441,328 | 4,730,349 | |
| Totals may not add up due to rounding | ||||
Aquaculture production, 2022
| Details | Weight (metric tonnes) | Value ($'000) | Main Producing Province | |
|---|---|---|---|---|
| Salmon | 107,998 | 1,083,501 | British Columbia | |
| Trout | 7,306 | 44,746 | Ontario | |
| Steelhead | 0 | 0 | n/a | |
| Other Finfish | 1,805 | 21,668 | British Columbia | |
| Clams | 1,361 | 9,401 | British Columbia | |
| Oysters | 14,911 | 63,039 | British Columbia | |
| Mussels | 23,795 | 44,146 | Prince Edward Island | |
| Scallops | 83 | 644 | British Columbia | |
| Other Shellfish | 208 | 7,779 | Nova Scotia | |
| Other | 8,798 | 67,629 | n/a | |
| Total Aquaculture | 166,265 | 1,342,553 | n/a | |
| Totals may not add up due to rounding | ||||
Aquaculture production statistics are sourced from Statistics Canada. Table 32-10-0107-01 Aquaculture, production and value.
International trade statistics 1
International trade in fish and seafood products, 2022 and 2023 (exports)
| Details | Weight (metric tonnes) | Value ($'000) | ||
|---|---|---|---|---|
| Top product exports, by species | 2022 | 2023 | 2022 | 2023 |
| Lobster | 97,443 | 87,049 | 2,808,917 | 2,632,202 |
| Snow/Queen Crab | 48,446 | 61,266 | 1,445,242 | 1,040,845 |
| Atlantic Salmon | 78,082 | 64,799 | 970,991 | 807,531 |
| Shrimp | 55,281 | 50,872 | 438,391 | 439,738 |
| Crab, other | 22,217 | 24,313 | 537,131 | 456,527 |
| Total Exports | 565,213 | 535,667 | 8,450,822 | 7,606,750 |
- Source: Department of Fisheries and Oceans (2023), EXIM [database], Ottawa.
International trade in fish and seafood products, 2022 and 2023 (imports)
| Details | Weight (metric tonnes) | Value ($'000) | ||
|---|---|---|---|---|
| Top product imports, by species | 2022 | 2023 | 2022 | 2023 |
| Salmon, all species | 73,780 | 69,411 | 1,035,869 | 957,790 |
| Shrimp | 74,276 | 57,288 | 995,935 | 701,456 |
| Lobster | 18,045 | 15,901 | 259,069 | 284,159 |
| Skipjack/Bonito Tuna | 48,600 | 32,388 | 343,684 | 251,887 |
| Crab, all species | 12,457 | 14,508 | 199,329 | 187,613 |
| Total Imports | 631,958 | 488,408 | 5,522,420 | 4,563,632 |
- Source: Department of Fisheries and Oceans (2023), EXIM [database], Ottawa.
Marine economy
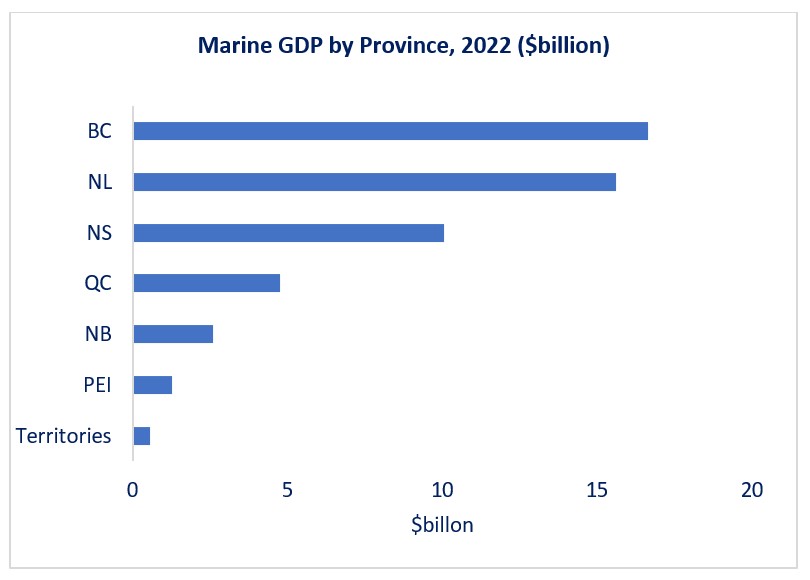
Canada's marine economy spans a number of industries and sectors, including, but not limited to, commercial fishing, manufacturing, construction, and tourism. In 2022, the marine economy accounted for approximately 2% of Canada's total GDP.
Source: Statistics Canada's Inter-provincial Input-Output Model.
Long description
- Marine GDP by province, 2022 ($billion)
- BC: 17
- NL: 16
- NS: 10
- QC: 5
- NB: 3
- PEI: 1
- Territories: 1
Source: Statistics Canada's Inter-provincial Input-Output Model.
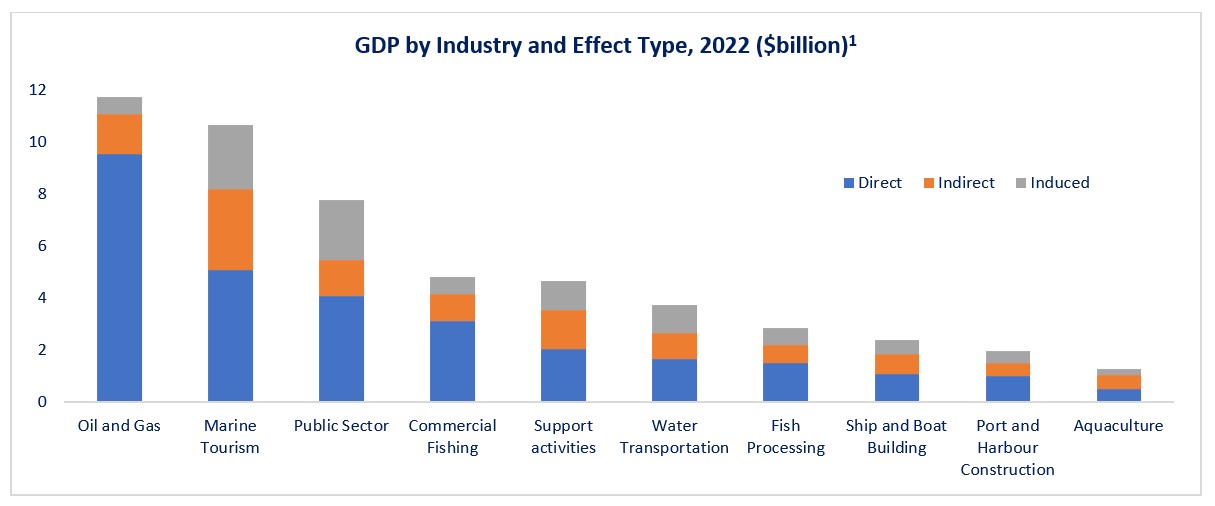
Footnote: 1Impacts:
- Direct: GDP impacts resulting from output in the marine industry itself.
- Indirect: GDP impacts resulting from the demand for input purchases needed to support the output of the marine industry.
- Induced: GDP impacts resulting from personal income spending generated from both direct and indirect impacts.
Long description
- Marine GDP by industry and effect type, 2022 ($billion)
- Oil and gas:
- Direct: 10
- Indirect: 2
- Induced: 1
- Marine tourism:
- Direct: 5
- Indirect: 3
- Induced: 2
- Public Sector:
- Direct: 4
- Indirect: 1
- Induced: 2
- Commercial fishing:
- Direct: 3
- Indirect: 1
- Induced: 1
- Support activities:
- Direct: 2
- Indirect: 2
- Induced: 1
- Water transportation:
- Direct: 2
- Indirect: 1
- Induced: 1
- Fish processing:
- Direct: 2
- Indirect: 1
- Induced: 1
- Ship and boat building:
- Direct: 1
- Indirect: 1
- Induced: 1
- Port and harbour construction:
- Direct: 1
- Indirect: 0
- Induced: 0
- Aquaculture:
- Direct: 0
- Indirect: 1
- Induced: 0
- Oil and gas:
Prepared by Statistical Services, Economic Analysis and Statistics, February, 2024
Data revisions and/or updates are available on Fisheries and Oceans Canada's Statistical Services website.
- Date modified: