
Canada's Fisheries Fast Facts 2024
On this page
- National overview
- Regional overview
- Species highlights
- International trade statistics
- Marine economy
National overview
Principal statistics, 2023
| Details | Amount |
|---|---|
| Gross Value of Outputs (CAD $'000) | |
| Commercial sea and freshwater fisheries landings | 3,697,216 |
| Aquaculture production 1 | 1,259,693 |
| Seafood product preparation & packaging revenues 2 | 7,032,160 |
| Employment (number of persons) | |
| Commercial fish harvesters and crew 3 | 42,902 |
| Aquaculture | 3,675 |
| Seafood product preparation & packaging | 18,334 |
| Commercial seafisheries | |
| Total weight of landings (metric tonnes) | 654,595 |
| Total value of landings (CAD $'000) | 3,607,641 |
| Commercial freshwater fisheries | |
| Total weight of landings (metric tonnes) | 24,467 |
| Total value of landings (CAD $'000) | 89,575 |
| International trade statistics (CAD $'000) 4 | |
| Total value of fish and seafood exports | 7,625,753 |
| Total value of fish and seafood imports | 4,560,052 |
| Trade balance | 3,065,701 |
- Statistics Canada. Table 32-10-0107-01 Aquaculture, production, and value
- Statistics Canada. Table 16-10-0117-01 Principal statistics for manufacturing industries, by North American Industry Classification System (NAICS) (x 1,000)
- Employment is estimated based on the number of registered fishers and the number of personal commercial licenses granted
- Department of Fisheries and Oceans (2024), EXIM [database], Ottawa.
Regional overview 1
Landings and production statistics, 2023
| Commercial sea and freshwater fisheries | Pacific | Inland | Atlantic | Canada |
|---|---|---|---|---|
| Number of registered fishing vessels 2 | 2,150 | 150 | 14,176 | 16,476 |
| Total weight of landings (metric tonnes) | 100,387 | 23,690 | 554,986 | 679,063 |
| Total value of landings ($'000) | 452,504 | 87,389 | 3,157,323 | 3,697,216 |
| Aquaculture | ||||
| Number of aquaculture establishments 3 | 160 | 76 | 361 | 597 |
| Total weight of production (metric tonnes) 4 | 60,962 | 5,518 | 79,505 | 145,985 |
| Total value of production ($'000) 4 | 557,893 | 48,343 | 653,458 | 1,259,693 |
| Totals may not add up due to rounding | ||||
- Atlantic: Newfoundland and Labrador, Prince Edward Island, Nova Scotia, New Brunswick, Quebec; Inland: Ontario, Manitoba, Saskatchewan, Alberta, Northwest Territories and Nunavut; Pacific: British Columbia and Yukon
- Inland vessel count is for Ontario Great Lakes only
- Statistics Canada, Survey of Aquaculture Industry, unpublished data.
- Inland totals include Ontario, Territories, and suppressed values for Manitoba, Saskatchewan, and Quebec
Species highlights
Commercial seafisheries landings by species groups and region, 2023 – Weight (metric tonnes)
| Details | Atlantic | Pacific | Canada | |
|---|---|---|---|---|
| Other | 16,438 | 0 | 16,438 | |
| Groundfish | 65,909 | 71,015 | 136,924 | |
| Pelagics | 84,692 | 14,673 | 99,365 | |
| Shellfish | 387,169 | 14,699 | 401,868 | |
| Total Weight of Landings (metric tonnes) | 554,209 | 100,387 | 654,595 | |
| Totals may not add up due to rounding | ||||
Commercial seafisheries landings by species groups and region, 2023 - Value ($'000)
| Details | Atlantic | Pacific | Canada | |
|---|---|---|---|---|
| Other | 10,215 | 0 | 10,215 | |
| Groundfish | 224,508 | 147,519 | 372,026 | |
| Pelagics | 94,852 | 34,246 | 129,098 | |
| Shellfish | 2,825,563 | 270,739 | 3,096,302 | |
| Total Value of Landings ($'000) | 3,155,137 | 452,504 | 3,607,641 | |
| Totals may not add up due to rounding | ||||
Commercial Freshwater Landings, 2023
| Details | Weight (metric tonnes) | Value ($'000) | Main Producing Province | |
|---|---|---|---|---|
| Yellow Pickerel | 11,836 | 53,124 | Ontario | |
| Perch | 2,105 | 13,682 | Ontario | |
| Whitefish | 3,064 | 11,858 | Manitoba | |
| Other | 7,462 | 10,911 | n/a | |
| Total Landings | 24,467 | 89,575 | n/a | |
| Totals may not add up due to rounding | ||||
Source: Department of Fisheries and Oceans (2024), EXIM [database], Ottawa.
Aquaculture production, 2023
| Details | Weight (metric tonnes) | Value ($'000) | Main Producing Province | |
|---|---|---|---|---|
| Salmon | 82,729 | 865,909 | British Columbia | |
| Mussels | 21,989 | 45,099 | Prince Edward Island | |
| Oysters | 15,079 | 66,282 | British Columbia | |
| Other | 26,188 | 282,403 | n/a | |
| Total Aquaculture | 145,985 | 1,259,693 | n/a | |
| Totals may not add up due to rounding | ||||
Aquaculture production statistics are sourced from Statistics Canada. Table 32-10-0107-01 Aquaculture, production and value.
International trade statistics 1
International trade in fish and seafood products, 2023 and 2024 (exports)
| Details | Weight (metric tonnes) | Value ($'000) | ||
|---|---|---|---|---|
| Top product exports, by species | 2023 | 2024 | 2023 | 2024 |
| Lobster | 87,189 | 80,365 | 2,641,169 | 2,941,359 |
| Snow/Queen Crab | 61,341 | 59,331 | 1,042,276 | 1,248,201 |
| Atlantic Salmon | 64,144 | 74,266 | 807,594 | 940,009 |
| Shrimp | 24,320 | 17,353 | 456,671 | 385,455 |
| Crab, other | 51,011 | 44,764 | 441,122 | 347,109 |
| Total Exports | 535,536 | 515,921 | 7,625,753 | 8,111,368 |
- Source: Department of Fisheries and Oceans (2024), EXIM [database], Ottawa.
International trade in fish and seafood products, 2023 and 2024 (imports)
| Details | Weight (metric tonnes) | Value ($'000) | ||
|---|---|---|---|---|
| Top product imports, by species | 2023 | 2024 | 2023 | 2024 |
| Salmon, all species | 68,314 | 66,857 | 949,390 | 951,477 |
| Shrimp | 57,292 | 69,070 | 701,630 | 776,086 |
| Lobster | 15,902 | 15,613 | 284,165 | 354,462 |
| Skipjack/Bonito Tuna | 32,386 | 38,855 | 251,888 | 291,646 |
| Crab, all species | 14,389 | 10,657 | 187,489 | 175,889 |
| Total Imports | 488,620 | 514,377 | 4,560,052 | 4,907,027 |
- Source: Department of Fisheries and Oceans (2024), EXIM [database], Ottawa.
Marine economy
Canada's marine economy spans a number of industries and sectors, including, but not limited to, commercial fishing, manufacturing, construction, and tourism. In 2023, the marine economy accounted for approximately 2% of Canada’s total GDP.
Source: Statistics Canada's Inter-provincial Input-Output Model.
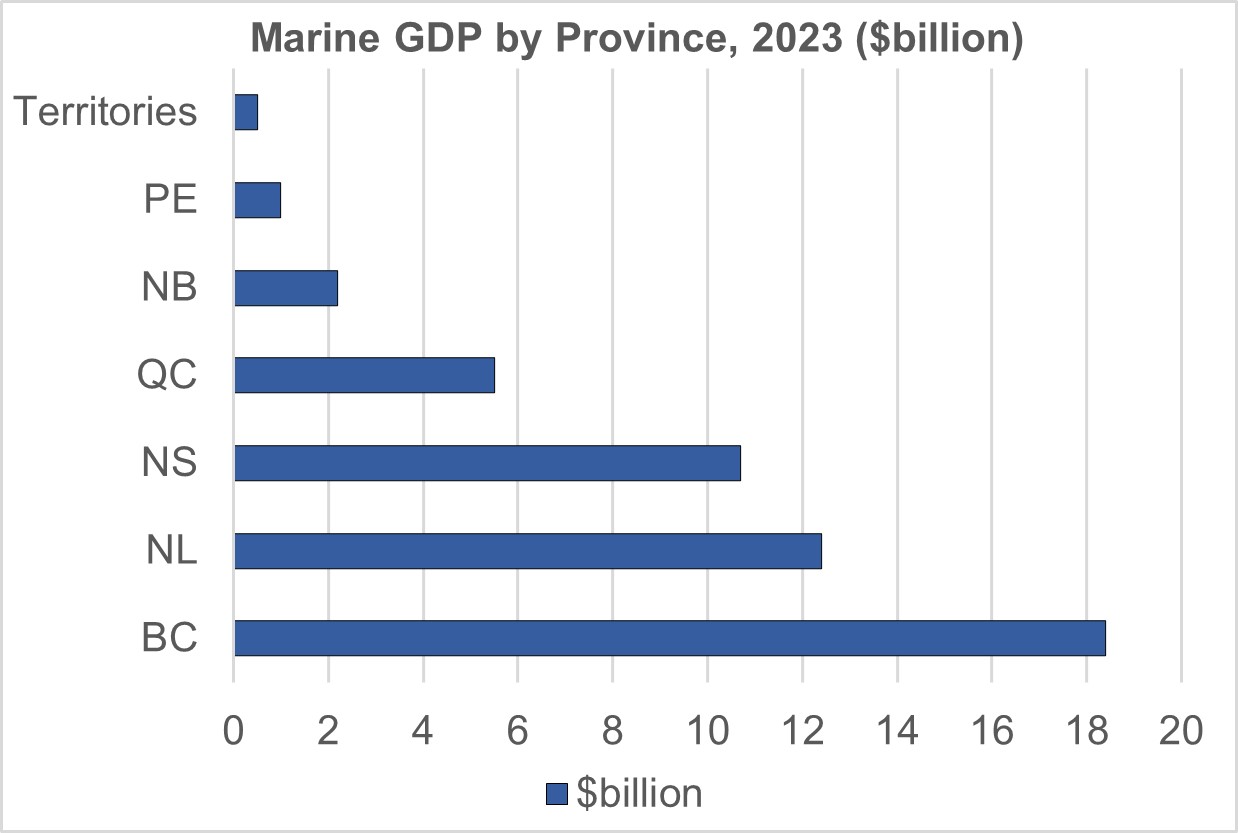
Long description
- Marine GDP by province, 2023 ($billion)
- BC: 18.4
- NL: 12.4
- NS: 10.7
- QC: 5.5
- NB: 2.2
- PEI: 1.0
- Territories: 0.5
Source: Statistics Canada's Inter-provincial Input-Output Model.
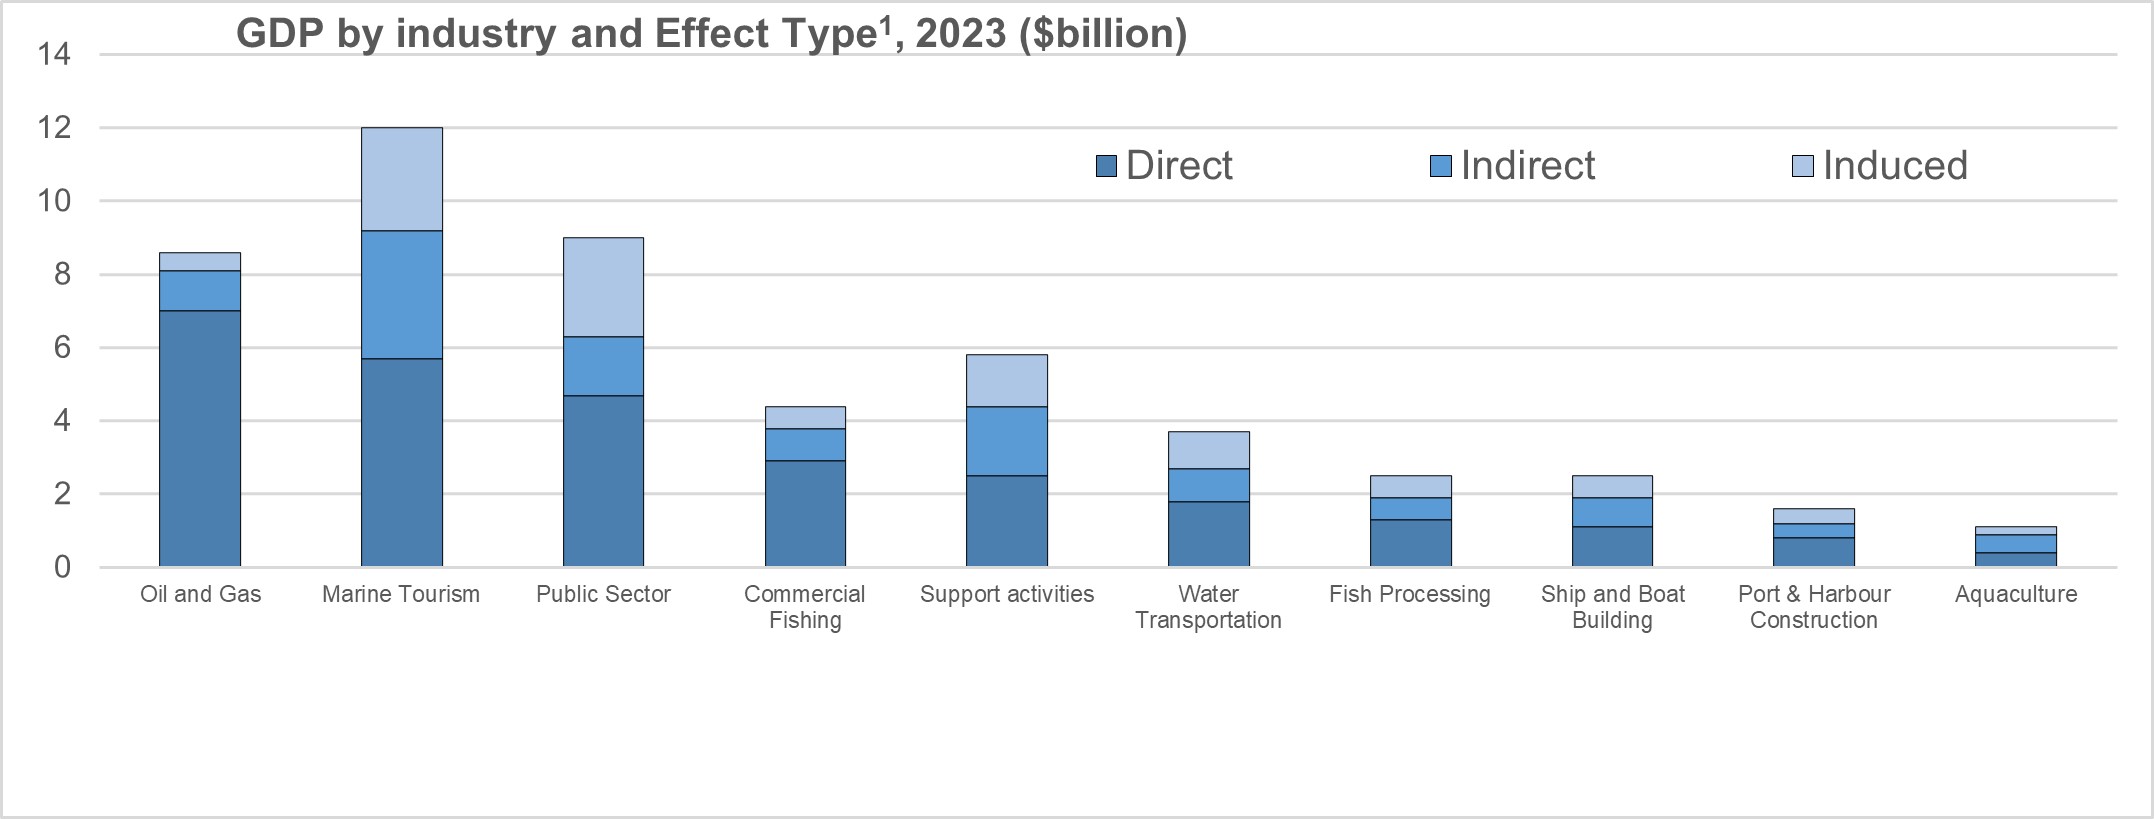
Footnote: 1Impacts:
- Direct: GDP impacts resulting from output in the marine industry itself.
- Indirect: GDP impacts resulting from the demand for input purchases needed to support the output of the marine industry.
- Induced: GDP impacts resulting from personal income spending generated from both direct and indirect impacts.
Long description
- Marine GDP by industry and effect type, 2023 ($billion)
- Oil and gas:
- Direct: 7.0
- Indirect: 1.1
- Induced: 0.5
- Marine tourism:
- Direct: 5.7
- Indirect: 3.5
- Induced: 2.8
- Public Sector:
- Direct: 4.7
- Indirect: 1.6
- Induced: 2.7
- Commercial fishing:
- Direct: 2.9
- Indirect: 0.9
- Induced: 0.6
- Support activities:
- Direct: 2.5
- Indirect: 1.9
- Induced: 1.4
- Water transportation:
- Direct: 1.8
- Indirect: 0.9
- Induced: 1.0
- Fish processing:
- Direct: 1.3
- Indirect: 0.6
- Induced: 0.6
- Ship and boat building:
- Direct: 1.1
- Indirect: 0.8
- Induced: 0.6
- Port and harbour construction:
- Direct: 0.8
- Indirect: 0.4
- Induced: 0.4
- Aquaculture:
- Direct: 0.4
- Indirect: 0.5
- Induced: 0.2
Prepared by Statistical Services, Economic Analysis and Statistics, February, 2025
Data revisions and/or updates are available on Fisheries and Oceans Canada's Statistical Services website.
- Date modified: