1995 Survey of Recreational Fishing in Canada
Survey Highlights
Summary
Recreational fishing is an important economic activity in the natural resources sector. Over 4.2 million adult anglers fished in Canada in 1995. Of this total, almost 749,000 were anglers visiting this country, many for the sole purpose of recreational fishing. The estimated 4.2 million anglers covered in the survey fished for 55.5 million days and caught over 254 million fish of all species. Of the fish caught, just over 113 million (or 44.6%), were kept. Although fishing provided the focus of activity for anglers, the most important factors associated with their enjoyment of the sport are the lack of pollutants in the fish they caught and clean water.
In total, the angling population spent $7.4 billion in Canada in 1995 of which $4.9 billion was directly associated with their sport. Anglers spent over $2.5 billion on package fishing trips, accommodation, food, transportation, fishing supplies and other services directly related to their angling activities. These expenditures were further augmented by monies they spent on durable goods purchased to improve their access to the resource and their enjoyment of it. Investments in 1995 totaled close to $4.9 billion for such durables as fishing equipment, boats, motors, camping equipment and special vehicles. Anglers estimated that almost $2.4 billion of these investment expenditures were wholly attributable to their participation in angling.
Anglers further indicated that they were willing to spend on average $17.37 per day over and above their current expenditure levels for costs associated with fishing. The total additional amount anglers indicated they were willing to pay in 1995 was $964 million. Resident anglers accounted for 83% of this total. There were notable differences when comparing resident and nonresident anglers. Resident anglers indicated they were willing to pay approximately $16.35 per day compared to $21.52 per day for Canadian nonresidents and $25.77 per day for visitors to Canada.
Nonresident anglers made over three million trips for fishing and other reasons. Just over half these trips were made by visitors to Canada with the other half representing trips by Canadians to other provinces/territories. Overall, nonresident anglers fished on 58% of the trips they made, with visitors to Canada indicating fishing activity on almost 80% of their trips.
The framework of socio-economic and biological information provided by this survey will help managers of this resource better assess and manage fish resources. For example, the impressive catch and release results achieved over the past five years indicate that anglers understand better the need to conserve this fragile and important natural resource.
Comparisons with 1990
Due to major changes in methodology covering resident anglers in the province of Ontario (from a household survey to a licence-based sample), direct comparisons with 1990 are not possible. The comparisons provided below are based on the total results in both 1990 and 1995 excluding Ontario resident anglers (Appendix 5).
In general terms, therefore, there was a 6.6% decrease in the number of active adult anglers since 1990. Nonresident anglers decreased by only 1.2% whereas resident angling dropped by 9%. The number of days fished dropped by 9.7% although, on average, the number of days fished per angler dropped by only 3.4%. Similarly, even though the number of fish caught fell by 9.9%, the average number of fish caught per angler fell only slightly (3.5%).
The most important factor was the 19.3% reduction in the number of fish kept, indicating a continuing trend among anglers to practise catch and release.
There was a 5.2% increase in major purchases and investments. Although there was a drop of 14.5% in expenditures for boating equipment, this was more than balanced by increased spending on special vehicles and land and buildings. There was only a small increase of 3.3% in expenditures for such items as food, lodging, transportation, etc. However, expenditures on fishing supplies increased by 31.5% and purchases of package deals increased by 11.4%.
Angler Profile
There were 4.2 million active adult anglers in Canada in 1995 (Table 1). Of these anglers, 3.3 million were resident anglers (anglers who lived in Canada and who fished in their home province/territory). The largest numbers of these resident anglers were concentrated in Ontario and Quebec (Table 2), however, the participation rate, that is the proportion of the population taking part in recreational fishing, was highest in the Yukon followed by Newfoundland. Additionally, over 185,000 nonresident Canadian anglers (anglers who lived in Canada but who fished outside their home jurisdiction) and over 749,000 other nonresidents (persons who lived outside Canada but fished in this country) actively fished in 1995. British Columbia received 42.5% of the nonresident Canadians who fished in its fresh and salt water areas whereas 71.8% of the nonresident, non-Canadians fished in Ontario. Visitors, including those 185,540 Canadians who fished outside their home jurisdictions, made up 22.1% of the total adult angler population.
| Resident | Nonresident Canadian | Nonresident Non-Canadian | Total | |
|---|---|---|---|---|
| Total Active Adult Anglers | 3,285,840 | 185,540 | 749,260 | 4,220,640 |
| Males | 2,482,873 | 158,169 | 644,333 | 3,285,375 |
| average age | 42 | 45 | 49 | 44 |
| Females | 790,082 | 27,180 | 103,365 | 920,627 |
| average age | 40 | 43 | 48 | 41 |
| Unspecified | 12,885 | 191 | 1,562 | 14,638 |
| Jurisdiction | Active Resident Anglers | |
|---|---|---|
| Number | % | |
| Nfld. & Lab. | 122,677 | 3.7 |
| P.E.I. | 11,380 | 0.3 |
| Nova Scotia | 57,941 | 1.8 |
| New Brunswick | 64,694 | 2.0 |
| Quebec | 1,026,743 | 31.2 |
| Ontario | 1,039,581 | 31.6 |
| Manitoba | 120,599 | 3.7 |
| Saskatchewan | 132,955 | 4.0 |
| Alberta | 219,807 | 6.7 |
| B.C. Freshwater | 294,439 | 9.0 |
| B.C. Tidal | 181,209 | 5.5 |
| Yukon Territory | 6,292 | 0.2 |
| N.W.T | 7,523 | 0.2 |
| Total | 3,171,270 | 100.0 |
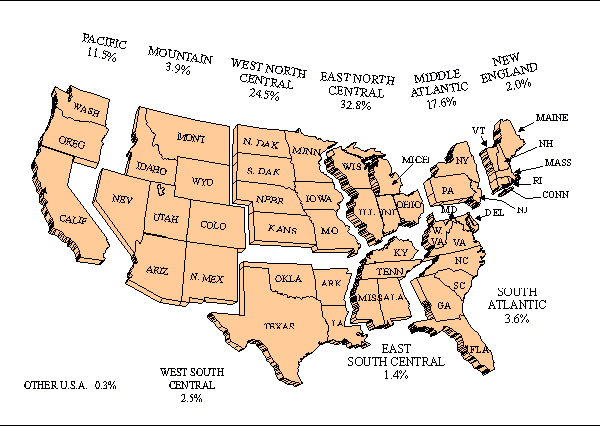
Male anglers were dominant, making up 75.6% of resident adult anglers, 85% of Canadian nonresident anglers and 86% of all non-Canadian nonresident anglers. Approximately 80% of nonresident anglers were foreigners, mainly Americans coming from the East North Central (32.3%), West North Central (24.1%) and mid-Atlantic census regions of the United States (Figure 1). The remaining nonresident anglers were Canadians who fished outside their home provinces/territories, with 61.1% coming from the prairie provinces (Table 3).
| Jurisdiction/State Census Group | Total Number |
|---|---|
| Canadian | |
| Maritimes | 9,165 |
| Quebec | 15,946 |
| Ontario | 40,018 |
| Prairies | 121,443 |
| British Columbia | 9,927 |
| Territories | 1,016 |
| Other | 1,303 |
| Canadian Total | 198,818 |
| Non-Canadian | |
| New England | 14,875 |
| Mid Atlantic | 131,322 |
| East North Central | 244,825 |
| West North Central | 182,705 |
| Mountain | 29,236 |
| Pacific | 85,783 |
| South Atlantic | 26,929 |
| East South Central | 10,398 |
| West South Central | 18,559 |
| Hawaii | 531 |
| Alaska | 1,783 |
| United Kingdom | 3,034 |
| Europe | 6,630 |
| Africa | 42 |
| Asia | 297 |
| Australia/Pacific Region | 312 |
| Other | 955 |
| Non-Canadian Total | 758,216 |
| All Nonresident Anglers | 957,034 |
Figure 1: Regional Distribution of United States Residents Who Held Canadian Angling Licences in 1995

Fishing Effort
In Canada, fishing is a major recreational activity. Adult anglers fished a total of 55.5 million days in Canada in 1995 (Table 4). Over 42% of these days were spent in Ontario with Quebec second at 19.6%. Almost 88% of this effort was expended by Canadian anglers fishing within their respective provinces/territories, while 2.5% of this effort was expended by Canadians visiting other provinces and 9.5% by foreign anglers visiting Canada. Resident anglers fished an average of 14.9 days, nonresident Canadians fished an average of 7.6 days and foreign nonresidents fished an average of 7.0 days. Most of this fishing activity (93.7%) took place in freshwater.
| Waters | Resident | Nonresident Canadian | Nonresident Non-Canadian | Total |
|---|---|---|---|---|
| Freshwater | 45,881,704 | 1,208,295 | 4,912,771 | 52,002,770 |
| Saltwater | 2,954,785 | 202,302 | 347,322 | 3,504,409 |
| Total | 48,836,489 | 1,410,597 | 5,260,093 | 55,507,179 |
| Average Days Fished | 14.9 | 7.6 | 7.0 | 13.2 |
Harvest
In 1995, anglers caught over 254 million fish of all species and retained just over 113 million of them (Table 5 and Table 6). Resident anglers caught 86% of the fish retained in 1995 and they kept on average almost 30 fish each over the year. Nonresident Canadians retained an average of 9.5 fish each in other provinces/territories, while visiting anglers retained an average of 18.6 fish each for the year.
| Species | Resident | Nonresident Canadian | Nonresident Non-Canadian | Total |
|---|---|---|---|---|
| Trout | 52,943,547 | 1,036,953 | 2,074,767 | 56,055,267 |
| Walleye | 25,315,886 | 1,463,410 | 19,493,513 | 46,272,809 |
| Perch | 37,106,747 | 736,554 | 4,547,213 | 42,390,514 |
| Northern Pike | 15,808,454 | 964,295 | 11,524,695 | 28,297,444 |
| Bass | 16,514,013 | 429,333 | 5,353,748 | 22,297,094 |
| Smelt | 13,000,874 | 3,518 | 57,158 | 13,061,550 |
| Shellfish | 5,395,760 | 249,787 | 622,170 | 6,267,717 |
| Salmon | 4,005,132 | 281,094 | 569,841 | 4,856,067 |
| Whitefish | 1,788,173 | 52,978 | 125,384 | 1,966,535 |
| Kokanee | 741,158 | 66,258 | 37,428 | 844,844 |
| Charr | 397,707 | 48,668 | 38,854 | 485,229 |
| Mackerel | 443,437 | 1,500 | 612 | 445,549 |
| Grayling | 410,258 | 75,369 | 126,656 | 612,283 |
| Flounder | 107,856 | 0 | 0 | 107,856 |
| Cod | 104,734 | 1,084 | 325 | 106,143 |
| Other | 21,799,349 | 326,925 | 8,142,842 | 30,269,116 |
| Total | 195,883,086 | 5,737,725 | 52,715,206 | 254,336,017 |
| Species | Resident | Nonresident Canadian | Nonresident Non-Canadian | Total | % Kept |
|---|---|---|---|---|---|
| Trout | 33,812,171 | 333,073 | 480,624 | 34,625,868 | 61.8 |
| Walleye | 12,555,880 | 502,736 | 3,654,681 | 16,713,297 | 36.1 |
| Perch | 17,346,070 | 134,967 | 2,058,030 | 19,539,067 | 46.1 |
| Northern Pike | 4,321,874 | 169,935 | 1,280,900 | 5,772,709 | 20.4 |
| Bass | 3,144,411 | 40,288 | 746,703 | 3,931,402 | 17.6 |
| Smelt | 8,942,630 | 3,518 | 57,158 | 9,003,307 | 68.9 |
| Shellfish | 4,245,715 | 167,629 | 559,582 | 4,972,926 | 79.3 |
| Salmon | 1,733,212 | 155,535 | 290,580 | 2,179,327 | 44.9 |
| Whitefish | 865,008 | 15,746 | 48,673 | 929,426 | 47.3 |
| Kokanee | 505,057 | 40,830 | 26,797 | 572,684 | 67.8 |
| Charr | 137,670 | 8,631 | 8,636 | 154,937 | 31.9 |
| Mackerel | 314,093 | 1,037 | 373 | 315,503 | 70.8 |
| Grayling | 60,515 | 11,914 | 18,224 | 90,653 | 14.8 |
| Flounder | 31,526 | 0 | 0 | 31,526 | 29.2 |
| Cod | 52,018 | 836 | 206 | 53,060 | 50.0 |
| Other | 9,647,162 | 115,855 | 4,781,484 | 14,544,501 | 48.1 |
| Total | 97,715,012 | 1,702,530 | 14,012,651 | 113,430,193 | 44.6 |
| % Kept | 49.9 | 29.7 | 26.6 | 44.6 |
Almost half of all fish were caught in the province of Ontario. However, the overall proportion of fish retained in Ontario was 34.4% indicating that catch and release was being actively practised in the province in 1995. All provinces and territories west of Ontario (with the exception of B.C. tidal waters) also had a low percentage of fish kept, whereas in the eastern provinces (except for New Brunswick) the percentage kept was higher.
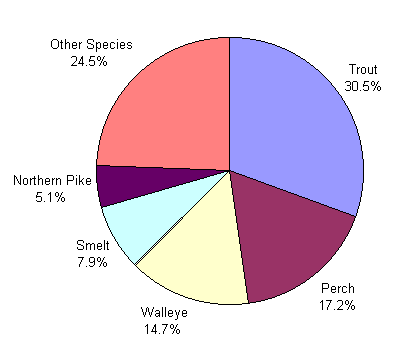
In terms of species harvested (Figure 2), trout accounted for 30.5% of all fish retained, followed by perch (17.2%), walleye (14.7%), smelt (7.9%) and northern pike (5.1%). For both nonresident groups, walleye was the most harvested species accounting for 26.2% of the foreign angler catch and 28.6% of the nonresident Canadian catch. On average, anglers retained 44.6% of the fish they caught. Resident anglers kept 49.9% of the fish they caught; nonresident anglers, 29.7% and foreign anglers, 26.6%. In general, anglers kept a higher proportion of shellfish (79%), mackerel (71%), smelt (69%) and kokanee (68%) and a lower percentage of pike (20%), bass (18%) and grayling (15%).
Figure 2: Proportion of Total Fish Retained by Anglers

Nonresident Trip Characteristics
Nonresident anglers made over 3 million leisure trips in Canada and fished on 57%, or 1.8 million of their trips (Table 7). Nonresident Canadian anglers fished on only 35% of their trips to other jurisdictions, while anglers visiting Canada fished on 78% of their trips. A total of 12.6 million days were spent in all jurisdictions by nonresident anglers with just over half (52.5%) of these days spent in Ontario. Nonresident anglers fished in all jurisdictions for 6.7 million of these days (53%), with foreign nonresidents accounting for 5.3 million of these days and Canadian nonresidents for 1.4 million. Day trips for fishing accounted for almost 25% of all fishing trips in 1995, with nonresidents visiting Canada having a proportionately lower percentage of day trips than Canadians visiting other jurisdictions.
| Characteristics | Nonresident Canadian | Nonresident Non-Canadian | Total |
|---|---|---|---|
| Trips - All Reasons | 1,518,443 | 1,520,952 | 3,039,395 |
| Fishing Trips | 546,959 | 1,213,641 | 1,760,600 |
| - % of all trips | 36.0 | 79.8 | 57.9 |
| Days Spent for All Reasons | 4,725,859 | 7,625,163 | 12,351,022 |
| Days Fished | 1,410,597 | 5,260,092 | 6,670,689 |
| - % of all days | 29.9 | 69.0 | 54.0 |
| Day Trips for Fishing | 168,330 | 265,277 | 433,607 |
| Total Nights Spent on Fishing Trips | 2,376,820 | 5,732,864 | 8,109,684 |
Canadians fishing outside their home jurisdictions chose B.C. tidal waters 23.2% of the time with Ontario a close second at 21.7%. Ontario accounted for 25.6% of nonresident Canadian days spent on trips while B.C. freshwater placed second with 18%.
Ontario accounted for 75% of all nonresident, non-Canadian anglers' trips, 69% of their days spent in Canada and 76% of their days fished. The second most popular area was B.C tidal waters with percentages of 7.1% of all trips, 10.1% of all days spent and 6.6% of days fished. More than 8 million nights were spent on overnight trips for fishing in 1995 with 70.6% of these nights accounted for by non-Canadian anglers.
Expenditures and Investments
A considerable amount of economic activity is generated by those who go fishing as a recreational pursuit. While expenditures alone do not provide an accurate measure of the economic value of the fishery, they do indicate the direct economic impact of recreational fishing.
In 1995, anglers spent $2.5 billion on goods and services directly related to their angling activities (Table 8). Resident anglers spent $1.75 billion of this amount, or $533 per angler. Canadian nonresidents spent $124 million, or $666 per angler, and foreign nonresidents spent $655.7 million, for an average of $875 per angler. The breakdown of expenditures shows that Ontario accounts for approximately 40.6% of all expenditures followed by Quebec at 22.8%, B.C. tidal waters at 11.1% and B.C. freshwater at 8.7%.
| Expenditure | Resident | Nonresident Canadian | Nonresident Non-Canadian | Total |
|---|---|---|---|---|
| Food and Lodging | 591,355,168 | 43,494,958 | 226,386,736 | 861,236,862 |
| Transportation | 695,348,968 | 35,688,538 | 107,520,378 | 838,557,884 |
| Fishing Services | 127,080,678 | 9,177,966 | 51,400,294 | 187,658,938 |
| Fishing Supplies | 164,161,883 | 6,284,340 | 23,122,652 | 193,568,875 |
| Packages* | 155,585,132 | 27,940,868 | 242,035,596 | 425,561,596 |
| Other | 18,889,866 | 1,083,326 | 5,195,749 | 25,168,941 |
| Total | 1,752,421,695 | 123,669,996 | 655,661,405 | 2,531,753,096 |
| Average Per Active Angler | 533.33 | 665.51 | 875.42 | 599.85 |
Ontario residents account for 33.1% of all expenditures by resident anglers followed by Quebec at 30.6%. Nonresident Canadians favoured British Columbia with 35.5% of their total direct expenditures allocated to fishing in tidal waters and another 16% to fishing elsewhere in the province. Nonresident non-Canadians spent an overwhelming 65.5% of their direct expenditures in Ontario.
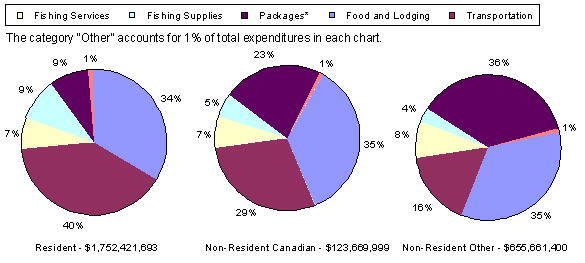
Food, lodging, transportation and package deals accounted for 82% of expenditures made by resident anglers (Figure 3), while nonresident Canadians and foreign anglers spent 87% of their expenditures on these items.
Figure 3: Proportion of Expenditures Attributable to Recreational Fishing

Visiting foreign anglers purchased fishing packages worth $242 million (almost 57% of all packages) or 37% of their expenditures (Table 8). Ontario received 41.8% of these expenditures in packages, Quebec 23.6% and B.C. tidal water 18.3%.
An expenditure component of major importance is the money anglers spend for durable goods in support of their fishing activities. In 1995, anglers invested over $4.8 billion in boats, motors, camping gear, special vehicles and other durable goods (Table 9).
| Purchase | Resident | Nonresident Canadian | Nonresident Non-Canadian | Total |
|---|---|---|---|---|
| Fishing Equipment | 248,784,695 | 4,337,515 | 6,500,673 | 259,622,884 |
| Boating Equipment | 1,016,144,574 | 15,108,117 | 10,296,425 | 1,041,549,117 |
| Camping Equipment | 431,175,923 | 3,763,008 | 2,689,433 | 437,628,363 |
| Special Vehicles | 1,848,544,322 | 4,890,644 | 3,020,001 | 1,856,454,967 |
| Land-Buildings | 1,043,946,420 | 64,947,952 | 38,433,614 | 1,147,327,986 |
| Other | 114,319,295 | 1,645,285 | 3,535,001 | 119,499,580 |
| Total | 4,702,915,229 | 94,692,521 | 64,475,147 | 4,862,082,897 |
| Average Per Active Angler | 1,431.27 | 509.57 | 86.08 | 1,151.98 |
Virtually all this investment was made by resident anglers who accounted for 96.7% of the total. Just over 38% of the monies invested in durable goods was spent on special vehicles such as ATV's. campers and other such vehicles which in recent years have become extremely popular with anglers.
Ontario (29.5%), Quebec (28.4%) and British Columbia (21.5%) were the main locations for investment. Newfoundland anglers spent the highest proportion of expenditures on special vehicles, followed by New Brunswick (46%) and Quebec (44%). Only B.C. tidal water anglers spent more on boating equipment than on special vehicles.
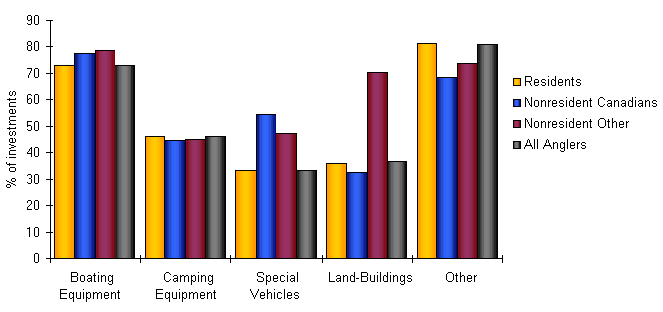
Residents indicated that 48.3% of their investment expenditures were directly related to recreational fishing activities; nonresident Canadians, 44.9%; and, other nonresidents, 72.7% (Figure 4). This adds up to $2.4 billion or 48.6% of the investments (Table 10).
| Purchase | Resident | Nonresident Canadian | Nonresident Non-Canadian | Total |
|---|---|---|---|---|
| Fishing Equipment | 248,784,695 | 4,337,515 | 6,500,673 | 259,622,884 |
| Boating Equipment | 741,404,651 | 11,686,017 | 8,115,605 | 761,206,273 |
| Camping Equipment | 198,388,985 | 1,676,828 | 1,211,010 | 201,276,823 |
| Special Vehicles | 614,813,766 | 2,670,344 | 1,428,021 | 618,912,132 |
| Land-Buildings | 375,005,235 | 21,005,442 | 27,003,826 | 423,014,502 |
| Other | 93,124,594 | 1,126,587 | 2,611,548 | 96,862,729 |
| Total | 2,271,521,926 | 42,502,734 | 46,870,683 | 2,360,895,343 |
Figure 4: Proportion of Purchases or Investments Made by Anglers in Canada, Attributable to Recreational Fishing

Overall, anglers spent a total of $7.4 billion (Tables 8 and 9) on expenditures and investments related in whole or in part to their angling activities in 1995. It is estimated that over $4.8 billion, or 66%, of these total outlays was wholly related to their angling pursuits.
Willingness to Pay
Active anglers were asked "if your fishing costs had been higher in 1995 due to increased costs for gasoline, accommodation, supplies and other services, at what additional daily cost would you have decided not to fish?".
Anglers across Canada were given choices from $1.00 to a category of "more than $100".
While over 35% of anglers indicated they were unwilling to pay any additional amount (Table 11), results showed than $10 and $20 per day were the most common responses, accounting for close to a third of all active anglers (and almost 50% of those anglers who indicated a willingness to pay more). The average daily amount indicated by residents was $16.35; by nonresident Canadians, $21.52; and, by other nonresidents, $25.77. The overall average was $17.37 per angler per day.
| Additional Cost Per Day (in Cdn. $) | Resident | Nonresident Canadian | Nonresident Non-Canadian | Total |
|---|---|---|---|---|
| No additional amount | 36.7 | 36.4 | 28.9 | 35.3 |
| Less than $10.00 | 11.7 | 7.2 | 7.1 | 10.7 |
| $10.00 | 17.9 | 14.8 | 13.7 | 17.0 |
| $20.00 | 15.0 | 13.6 | 16.2 | 15.2 |
| $30.00 | 6.1 | 6.1 | 8.0 | 6.4 |
| $40.00 | 2.8 | 2.4 | 3.5 | 2.9 |
| $50.00 | 5.5 | 9.4 | 9.6 | 6.4 |
| $60.00 | 0.7 | 0.6 | 1.5 | 0.8 |
| $70.00 | 0.5 | 1.0 | 1.4 | 0.7 |
| $80.00 | 0.5 | 0.9 | 1.3 | 0.7 |
| $90.00 | 0.1 | 0.1 | 0.3 | 0.1 |
| $100.00 | 1.7 | 4.9 | 4.6 | 2.3 |
| More than $100.00 | 0.8 | 2.6 | 3.9 | 1.4 |
| Total Additional Cost | $798,533,568 | $30,398,791 | $135,485,363 | $964,417,721 |
| Average All Active Anglers | $243.02 | $163.84 | $180.83 | $228.50 |
| Average per Day Fished | $16.35 | $21.52 | $25.77 | $17.37 |
- Date modified: