
Survey Results
5.1 Angler Profile
In 2005, over 395,000 adult anglers participated in a variety of recreational fishing activities in the Great Lakes regions at one time or another. (Annex A.1). Footnote 3 This was 16% lower than the estimate of 469,000 in 2000 (Figure 5.1). Historical data show that the number of active adult anglers has decreased at an average annual rate of 2% during the past ten years.
The majority of active anglers in 2005 were residents fishing within their home province of Ontario (over 78% of all anglers). The remaining active adult angler population consisted of nearly 4,600 Canadian non-residents (Canadians fishing outside their home province or territory) and foreign visitors to Ontario (over 82,000).
Figure 5.1 Total Active Adult Anglers, All Angler Categories, Great Lakes, 1995, 2000, 2005

Source : DFO, Economic Analysis and Statistics.
5.1.1 Resident Anglers
Resident anglers were mainly concentrated in the Lake Huron, Lake Ontario, and Lake Erie regions (Annex A.1). In fact, in decreasing order, these lakes have occupied the top three positions in number of resident anglers for each of the Great Lakes recreational fishing reports since 1995. In 2005, residents fishing on these three lakes accounted for over 90% of all active resident anglers who fished on the Great Lakes. In terms of actual numbers, however, 2005 saw less active resident anglers in all three lakes compared to 2000. Most dramatically, Lake Ontario angling numbers has dropped by more than half compared to ten years ago. In contrast, the remaining Great Lakes water bodies of Lake St. Clair, Lake Superior, and the St. Lawrence River all displayed modest increases in the number of anglers since the last Great Lakes report (Table 5.1).
| Region | 1995 | 2000 | 2005 | % change
(1995 - 2005) |
|---|---|---|---|---|
| Lake Ontario | 178,118 | 100,635 | 85,699 | -52 |
| Lake Erie | 90,691 | 68,591 | 62,684 | -31 |
| Lake St. Clair | 28,691 | 19,781 | 21,519 | -25 |
| Lake Huron | 197,488 | 159,857 | 135,389 | -31 |
| Lake Superior | 31,912 | 16,480 | 25,010 | -22 |
| St. Lawrence River | 18,702 | 17,183 | 20,175 | 8 |
| Great Lakes System | 485,096 | 336,632 | 306,901 | -37 |
Source : DFO, Economic Analysis and Statistics.
5.1.2 Canadian Non-resident and Foreign Anglers
The non-resident angler category is made up of (1) Canadian non-residents from outside Ontario; and (2) foreign anglers visiting Canada. In total, there were nearly 87,000 anglers in these two non-resident angler categories in 2005 (Table 5.2). Of this total, a mere five percent were Canadians who fished outside their own province/territory. The remainder were foreign anglers, part of the half million foreign anglers who fished recreationally within the province of Ontario.
The lower angling numbers on the Great Lakes in 2005 reflect the trend of a decrease in numbers of non-residents participating in the national recreational fishery in recent years. A reduced visiting population combined with changes in Ontario recreational fishing rules and regulations is thought to have influenced the angling numbers in 1995. Footnote 4 All things being equal, it is thought that the non-resident angling population would have been much higher in 1995 and the steady decline of non-resident anglers seen across the country would have been more apparent in the Great Lakes.
| Region | 1995 | 2000 | 2005 |
|---|---|---|---|
| Lake Ontario | 20,191 | 10,428 | 10,849 |
| Lake Erie | 4,890 | 31,287 | 10,477 |
| Lake St. Clair | 1,553 | 20,177 | 21,150 |
| Lake Huron | 21,427 | 58,948 | 26,732 |
| Lake Superior | 9,942 | 10,851 | 11,657 |
| St. Lawrence River | 12,108 | 8,115 | 9,922 |
| Great Lakes System | 67,614 | 132,496 | 86,750 |
Source : DFO, Economic Analysis and Statistics.
5.1.3 Gender and Age Profile
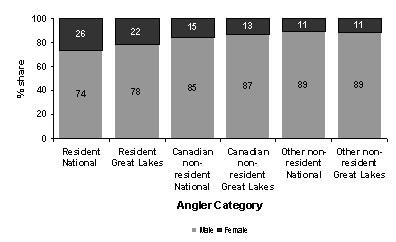
Male anglers made up 78% of resident adult anglers, 87% of Canadian non-resident anglers and 89% of all other non-resident anglers. These distributions have shown some fluctuations throughout the years but remain within comparable ranges. As expected, this gender distribution is similar to the recreational fishing population overall, i.e., on average, in every angler category, men largely outnumber women on the Great Lakes as well as nationally (Figure 5.2).
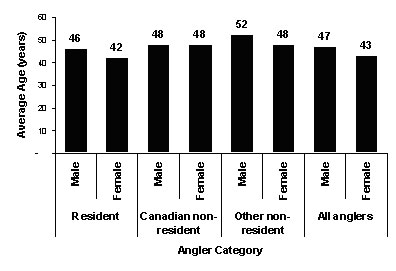
Figure 5.3 illustrates the average age of male and female active anglers. In 2005, the average male angler was 47 years old whereas female anglers were generally 43 years old, compared with 42 and 38 years respectively just five years ago. Footnote 5 These were also considerably higher than the overall 2005 average age for Canadian and Ontario males (38 and 37 years respectively) and females (40 and 38 years respectively). Footnote 6
Figure 5.2 Distribution of Active Anglers by Angler Category and Gender, Canada and Great Lakes anglers, 2005
Source : DFO, Economic Analysis and Statistics.
Figure 5.3 Average Age of Active Anglers, by Angler Category and Gender, Great Lakes anglers, 2005
Source : DFO, Economic Analysis and Statistics.
5.2 Fishing Effort
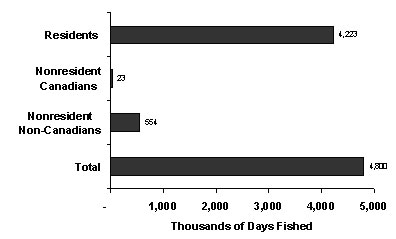
Given its direct correlation with the number of active anglers, the total number of days spent fishing has also seen a decline over the past 10 years with resident anglers. In 2005, anglers fished a total of 4.8 million days in the Great Lakes regions, 88% of which were days fished by resident anglers.
Ontario anglers accounted for about 4.2 million days fished on the Great Lakes in 2005. Less than 1% of the total fishing effort on the Great Lakes (23,412 days) could be attributed to Canadians fishing outside their home province, while foreign anglers accounted for the remaining 11.5% (554 thousand days) in 2005 (Figure 5.4). In terms of the average days fished for each angler category, resident anglers fished an average of 14 days, non-resident Canadians just over 5 days and foreign anglers averaged about 7 days each.
Figure 5.4 Total Days Fished, by Angler Category, Great Lakes, 2005
Source : DFO, Economic Analysis and Statistics.
Even with the lull in angling numbers for the 1995 season, non-resident anglers are the only group that displayed a consistent average number of days fished (7) for the last 10 years. Both resident angling numbers and overall average days fished has changed, albeit marginally, for each report since 1995. This suggests that although the number of people actively involved in a recreational fishing activity has decreased over the years, the people who remain active in recreational fishing appear to be applying a similar amount of effort.
5.3 Harvest
5.3.1 Fish Caught and Retained
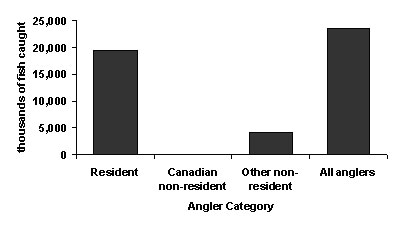
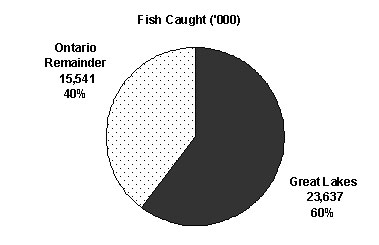
Anglers caught 23.6 million fish of all species (Annex A.5) and retained close to 7.1 million on the Great Lakes in 2005 (Annex A.9). Resident anglers caught over 82% (19.5 million) of this total harvest. Foreign anglers caught 4.1 million (17%) while the comparatively small Canadian non-resident fishing effort in the Great Lakes was reflected in their total harvest. A mere 86 thousand fish, less than 1% of the total fish harvest, were caught by Canadian residents from outside Ontario (Figure 5.5 and Annex A.3).
Resident anglers kept 30% of the fish they caught on the Great Lakes compared with 28% and 31% by Canadian non-resident and foreign anglers respectively. On average, each resident angler kept 19 fish in 2005. Every Canadian non-resident angler kept an average of five fish, while foreign anglers retained an average of 16 fish of various species.
Figure 5.5 Total Fish Harvest, All Species, by Angler Category, Great Lakes, 2005
Source : DFO, Economic Analysis and Statistics.
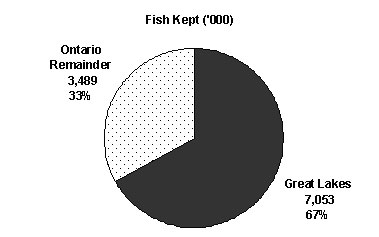
Overall, those anglers who fished in any Great Lakes region had a greater proportion of fish caught in those regions than any other area in the province of Ontario; 60% of the total catch by all angling groups came from the six major Great Lakes waterbodies. Fish were also taken from the Great Lakes at a greater rate than in other places in Ontario. Two-thirds of the catch kept by Great Lakes anglers was taken within the six defined regions (Figure 5.6).
The Great Lakes were by far the favourite fishing area for foreign anglers in Ontario since 75% of the fish caught and 80% of the fish kept by foreign anglers in Ontario occurred in the Great Lakes.
Figure 5.6 Fish Caught and Kept by Great Lakes Anglers, All Species, Great Lakes and Remainder of Ontario, 2005
Source : DFO, Economic Analysis and Statistics.
5.3.2 Species Profile
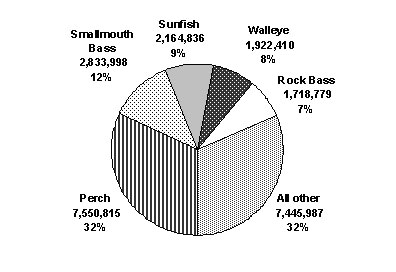
- The top five species caught in each of the three angler categories have not changed significantly over the last 10 years. Although its popularity dropped somewhat in 2000, perch was once again responsible for over 30% of the fish caught in the Great Lakes regions in 2005 (Figure 5.7), followed by smallmouth bass, sunfish, walleye, and rock bass.Combined totals for these other species (36%) just surpassed the total for perch. Only in Lake Huron (smallmouth bass) and Lake Superior (brook trout) was perch not the number one fish taken from the water (Table 5.3).Perch was so popular in the Lake Erie and Lake St. Clair regions, it outnumbered the second most harvested fish by a margin of almost five to one.
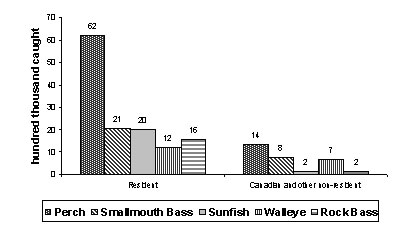
With these overall totals, it isn’t surprising that perch is the most common species harvested by all three angler groups (Figure 5.8). In fact, residents caught perch at a 3:1 ratio to smallmouth bass, the second most harvested species by residents. Lake Superior and Lake Huron were the two major waterbodies to sway from the perch trend set by the other lakes. All three angling groups harvested smallmouth bass more often in Lake Huron than any other species. Non-residents in general preferred walleye in Lake Superior while brook trout comprised the majority of fish caught by residents in Superior.
Figure 5.7 Total Fish Harvest, Selected Species, Great Lakes Regions, 2005
Source : DFO, Economic Analysis and Statistics.
It is clear that perch is the most common fish harvested in 2005 mainly due to its ubiquiity in the Great Lakes regions. However, massive harvest and retention numbers don’t necessarily dictate an angler’s desire for a particular species. For instance, among all angler groups, smallmouth bass is the second most numerous fish kept from the Great Lakes. However, given the high catch numbers of the species, it only translates into a very low percentage kept ratio, as low as 2% among non-resident Canadians and 16% overall. Thus there is a high catch and release rate among “sporty” fish like smallmouth bass.
| Region | Species 1 | Species 2 | Species 3 |
|---|---|---|---|
| Lake Ontario | perch | crappie | sunfish |
| Lake Erie | perch | sunfish | smallmouth bass |
| Lake St. Clair | perch | walleye | smallmouth bass |
| Lake Huron | smallmouth bass | rock bass | perch |
| Lake Superior River | brook trout | walleye | pike |
| St. Lawrence | perch | smallmouth bass | sunfish |
| Total | perch | smallmouth bass | sunfish |
Source : DFO, Economic Analysis and Statistics.
Walleye, on the other hand, didn’t place any higher than third in numbers caught among any angling group but was second most popular in the ratio of fish kept to perch, first among non-resident Canadians (52% of the fish caught were not returned to the water) and 42% overall, only five percent behind perch. This was in spite of the fact that perch was four times more common in terms of overall catch numbers and nearly 4.5 times more perch were kept than walleye. The species least favoured both in terms of catch and retention was sturgeon, registering zero kept fish.Figure 5.8 Total Fish Harvested by Resident and Non-resident Anglers, Top Species Caught, Great Lakes Regions, 2005
Source : DFO, Economic Analysis and Statistics.
5.4 Direct Recreational Fishing Expenditures
5.4.1 Total Direct Expenditures
All anglers spent a total of $215 million in direct recreational fishing expenditures on the Great Lakes in 2005 (Annex A.17). In current dollar terms, this total has remained relatively stable over the past 10 years (Table 5.4). However, the inflation-adjusted estimates show that total direct recreational fishing expenditures decreased at an average annual rate of 2% in the past 5 and 10 year cycles.
| Year | Current (million $) | CPI1 1992=100 | Constant 1992 $ (million $) |
|---|---|---|---|
| 1995 | 220 | 104 | 211 |
| 2000 | 214 | 114 | 187 |
| 2005 | 215 | 127 | 169 |
Notes:
1 Consumer Price Index.
Source : DFO, Economic Analysis and Statistics.
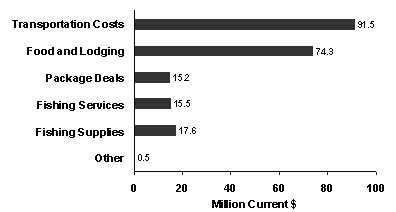
Transportation and food and lodging were the principal expenditure items of all anglers fishing on the Great Lakes in 2005 (Figure 5.9), with residents spending the bulk of the money in each category, upwards of 87% of the transportation costs. For every dollar spent on goods and services directly related to angling activities, seventy seven cents went to cover transportation and food and lodging expenses throughout 2005.
These two categories have consistently been the top direct angling expense items, with transportation being the biggest draw on expenses twice in the past three reports. Each active angler spent, on average, $231 to cover transportation costs while $188 went towards food and lodging expenses respectively during fishing trips on the Great Lakes throughout 2005.
5.4.1.1 Transportation
Transportation expenditures covered all travel-related costs within Ontario for recreational fishing including vehicle and household-owned boat costs (gas and repairs inclusive), rentals, and airfares. In 2005, the total current dollar transportation expenditures of all active anglers exceeded $91 million. Transportation expenditures increased at an average annual rate of 1% between 2000 and 2005.
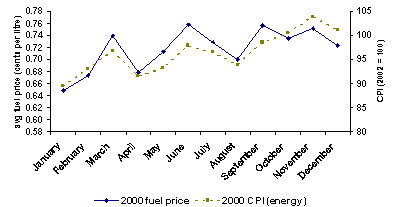
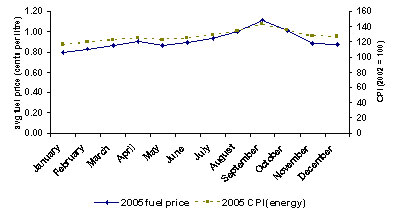
Evidently, transportation costs were directly influenced by rising fuel prices during this period. Figures 5.10a and 5.10b compare the 2000 and 2005 monthly average retail prices for gasoline and how closely fuel prices followed the patterns in the energy index.
Figure 5.9 Total Direct Recreational Fishing Expenditures, All Active Anglers, by Expense Category, Canada, 2005
Source : DFO, Economic Analysis and Statistics.
5.4.1.2 Food and Lodging
Total food and lodging expenditures ($74 million) represented just over one-third of the total direct recreational fishing expenditures on the Great Lakes in 2005. On average, an active angler paid $188 to cover food, lodging and accommodation expenses.However, the average per angler cost varies dramatically among angler categories and Great Lakes regions. For example, a foreign angler fishing on Lake Huron spent over $426 (on average) to pay for food, lodging and accommodations in 2005, while non-resident Canadians spent an average of $34 on the same expenses while fishing on Lake Superior in 2005.
Lodging expenses for non-Canadian anglers who fished on the Great Lakes was marginally higher than expenses for food.Canadian residents were a little more polarized in their spending as nearly twice as much money was spent on food than lodging, which is expected as the recreational fishing activities of residents are much more likely to be in the form of day trips.
Figure 5.10a Average Retail Prices for Gasoline (cents per litre) and Energy Consumer Price Index (CPI), by Month, Ontario, 2000
Source : DFO, Economic Analysis and Statistics.
Figure 5.10b Average Retail Prices for Gasoline (cents per litre) and Energy Consumer Price Index (CPI), by Month, Ontario, 2005
Source : DFO, Economic Analysis and Statistics.
5.4.1.3 Package Deals
Total expenses on package deals reached $15 million in 2005. Package deals often include a wide range of goods and services such as food, lodging, transportation, fishing supplies, equipment, etc., with the objective of making it easier for anglers to plan their fishing trips, in exchange for a certain price.
Package deals have remained relatively consistent over the years with respect to the portion of direct expenditures for which they account, ranging from a high in 1995 of 7.5% to the most recent ratio of 7.1% of the total expenditures in 2005. The total amount of package money spent in 2005 increased by 8%, boosted mainly by a large increase in spending in the Lake St. Clair and Lake Superior regions. The average spent per angler jumped from $320 in the previous survey to just over $400 in the current study. All lakes, with the exception of Lake Huron saw an increase in the average spent per angler on packages. All of these increases come despite the fact that spending on half of the individual water bodies actually decreased compared to 2000 (Table 5.5).
| Region | 1995 | 2000 | 2005 |
|---|---|---|---|
| Lake Ontario | 1448 | 1541 | 1369 |
| Lake Erie | 66 | 2284 | 1743 |
| Lake St. Clair | 24 | 691 | 1272 |
| Lake Huron | 13215 | 7581 | 5925 |
| Lake Superior | 1207 | 1311 | 4123 |
| St. Lawrence River | 578 | 677 | 765 |
Source : DFO, Economic Analysis and Statistics.
5.4.1.4 Fishing Services, Fishing Supplies and Other Direct Recreational Fishing Expenditures
Expenditures on fishing services, covering boat rentals and guide services as well as licence and access fees, summed up to approximately $16 million in 2005. When measured against the total direct recreational fishing expenditures, this represents a 2 percent decrease in these expenses from 2000 where 9% of the total expenses were dispensed in this category.
Money allotted to fishing services was dominated by spending in the Huron, Ontario and Erie Great Lakes regions; these three lakes make up over 71% of total fishing services expenditures. Although there was some variation by region in the distribution of expenditures for each individual category, licence fees dominated spending overall making up half the spending among all fishing services.
Expenses related to purchases of lures, lines, tackle, bait, and other fishing supplies totalled $18 million in 2005 (or 8% of total direct expenditures). Resident anglers across the Great Lakes regions spent a relatively higher proportion of their fishing expenditures on fishing supplies (as high as 15% for resident anglers on the St. Lawrence River), in comparison with non-resident anglers. In general, non-resident Canadian and other anglers spent approximately 4% of their total fishing expenditures on these supplies.
5.5 Major Purchases and Investments
In 2005, anglers invested $413 million on the Great Lakes in boats, motors, camping gear, special vehicles, real estate and other durable goods related to their recreational fishing activities (Annex A.13a). Of this total, an estimated $228 million was directly or wholly attributable to recreational fishing (Annex A.13b). Unlike spending in the direct recreational fishing category, total recreational fishing investments have increased steadily in current dollars since 1995. In constant dollars, however, that total has actually decreased compared to results from five years ago (Table 5.6).
| Year | Current (million $) | CPI1 1992=100 | Constant 1992 $ (million $) |
|---|---|---|---|
| 1995 | 284 | 104 | 273 |
| 2000 | 390 | 114 | 342 |
| 2005 | 413 | 127 | 326 |
Notes:
1 Consumer Price Index.
Source : DFO, Economic Analysis and Statistics.
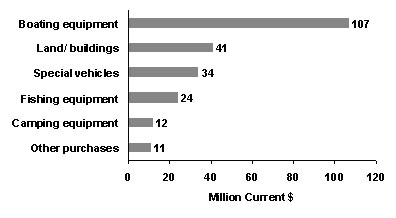
Boating equipment alone accounted for nearly half of the $228 million investments wholly attributable to recreational fishing. This was followed by investments on land and buildings ($41 million) and vehicles ($30 million). The remaining 20% was dedicated to major purchases of fishing equipment and other miscellaneous investments (Figure 5.11).
Figure 5.11 Major Purchases and Investments Wholly Attributable to Recreational Fishing, by Investment Category, Great Lakes, 2005
Source : DFO, Economic Analysis and Statistics.
Investment activities by resident anglers essentially determined the general profile of investments related to recreational fishing, as their investments represented $213 million or 93% the overall total in 2005 (Annex A.10b).
Non-resident Canadians and foreign anglers invested $147 thousand and $15 million, respectively, in 2005. Investment spending priorities by both of these angler categories differed in 2005; non-resident Canadians invested the majority of their money on fishing equipment while the bulk of funds were invested in land and buildings by foreign anglers.
- Date modified: