
Federal Aquaculture Act
Engagement
Spring - Summer 2019
On this page
1 Sector context
Aquaculture in Canada
- Canada generates an average of 178,046 tonnes of aquaculture product worth >$1 billion/year
- the Canadian aquaculture sector has the potential to nearly double production by 2028
- there are approximately 45 different species of finfish, shellfish and marine algae commercially cultivated in Canada, with salmon, mussels, oysters, and trout making up over 85% of volume
- aquaculture represents approximately a third of Canada’s total seafood value and 20% of total production
- finfish (primarily salmon) continues to account for the majority of production with about 80% of total volume and about 93% of total value

Long description
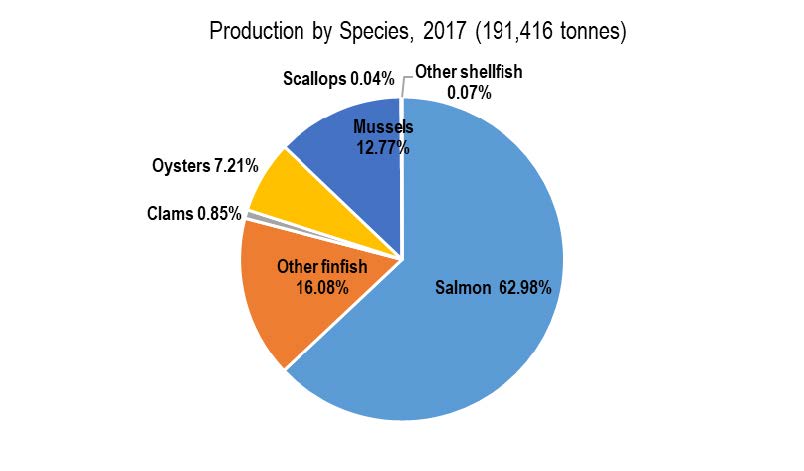
Aquaculture in Canada, production by species and by province, 2017
- Pie chart showing aquaculture production by species in 2017. A total of 191,416 tonnes were produced. The chart shows that 82.98% of the total was salmon, 16.08% was other finfish, 12.77% was mussels, 7.21% was oysters, 0.85% was clams and 0.07% was other shellfish.
- Pie chart showing aquaculture production by province in 2017. A total of 191,416 tonnes were produced. Pie chart shows 51% of this total was produced in BC, 13% was produced in New Brunswick, 13% in Prince Edward Island, 12% in Newfoundland and Labrador, 7% in Nova Scotia, 3% in Ontario and 1% in Quebec.
Source: Statistics Canada. Table 32-10-0107-01 Aquaculture, production and value
Note: Production values for Manitoba, Saskatchewan and Alberta were suppressed to meet confidentiality requirements of Statistics Canada.
Aquaculture by indigenous peoples
- in Canada, about 50 Indigenous communities are directly involved in commercial aquaculture production
- indigenous partners are engaged in all aspects and their role in aquaculture management is evolving
Long description
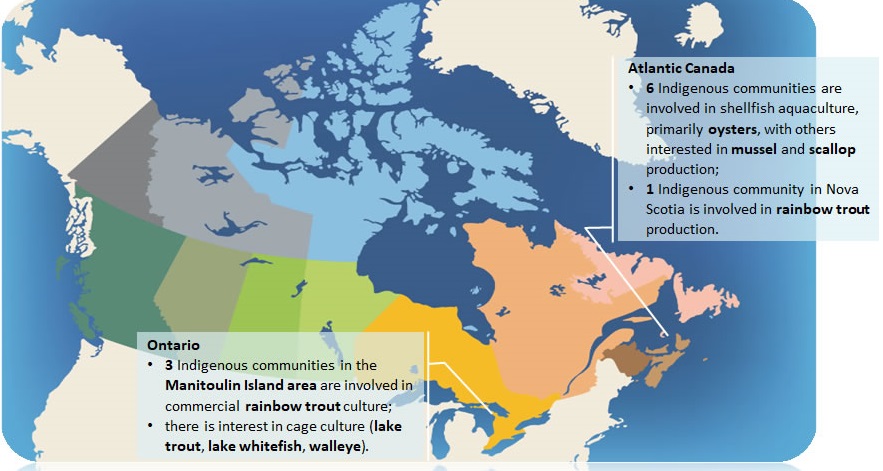
Indigenous aquaculture in Ontario and in Atlantic Canada
In Atlantic Canada, 6 Indigenous communities are involved in shellfish aquaculture, primarily oysters, with others interested in mussel and scallop production, 1 Indigenous community in Nova Scotia is involved in rainbow trout production.
In Ontario, 3 Indigenous communities in the Manitoulin Island area are involved in commercial rainbow trout culture, there is interest in cage culture (lake trout, lake whitefish, walleye).
British Columbia
- 17 Indigenous communities have partnership or protocol agreements in place related to salmon or sablefish aquaculture
- 32 Indigenous communities are currently involved in commercial shellfish aquaculture (oysters, clams), with interest growing in manila clams and geoduck
Atlantic Canada
- 6 Indigenous communities are involved in shellfish aquaculture, primarily oysters, with others interested in mussel and scallop production
- 1 Indigenous community in Nova Scotia is involved in rainbow trout production
Ontario
- 3 Indigenous communities in the Manitoulin Island area are involved in commercial rainbow trout culture
- there is interest in cage culture (lake trout, lake whitefish, walleye)
Canadian aquaculture regulatory framework
Long description
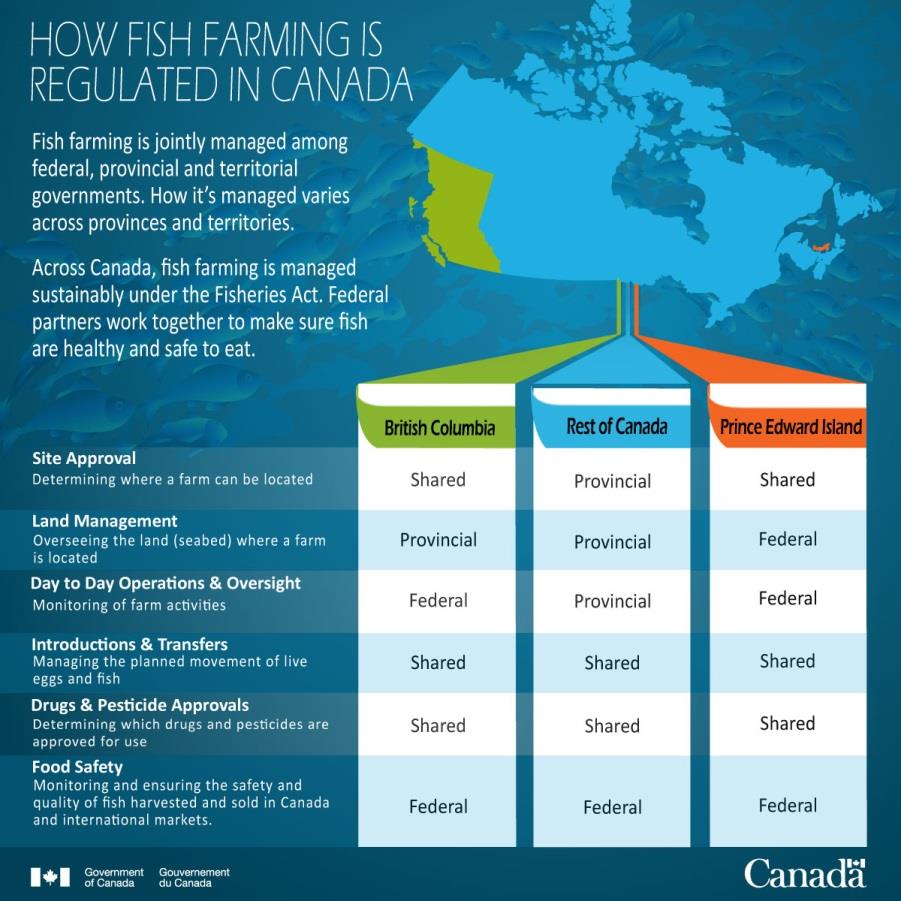
How fisheries farming is managed in Canada.
Fish farming is managed by federal, provincial and territorial governments.
How it’s managed varies across provinces and territories.
Management of site approval (determining where a farm can be located) is shared in British Columbia and Prince Edward Island. It is managed provincially in the rest of Canada.
Land management (overseeing the land/seabed where a farm is located) is shared in Prince Edward Island, and managed provincially in the rest of Canada.
Day to day operations and oversight (monitoring of farm activities) is managed federally in British Columbia and Prince Edward Island. It is managed provincially in the rest of Canada.
Introductions and transfers (managing the planned movement of live eggs and fish) is shared in all of Canada.
Drugs and pesticide approvals (determining which drugs and pesticides are approved for use) is a shared management activity in all of Canada.
Food safety (monitoring and ensuring the safety and quality of fish harvested and sold in Canada and international markets) is managed federally in all of Canada.
- fish farming is managed by federal, provincial and territorial governments
- how it’s managed varies across provinces and territories
2 Background on the act
How we got here
- June 2016: Standing Senate Committee on Fisheries and Oceans (SCOFO) tabled a report “An Ocean of Opportunities: Aquaculture in Canada”
- February 2017: Prime Minister announces the Working Group of Ministers on the review of laws, policies and operational practices as one step towards advancing reconciliation with Indigenous peoples
- June 2017: Canadian Council of Fisheries and Aquaculture Ministers (CCFAM) asked federal and provincial officials to study existing federal and provincial legislation
- Fall 2017-Spring 2018: Previous engagement sessions
- Fall 2018: TBS Regulatory Review of the Agriculture and Agri-food Sector
- December 2018: CCFAM agreed to the development of an approach to federal aquaculture legislation with limited scope that respects federal, provincial and territorial jurisdiction and provides greater clarity to the sector
On the path to reconciliation
- in May 2016, the Minister of Indigenous and Northern Affairs announced Canada is now a full supporter, without qualification, of the United Nations Declaration on the Rights of Indigenous Peoples (UNDRIP)
- the Government of Canada is committed to achieving reconciliation with Indigenous peoples through a renewed, nation-to-nation, government-to-government, and Inuit-Crown relationship based on recognition of rights, respect, co-operation, and partnership as the foundation for transformative change
- the Government of Canada will work closely with Indigenous partners to:
- co-develop engagement tools
- discuss the purpose, timing and scope of any potential legislation
What we heard from previous engagement
- DFO conducted nearly 34 sessions across Canada, 18 meetings included Indigenous groups (Fall 2017 - Spring 2018)
- Additional feedback on aquaculture management was received through the Treasury Board Secretariat of Canada (TBS) Regulatory Review of the Agriculture and Agri-food Sector (Summer 2018)
- Overall, feedback indicated support for an Aquaculture Act to:
- increase legislative and regulatory coherence
- create a more effective framework for managing risks
- support Indigenous involvement and rights in the aquaculture sector
- support innovation, growth and overall sector competitiveness
- reduce undue compliance costs
Rationale for an act
Why an aquaculture act?
- Federally, aquaculture in Canada is mainly governed under the Fisheries Act; however, this legislation was originally designed for wild capture fisheries.
- An aquaculture-specific Act will:
- use a holistic and environmentally sustainable approach to support the continuous improvement of aquaculture management in Canada
- help foster greater national regulatory consistency
- create long-term conditions for the development of a thriving and competitive aquaculture sector that benefits the economic development of rural, coastal and Indigenous communities
Act vs. regulations
- acts and regulations often have similar sounding titles and deal with the same subjects, but they are quite different
- an Act is a law made by Parliament. A draft Act, called a bill, is introduced to Parliament and requires the assent of the House of Commons, Senate and the Crown to become law
- regulations are made under the authority of an Act and define the application and enforcement of that Act. They are made by the body to whom the authority to make regulations has been given in the Act, such as the Governor in Council or the relevant minister
3 Engagement discussion
Considerations for new act
- the new Act will outline the scope and authorities for aquaculture management in Canada
- in order to be implemented and enforced, an Act needs to provide rules, requirements and authorities, including authorities to make regulations
- while the authorities will apply across Canada, the regulations made under may be more geographically restricted, such as to jurisdictions that do not already have similar authorities
- take steps to advance reconciliation with Indigenous peoples, guided by the Principles Respecting the Government of Canada’s Relationship with Indigenous Peoples
From our various discussions with Canadians, we will:
- define the term aquaculture in legislation
- recognize the need for clarity and stability for responsible economic growth of the aquaculture sector
- ensure environmental protections enshrined in the Fisheries Act are included and specific to aquaculture
- develop enforcement mechanisms specific to aquaculture
- respect provincial and territorial jurisdictions
- respect roles and responsibilities articulated in treaties and other rights reconciliation arrangements
Proposed sections for the act
Further development of act structure and content will take place after consultations conclude and we have analyzed all input received.
Preamble and purpose
- the “preamble” section would explain the underlying philosophy of the Act.
- the “purpose” section would explain what the act is trying to achieve
Scope
- the “interpretation” section would contain definitions of terms used in Act to that are critical to the interpretation of its clauses
- the “application” section would define what is subject to the Act
Agreements,programs, and projects
- this section usually lays out the various authorities for administrative arrangements, such as entering into agreements with provinces, territories, Indigenous governing bodies and bodies established under land claims agreements; and funding for grants, loan contributions, etc
Zoning
- this section would provide the authority to designate areas for the culturing of aquatic organisms, such as finfish, shellfish, and other aquatic plants
Regulations
- this section would contain most of the regulation-making authorities under the Act
- it would also provide the authority to incorporate standards into regulations
Leases, licenses and fees
- this section would provide the authorities for issuing and cancelling leases and licenses and under what conditions, as well as the authority to set fees for those leases and licenses
- the scope of application of the authorities (e.g., geographically) would be spelled out in regulations made under the Act
Environmental management
- this section would provide:
- the authorities and prohibitions related tofish habitat protection and the deposit of deleterious substances; and
- the authorities to require plans and other information from industry to betterassess impacts of proposals.
Reporting requirements
- this section would provide the authorities to require proponents to recordand provide data on aspects of their operations
Offences,punishment, ticketing
- this section would contain provisionson aquaculture-specific offences, their punishment, and the authorities to apply penalties and forfeitures,issues tickets, etc
Enforcement
- this section would provide authorities to designate enforcementpersonnel and provide them with defined powers to investigate, search, seize, etc.
4 Timelines
- engage Canadians Spring - Summer 2019
- Prepare “What We Heard” report in early 2020
- engagement expected to resume in early 2020
- plan to begin drafting new bill in mid-to-late 2020
- royal Assent of Aquaculture Act expected as early as 2022
- maintain ongoing dialog with provincial, territorial and Indigenous partners, and industry and other key stakeholders
Further information/provide feedback
- additional information, including this presentation, is available online.
- e-mail comments/suggestions by December 21, 2019 to: AquacultureConsultations.XMAR@dfo-mpo.gc.ca
- Date modified: