
Regulating and monitoring British Columbia’s marine finfish aquaculture facilities 2011–2014
Table of Contents
- Summary of marine finfish aquaculture in British Columbia
- How aquaculture facilities are regulated
- Assessing compliance
- Reporting requirements and reports submitted
- Monitoring and audits: Fish health
- Monitoring and audits: Environmental
- Monitoring and audits: Inventory and aquaculture statistics
- Summary
Reporting requirements and reports submitted
Overall reporting requirements
Licence holders are required to submit to DFO reports that fall into two broad categories: scheduled reports and incident reports. All reports are reviewed by DFO to validate content, ensure that they contain all elements required by the licence conditions, and determine if they were submitted on time. When a report contains only minor administrative omissions or errors, and if the licence holder corrects these in a timely manner, the reports may be considered complete and on time.
Scheduled reports
Scheduled reports are submitted on a predetermined schedule (monthly, quarterly or annually):
- inventory plans
- stock transfers
- sea lice
- mortality by cause
- escapes (2011–2012)
- use of lights
- use of chemicals, feed and other substances
- Annual Aquaculture Statistical Report (AASR)
Figure 8 summarizes the scheduled reports submitted to DFO from 2011 to 2014 and shows how many were complete and on time.
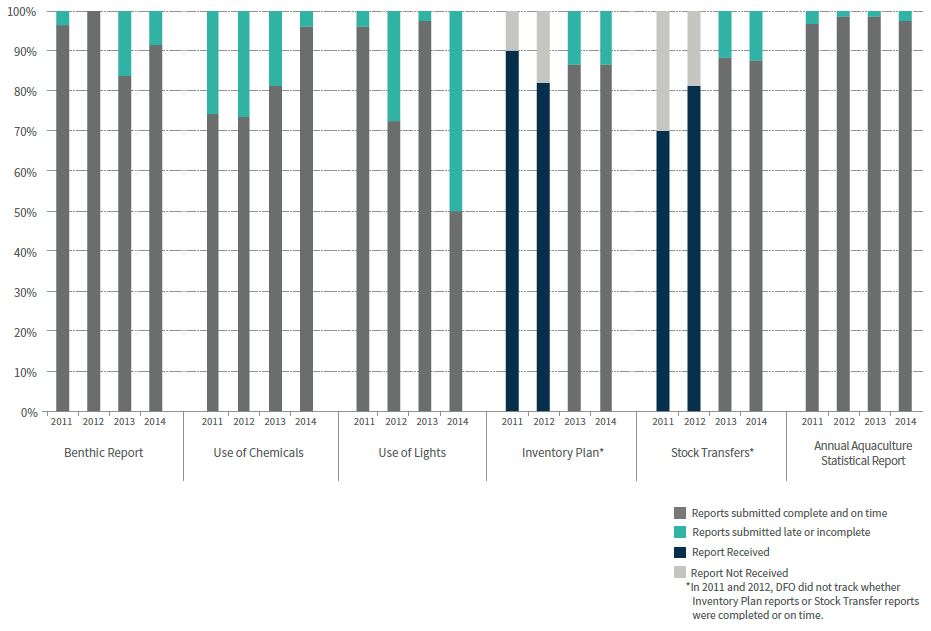
Figure 8. Scheduled Reports Submitted to DFO, 2011–2014 - Table version
| Report | Year | Reports submitted complete and on time | Reports submitted late or incomplete | Report Received | Report Not Received |
| Benthic Report | 2011 | 53 | 2 | ||
| 2012 | 51 | 0 | |||
| 2013 | 31 | 6 | |||
| 2014 | 43 | 4 | |||
| Benthic Report Total | 178 | 12 | |||
| Use of Chemicals | 2011 | 89 | 31 | ||
| 2012 | 88 | 32 | |||
| 2013 | 74 | 17 | |||
| 2014 | 70 | 3 | |||
| Use of Chemicals Total | 321 | 83 | |||
| Use of Lights | 2011 | 117 | 5 | ||
| 2012 | 89 | 34 | |||
| 2013 | 120 | 3 | |||
| 2014 | 48 | 48 | |||
| Use of Lights Total | 374 | 90 | |||
| Inventory Plan* | 2011 | 9 | 1 | ||
| 2012 | 108 | 24 | |||
| 2013 | 104 | 16 | |||
| 2014 | 104 | 16 | |||
| Inventory Plan* Total | 208 | 32 | 117 | 25 | |
| Stock Transfers* | 2011 | 7 | 3 | ||
| 2012 | 107 | 25 | |||
| 2013 | 106 | 14 | |||
| 2014 | 105 | 15 | |||
| Stock Transfers* Total | 211 | 29 | 114 | 28 | |
| Annual Aquaculture Statistical Report | 2011 | 118 | 4 | ||
| 2012 | 121 | 2 | |||
| 2013 | 118 | 2 | |||
| 2014 | 112 | 3 | |||
| Annual Aquaculture Statistical Report Total | 469 | 11 | |||
| Grand Total | 1761 | 257 | 231 | 53 | |
Reporting requirements and reports submitted: Incident reports
Incident reports are submitted following specific incidents or events identified in the licence conditions:
- benthic monitoring
- escapes
- marine mammal drownings
- marine mammal authorized predator control activities
- incidental catch
- urgent notification and follow up reports
- alternate cage array use
For specific reporting timelines and detailed requirements for each report listed above, please refer to the Marine Finfish Conditions of Licence.
Tables 1 to 5 summarize the number of incidents that were reported to DFO in 2011–2014:
- Table 1 – Escapes
- Table 2 – Incidental Catch
- Table 3 – Marine Mammal Drownings
- Table 4 – Authorized Predator Control
- Table 5 – Fish Health Events
Table 1. Incident reports – Escapes
| Year | Number of Incidents | Number of Escaped Fish |
|---|---|---|
| 2011 | 1 | 12 |
| 2012 | 4 | 2,754 |
| 2013 | 1 | 200-300 |
| 2014 | 0 | 0 |
Table 2. Incident reports – Incidental catch
| Year | Number of Incidents | Incidental Catch Quantity |
|---|---|---|
| 2011 | 52 | 11,712 |
| 2012 | 50 | 19,135 + 2.55 tFootnote 1 |
| 2013 | 30 | 26,850 |
| 2014 | 21 | 19,343 |
Table 3. Incident reports – Marine mammal interactions: Drownings
| Year | Number of Incidents (Marine Mammals Drowned) |
|---|---|
| 2011 | 8 |
| 2012 | 20 |
| 2013 | 4 |
| 2014 | 13 |
Table 4. Incident reports – Marine mammal interactions: Authorized predator control
| Year | Number of Incidents (Marine Mammals Killed) |
|---|---|
| 2011 | 294Footnote 2 |
| 2012 | 9 |
| 2013 | 3 |
| 2014 | 2 |
Table 5. Incident reports – Fish health events
| Year | Number of Incidents | Type and Number of Reported Fish Health Events |
|---|---|---|
| 2011 | 12 | Harmful algae (9) Low dissolved oxygen (3) |
| 2012 | 18 | Harmful algae (11) Low dissolved oxygen (4) Infectious disease (1) Non-infectious disease (1) OtherFootnote 3 |
| 2013 | 2 | Low dissolved oxygen (1) Other environmental (1) |
| 2014 | 21 | Harmful algae (9) Low dissolved oxygen (5) Non-infectious disease (4) Bacterial disease (1) Maturation (1) Unknown (1) |
- Date modified: