
The Scotian shelf: an atlas of human activities
Co-editors
Heather Breeze
Tracy Horsman
Maps
Tracy Horsman
Heather Breeze
Stanley K. Johnston
Layout and Design
Francis Kelly
Writers
Heather Breeze
Scott Coffen-Smout
Derek Fenton
Tim Hall
Glen Herbert
Tracy Horsman
Paul Macnab
David Millar
Peter Strain
Philip Yeats
All rights reserved. No part of this information (publication or product) may be reproduced or transmitted in any form or by any means, electronic, mechanical, photocopying, recording or otherwise, or stored in a retrieval system, without prior written permission of the Minister of Public Works and Government Services Canada, Ottawa, Ontario, Canada K1A 0S5 or at Copyright.Droitdauteur@communication.gc.ca.
- Cat. No.
- Fs23-483-2005
Fs23-483/2005-PDF
Fs23-483/2005E-HTML - ISBN
- 0-662-69160-1
0-662-69170-9 (PDF)
0-662-40952-3 (HTML) - URL
- Fisheries and Oceans Canada
Published by:
Oceans and Coastal Management Division
Oceans and Habitat Branch
Fisheries and Oceans Canada, Maritimes Region
P.O. Box 1006
Dartmouth, NS B2Y 4A2
fax: (902) 426-3855
e-mail: essim@mar.dfo-mpo.gc.ca
DFO/2005-816
© Her Majesty the Queen in Right of Canada, 2005
Table of contents
- Acknowledgements
- Introduction
- Reference Maps
- Jurisdictional and Political Boundaries
- Fisheries
- Introduction
- Fisheries Management Areas
- Groundfish Landings (1999-2003)
- Groundfish Landings by Gear Type (1999-2003)
- Seasonal Groundfish Landings (1999-2003)
- Cod, Haddock and Pollock Landings (1999-2003)
- Flatfish Landings (1999-2003)
- Halibut Landings (1999-2003)
- Redfish Landings (1999-2003)
- Silver Hake Landings (1999-2003)
- Herring Landings (1999-2003)
- Mackerel Landings (1999-2003)
- Bluefin Tuna Landings (1999-2003)
- Landings of Large Pelagic Species (1999-2003)
- Swordfish Landings (1999-2003)
- Albacore, Bigeye and Yellowfin Tuna Landings (1999-2003)
- Porbeagle, Mako and Blue Shark Landings (1999-2003)
- Crab Landings (All Species) (1999-2003)
- Snow Crab Landings (1999-2003)
- Crab Landings (Except Snow Crab) (1999-2003)
- Scallop Landings (1999-2003)
- Scallop Landings by Season (1999-2003)
- Offshore Clam Landings (1999-2003)
- Shrimp Landings (1999-2003)
- Offshore Lobster Landings (1999-2003)
- Special Management Areas
- Marine Traffic
- Oil And Gas Industry
- Other Activities
- Ocean Disposal And Marine Environmental Quality
Acknowledgements
Many people contributed to the development of the atlas by providing data, assisting with analyses, or reviewing the accompanying texts. The co-editors would like to thank Brian Altheim, Steve Bigelow, Christine Bonnell-Eisnor, and Eric Theriault from the Canada-Nova Scotia Offshore Petroleum Board; Pierre Chiasson, Tina Cleghorn, and Joel Richardson from the Government of New Brunswick; Andrew Kennedy, André Laflamme, Scott Lewis, Victor Li, and François Thériault from Environment Canada; Phil Moir from Natural Resources Canada; Erica deSousa from the Coastal Communities Network; Jason Cummings from ESRI (Environmental Systems Research Institute Inc.); Michael Earle and Judy Barrington from the Canadian Coast Guard; Linda Murphy from the Nova Scotia Department of Tourism, Culture, and Heritage; Alasdair Wilkie from Hibernia Atlantic; Paul Kravis from IT Telecom; Ahmed El Sakkary from Teleglobe; Ross Lee, telecommunications consultant; Bernadette MacNeil from the Sydney Ports Corporation; and Richard Parsons from the Atlantic Canada Cruise Association.
We would like to thank the many staff of Fisheries and Oceans Canada who provided information, advice or reviewed texts, including Chris Annand, Maureen Butler, Shelley Bond, Charlene Coates, Art Cosgrove, Verna Docherty, Kevin DesRoches, Christie Dyer, Michael Eagles, Mark Fowler, Jon Hansen, Erica Head, Joseph Hunt, Peter Hurley, Jim Jamieson, Chris Jones, Andrew McMaster, Bill MacEachern, Lisa Paon, Ted Potter, Dale Roddick, Andrew Smith, Tobias Spears, Greg Stevens, Reg Sweeney, Clarissa Theriault, Tammy Waechter, Gary Weber and Tana Worcester. The co-editors would especially like to thank Claire MacDonald who co-ordinated review of the fisheries information by the Fisheries and Aquaculture Management Branch.
Introduction
This atlas was prepared by the Eastern Scotian Shelf Integrated Management (ESSIM) Planning Office to show the extent of human activities on the Scotian Shelf and some of the management boundaries related to those activities. Managing multiple human activities is a major theme in the draft ESSIM Integrated Ocean Management Plan and a number of objectives set out in the plan relate to this theme. By providing information on the extent and intensity of a broad range of human activities on the shelf, it is hoped that managers, ocean users and others involved with the ESSIM initiative will have a better understanding of human activities in the offshore.
For several years, the ESSIM Planning Office has been collecting information on the location of human activities and management boundaries. However, this information was often portrayed in very different ways, covered different time periods and different geographic areas, or was in different data formats. With the atlas, our goal was to collect the most current information available from authoritative sources and present as complete a snapshot of human use on the Scotian Shelf as possible. We have not been completely successful, as complete geo-referenced data are not available for all activities. Nonetheless, we believe the picture of human activities shown here has helped us to develop a more complete view of the Scotian Shelf. In addition, the information collected and GIS layers developed to make the atlas will allow the Planning Office to develop decision-making tools for integrated management.
For most activities, the maps include information for the period 1999-2003. Choosing a consistent time period allows comparisons between activities and there is some information available for most activities for this period. However, for some activities complete information was not available or was not available in a format that we could use.
The text provided with each map includes important information which is intended to provide a better understanding of what is portrayed on the maps. Because several different people contributed to writing the descriptions there is more detail provided on some activities than others. In general, we chose to keep as much detail as was provided.
The Planning Office will continue to improve and expand the atlas as more data becomes available. Subsequent digital editions may be released in the future. If we have overlooked an important activity or are missing key management boundaries, please let us know so we can improve the atlas in the future.
Although we have made efforts to verify the information provided here, readers should be aware that the maps are intended to illustrate the location of activities and should not be used for navigational or legal purposes.
Reference Maps
Geographic Extent of Information

Geographic Extent of Information

Legend: Geographic Extent of Information
The Atlas of Human Activities contains information on the Fisheries and Oceans Canada (DFO) administrative region known as the Maritimes Region. This area includes the Scotian Shelf and adjacent slope to the full extent of Canada’s 200-nautical mile exclusive economic zone, as well as the Bay of Fundy and Canadian portions of the Gulf of Maine and Georges Bank. Within DFO, the area is also known as the Scotia-Fundy Fisheries Management Region.
This map is intended to be a reference for the rest of the document. It shows the boundaries for most of the information collected for the atlas: the regional boundary, composed of the international and exclusive economic zone boundaries and the division between the Maritimes region of DFO and the Newfoundland and Gulf regions. The latter is also the eastern boundary of the Eastern Scotian Shelf Integrated Management (ESSIM) initiative. In a few cases, we have included information from outside this area, reflecting the management boundaries used by other government departments and agencies that are active in the area. Those administrative boundaries are shown where relevant.
The inset map shows the location of the Scotian Shelf in relation to North America and the North Atlantic Ocean. The image is a composite of multiple satellite images taken in 1996 by NOAA (National Oceanic and Atmospheric Administration) weather satellites and enhanced with digital elevation data.
Topography and Geographic Names
Topography
The shape of the ocean floor influences the physical and biological marine environment, from the speed and direction of currents flowing over the ocean bottom to the distribution of marine plants and animals. This in turn influences the human activities that occur in the area. The present seafloor topography of the Scotian Shelf, Gulf of Maine and the Bay of Fundy is the result of many thousands of years of geological processes.
Compared to many other submerged continental shelf areas, the Scotian Shelf is relatively wide and extends from 125 to 230 kilometres offshore. At the shelf edge, at about 200 metres in depth, the ocean floor becomes steeper. The area from the edge of the shelf to 2000 metres in depth is known as the “slope” or Scotian Slope. From about 2000 to 5000 metres in depth, the change in depth becomes more gradual. This area is known as the “rise.” Several large submarine canyons indent the outer shelf, slope, and rise, and some smaller valleys also cross the slope and rise.

Topography and Geographic Names

Legend: Topography and Geographic Names
Although the shelf itself is relatively flat compared with the slope, there are still many obvious features. There are broad, relatively shallow and flat bank areas, and deeper areas known as basins. Two large channels - the Northeast Channel and Laurentian Channel - divide the Scotian Shelf from Georges Bank and the Newfoundland Shelf respectively. Several deep basins, such as Jordan Basin, are the notable topographic features of the Gulf of Maine.
Geographic Names
The geographic names for undersea features originate from many different sources, including the physical characteristics of the area, names used by First Nations or from First Nation languages, names of nearby features on land, and the religious beliefs of early European explorers. For example, Sable Island Bank is named for its prominent feature, the long, sandy Sable Island. The island in turn gets its name from the French word for sand, “sable.” Georges Bank was named after St. George and references to “St. Georges Bank” continued into the twentieth century (see e.g., Rich 1929). Since the late 1960s, the Advisory Committee on Names for Undersea and Maritime Features has made recommendations to the Geographical Names Board of Canada on authoritative names for undersea features within Canada’s jurisdiction (CPCGN 1988, NRCAN 2005). The standardized names are shown on the map opposite; however, different names may be in use in some areas or among certain marine users.
CPCGN (Canadian Permanent Committee on Geographical Names). 1988. Canada: Geographical Names and the United Nations, 1987. Published for the Canadian Permanent Committee on Geographical Names by the Canada Centre for Energy, Mines and Resources.
NRCAN (Natural Resources Canada). 2005. About the Geographical Names Board of Canada (GNBC). (7 April 2005).
Rich, W.H. 1929. Fishing Grounds of the Gulf of Maine. United States Bureau of Fisheries. Appendix III to the Report of the US Commissioner of Fisheries for 1929.
Jurisdictional and Political Boundaries
Canada’s Maritime Zones

Canada’s Maritime Zones

Legend: Canada’s Maritime Zones
Canada’s Oceans Act claims four maritime zones consistent with international law and practice and in accordance with the United Nations Convention on the Law of the Sea. Canada’s jurisdiction over ocean space is recognized through the declaration of the territorial sea, the contiguous zone, the exclusive economic zone (EEZ), and the continental shelf. The Oceans Act also defines areas known as fishing zones, two of which are found on the Atlantic coast.
Extending 12 nautical miles (NM) from the baselines, the territorial sea extends full sovereignty over the sea, airspace, seabed and subsoil. The contiguous zone extends 12 NM beyond the outer edge of the territorial sea and grants rights and responsibilities to prevent infringement of Canada’s customs, fiscal, sanitary, and immigration laws and regulations. In the 200-NM EEZ, Canada has sovereign rights and responsibilities with respect to the exploration and exploitation of living and non-living resources of the water column, seabed and subsoil. The EEZ also provides Canada with the responsibility and jurisdiction to protect the marine environment, to regulate scientific research, and to control offshore installations and structures. The continental shelf includes the seabed and subsoil and extends from the territorial sea to the outer edge of the continental margin or to 200 NM, from the baselines of the territorial sea, if this distance is greater. On the continental shelf, Canada may exercise its rights and responsibilities with respect to the exploration and exploitation of non-living mineral resources and sedentary species (e.g., clams) beyond the EEZ limit.
Fishing Zones 1 (the Gulf of St. Lawrence) and 2 (the Bay of Fundy) were created before the concept of the EEZ was broadly accepted in international law. In the early 1970s, Canada established closing lines for the Gulf of St. Lawrence and Bay of Fundy and claimed these areas as exclusive fishing areas.
The US-Canada maritime boundary in the Gulf of Maine at Machias Seal Island, a small, rocky mound at the mouth of the Bay of Fundy, has never been officially delimited due to the disputed sovereignty of the island. This issue was not resolved during the arbitration of the Georges Bank boundary in 1984, and as a result, both Canada and the United States claim approximately 259 square kilometres of fishing grounds around the island.
The ESSIM Planning Area

The ESSIM Planning Area

Legend: The ESSIM Planning Area
Canada’s Oceans Act gives the Minister of Fisheries and Oceans the responsibility to lead and facilitate integrated management for Canada’s oceans. The Eastern Scotian Shelf Integrated Management (ESSIM) initiative is a collaborative ocean planning process being led by Fisheries and Oceans Canada (DFO), Maritimes Region. Its primary goal is to develop an integrated ocean management plan for the ESSIM Planning Area. The Planning Area encompasses an approximately 325,000-square-kilometre portion of the Scotian Shelf and was delineated using existing administrative boundaries. The western boundary is defined by the Northwest Atlantic Fisheries Organization (NAFO) 4WX line that runs between LaHave Basin and Emerald Basin; the eastern boundary is the NAFO 4V/3PS line running through the Laurentian Channel and into the Gulf of St. Lawrence. This line also forms the eastern boundary for DFO’s Maritimes Region. More information about the NAFO areas can be found with the “Fisheries Management Areas” map and accompanying text.
Although the ESSIM initiative is addressing ocean uses that occur both offshore and in coastal waters, the focus of the initial ESSIM plan is the offshore, from the outer limit of the 12-nautical-mile territorial sea to the seaward extent of Canadian jurisdiction. This area was selected for integrated management because it possesses important living and non-living marine resources, areas of high biological diversity and productivity, and increasing levels of multiple use and competition for ocean space and resources.
Fisheries
Introduction
A variety of fishing activities occur in the Scotia-Fundy fisheries management region (the Scotian Shelf, Bay of Fundy and Gulf of Maine). Many of these activities have taken place for generations, such as fisheries for groundfish and coastal shellfish. Others are relatively new, such as fisheries for offshore clams and deep-sea crab. Many different gear types are used to catch a diversity of species, from sedentary clams to highly mobile tunas. These gears include otter trawl, seine, longline, gillnet, handline, rake, dredge, weir, trap, rod and reel, and harpoon. Vessel sizes also vary greatly, from small vessels used in coastal lobster fisheries to very large vessels used in offshore scallop and groundfish fisheries. More information on fishing gears and vessels can be found in the brochure “Atlantic Fishing Methods” published by Fisheries and Oceans Canada (1989).
Although groundfish fisheries have declined in importance over the last ten years, landings and landed value of invertebrate fisheries have increased (Fisheries and Oceans Canada 2004). The total value of commercial seafishery landings in the Scotia-Fundy region in 2003 was 788 million dollars, with more than 80 percent of that amount coming from invertebrate fishery landings (Fisheries and Oceans Canada 2005).
Management
Fisheries are managed using a combination of quotas, gear restrictions, seasons, area closures, and other restrictions related to size and other characteristics of the species sought. Different measures are used in different fisheries. For example, one fishery may use quotas while another may restrict the amount of gear that may be used. Another fishery may use both quotas and gear limits. Readers should be aware that the management measures described on the following pages are not complete and may change at any time. They should refer to integrated fisheries management plans, conservation harvesting plans, fishing license conditions, and variation orders for accurate and up-to-date information on fisheries management. Information is available through local Fisheries and Oceans Canada offices.
About the Fishery Maps
Source of information
The maps show commercial landings for the Scotian Shelf, Bay of Fundy and Georges Bank areas – NAFO Divisions 4V, 4W, 4X and the Canadian portions of 5Y and 5Z. Landings were combined for the period 1999-2003. Information on landings was taken from the ZIF (Zonal interchange format) and the MARFIS (Maritime Fishery Information System) databases. The information in these databases is maintained by Fisheries and Oceans Canada.
Methodology
For each of the maps showing fisheries landings, the Scotia-Fundy region was divided into units measuring two minutes by two minutes. At our latitude, this is approximately 3.6 kilometres (east-west) by 5.1 kilometres (north-south), with some variation. The boundaries of these two-minute cells were set to half-minute intervals so that the landings, recorded in the database at one minute intervals, are completely contained within the two-minute units. This means that landings are potentially recorded at four locations within each two-minute cell. The total landings reported for each two-minute cell for the entire five year period were summed. Thus, each sampling unit on the map may represent many fishing events that occurred over the five-year period.

Figure 1. Aggregating the fisheries landings.
Figure 1 is a fictional example showing a small portion of the Scotian Shelf divided into two-minute cells. In Figure 1a, each of the landings reported from that part of the Scotian Shelf is shown as a dot with the corresponding reported weight in kilograms beside it. In some cases, there are multiple landings corresponding to one dot, representing multiple fishing events reported for that latitude and longitude position. In Figure 1b, the sum of the landings for each rectangle is shown.
For each fisheries landings map, the two-minute cells were classified using five quantile breaks based on the sum of the landings within the cell. This means that there is the same number of cells in each category. The red cells have the highest reported landings (81-100 percentile) while the dark green cells have the lowest reported landings (0-20 percentile).
Readers should be aware that the breaks between the five different categories are different for each fishery. Thus, a red cell on one fishery map may have a much larger value than a red cell on another fishery map. For the maps showing different seasons in a fishery, quantile breaks were first assessed for the five-year period as a whole. The same divisions were then used for each season, making it possible to show how seasonal catches are distributed and how they contribute to the total annual catch.
Landings Information and Management Measures
Quantile breaks are a useful way of portraying landing and fishing effort information over the entire study area. This information cannot be used to interpret fish distribution, however, since various management regimes, which may be different across the region, will affect both fish landings and fishing effort. For that reason, we have included descriptions of some of the basic management measures for each fishery and have shown the management boundaries most commonly used in each fishery. However, other management lines and boundaries may also be used for fisheries management.
Errors and inaccuracies
The fisheries landings portrayed on maps in this section represent hundreds of thousands of reports of fishing activities. There are opportunities for errors to enter the fisheries landings databases, both reporting errors (e.g., the wrong position is recorded in a logbook or monitoring report) and data entry errors (e.g., the position is incorrectly entered into the electronic database). These errors are not surprising in a database of this size and they do not affect the general trends that are portrayed. However, as a result the reader may notice low landings reported from unlikely areas. For example, there are some sea scallop landings shown at depths of 2000 metres on the slope, a depth where there is no ongoing bottom fishery. We have not attempted to remove the landings that are probably erroneous, and the reader is encouraged to interpret the maps in light of the information on the fishery and its management that is provided.
As a further caution in interpreting the maps, only one point - one latitude and longitude position - has been used for each reported landing. However, fishing gear may cover a very large area that goes well beyond the reported position. For example, a trawler may cover several kilometres with one tow while a longliner may set a line of hooks that travels many kilometres from the starting position. At the scale of the Scotian Shelf, using only a single position to represent a fishing activity is not a big drawback. Nonetheless, the patterns shown in the subsequent maps should be considered general patterns of activity and not an absolute determination of where fishing does and does not occur.
Fisheries and Oceans Canada. 1989. Atlantic Fishing Methods. Underwater World Series. Ottawa: Communications Directorate, Department of Fisheries and Oceans.
Fisheries and Oceans Canada. 2004. Commercial Landings Seafisheries. Website. http://www.dfo-mpo.gc.ca/stats/commercial/land-debarq/sea-maritimes/s2004aq-eng.htm (16 February 2005).
Fisheries and Oceans Canada. 2005. 2003 Value of Atlantic Coast Commercial Landings, by Region. Website. http://www.dfo-mpo.gc.ca/stats/commercial/land-debarq/sea-maritimes/s2003av-eng.htm (15 March 2005).
Fisheries Management Areas

Fisheries Management Areas

Legend: Fisheries Management Areas
NAFO Divisions, Subdivisions, and Unit Areas
The Convention Area of the Northwest Atlantic Fisheries Organization (NAFO) encompasses most of the Northwest Atlantic. It has been divided into divisions and subdivisions that are used to manage most groundfisheries off Nova Scotia and New Brunswick. The Maritimes Region of Fisheries and Oceans Canada corresponding to divisions 4V, 4W, 4X and parts of 5Y and 5Z. 4VS and 4VN are subdivisions of 4V.
The boundaries of the NAFO Convention Area, Divisions and Subdivisions are based on those used by NAFO’s predecessor, the International Commission for the Northwest Atlantic Fisheries (ICNAF). The ICNAF area was originally divided into geographic units to collect fisheries statistics and track the status of fish stocks. Groundfish were the primary stocks of interest, although other species were included in the convention. A description of how these geographic areas were originally determined can be found in Halliday and Pinhorn (1991). The divisions came to be used for management and their use has spread to fisheries other than groundfish. Management measures related to invertebrate and pelagic fisheries may use the NAFO Divisions instead of or in addition to fishing areas specific to that fishery.
Smaller areas within the NAFO Divisions and Subdivisions are known as unit areas, subareas or statistical areas. For example, 4Wf is a unit area of NAFO Division 4W. The unit areas are not part of the NAFO Convention but are used by Canadian scientists and fisheries managers to track fisheries and stock status in geographic units smaller than the NAFO Divisions. The unit areas are also used for fisheries management measures.
Atlantic Fishery Regulations (1985)
The Atlantic Fishery Regulations (1985), under the Fisheries Act, provide management measures and delineate management areas for many fisheries off the Atlantic coast of Canada, from the Canada-U.S. international boundary to Ungava Bay. The NAFO Divisions are included in the regulations, as are other fishing areas, such as Herring Fishing Areas, Crab Fishing Areas, Lobster Fishing Areas, Mackerel Fishing Areas and Shrimp Fishing Areas. These fishing areas are not shown on the map opposite, but are shown on the maps pertaining to those species.
Halliday, R.G. and A.T. Pinhorn. 1990. The delimitation of fishing areas in the Northwest Atlantic. Journal of Northwest Atlantic Fishery Science 10: 1-37.
Groundfish Landings (1999-2003)

Groundfish Landings (1999-2003)

Legend: Groundfish Landings (1999-2003)
This map shows landings of the species traditionally considered to be “groundfish” including well-known commercial species such as cod, haddock, pollock, flatfishes (e.g., yellowtail, witch and winter flounders, and American plaice), silver hake, and redfish, and lesser known species such as white hake, cusk, skate, monkfish and sculpin. The map shows landings both from directed groundfish fisheries and from bycatch in other fisheries. Thus, there are very low landings from areas not known as traditional areas for the groundfish fishery, such as the slope of the shelf. Please refer to the “Introduction: Fisheries” section for more information on the portrayal of the landings.
Most groundfish are caught by mobile gear (otter trawl and other types of trawlers), with longline vessels landing the second highest proportion of the groundfish landings. The pie charts show the proportion landed by gear type in each NAFO area. Gear types that land less than 1 percent of the catch are grouped with “other.”
The management line dividing NAFO Division 4W from 4X is of great importance as directed fisheries for cod and haddock on the east side of the line - in other words, in 4W and also further east in 4V - have been closed since 1993. It is permitted to catch small amounts of these species as bycatch in the groundfish fisheries that remain open. The closure of the cod and haddock fisheries in 4VW resulted in profound changes in the industry. Many people and businesses left the fishing industry. For others, fisheries for invertebrates such as crab, scallop, and surf clam have become more important than the traditional groundfish fisheries.
In addition to the management areas shown here, time and area closures are in place for some groundfish fisheries. Some of the longer-standing time and area closures are discussed in more detail on the pages pertaining to specific fisheries.
Groundfish landings by Gear Type (1999-2003)

Groundfish landings by Gear Type (1999-2003)

Legend: Groundfish landings by Gear Type (1999-2003)
This map shows landings of the same species as the previous map; however the landings have been divided into the main gear types used in the groundfish fishery: otter trawl, longline, handline and gillnet. The same categories of landings have been used for all four maps to allow comparisons to be made.
While there is much overlap in the areas used by the different gears, there are some notable differences. Otter trawl and longline use are fairly widespread on the shelf, with the relative lack of fishing activity on the eastern shelf a reflection of the moratorium on key groundfish species in that area. Longliners make extensive use of the shelf edge and the deeper channels and have few landings from the deep basins of the central shelf. Conversely, trawlers report high landings from the central shelf basins due to the silver hake fishery carried out using that gear type in that area.
Most handline and gillnet landings are from the shelf off southwestern Nova Scotia and in the Bay of Fundy. Handline landings are grouped near the coast. Gillnet landings are more scattered, with few areas reporting landings. However, many of those areas do have relatively high landings, suggesting more effort is made in a few important areas.
Seasonal Groundfish Landings (1999-2003)

Seasonal Groundfish Landings (1999-2003)

Legend: Seasonal Groundfish Landings (1999-2003)
Groundfish are caught in all seasons of the year in the region. However, different areas are more or less important depending on the season of the year. The seasonal patterns reflect the seasonal movements of fish, management regulations, patterns of activity in other fisheries, and weather conditions. Each seasonal map uses the same categories, allowing landings from one season to be compared with another.
Some groundfish fisheries run year-round, with higher catches occuring at certain times of year. In the summer (July to September), fishing activity is relatively widespread, particularly on the western Scotian Shelf and in the Bay of Fundy where fisheries for cod and haddock are open. During the winter (January to March), groundfish fisheries on Georges Bank are closed. The landings shown on the map are bycatch from other fisheries, such as the scallop and herring fisheries; however, current regulations no longer allow these fisheries to land any groundfish bycatch. Weather conditions and ice cover restrict the fishery in 4VN (Sydney Bight and area) in winter and other areas are more important during that time of year.
The redfish fishery focuses on the main part of the Laurentian Channel through the summer and on the Laurentian Channel near the shelf edge in the fall (October to December) and winter. High groundfish landings are reported from the central shelf basins year-round, likely due to the silver hake fishery.
During the fall, relatively few landings are reported in coastal areas. There is a lobster fishery off southwestern Nova Scotia and in the Bay of Fundy that opens in the fall (mid to late November in most areas). Groundfish fishers with lobster licenses often switch to lobster at this time. This lobster fishery usually remains open until sometime in May. Off eastern Nova Scotia, including Cape Breton, there is a spring lobster fishery (usually late April or early May to the end of June) that involves fishers in that area.
Cod, Haddock and Pollock Landings

Cod, Haddock and Pollock Landings
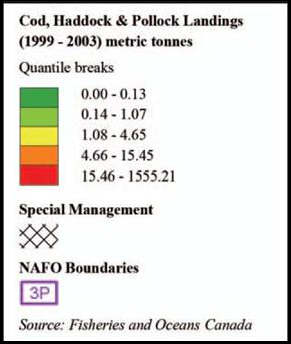
Legend: Cod, Haddock and Pollock Landings
Cod, haddock and pollock were traditionally the three groundfish species of importance caught off Nova Scotia. Landings of these species have declined in most areas in the last two decades and other species have become more important. With directed fisheries for cod and haddock closed on the eastern Scotian Shelf (NAFO Divisions 4VW)Footnote 1, landings of cod, haddock and pollock on the western Scotian Shelf are much higher than on the eastern Scotian Shelf. The pollock fishery on the eastern Scotian Shelf remains open; however, little effort is made to fish for pollock in that area due to the closures for the other two species. In many parts of the region, fishers catch these three species together. Ensuring that appropriate proportions of the three species are caught is an important concern for fishers and managers.
Fisheries for cod, haddock and pollock occur mainly on the large fishing banks and in the Bay of Fundy. The fishery is conducted using mobile gear (otter trawl) and fixed gear (longline, handline and gillnet). Parts of Browns and Georges Bank are closed at certain periods of the year to protect spawning haddock. In NAFO Division 4W, an area encompassing Western and Emerald Bank has been closed to groundfish fishing using mobile gear since 1987 and to all groundfish gears since 1993. This closure is to protect a nursery area for juvenile haddock.
There are restrictions on fishing in the Gully Marine Protected Area (MPA), the Lophelia Coral Conservation Area and the Northeast Channel Coral Conservation Area. The restrictions in the coral conservation areas are to protect cold-water coral communities, while restrictions in the Gully MPA are to protect both coral communities and other species and habitats. The location of the coral conservation areas and the marine protected area can be found on the map entitled “Special Management Areas: Marine Biodiversity.”
Flatfish Landings (1999-2003)

Flatfish Landings (1999-2003)

Legend: Flatfish Landings (1999-2003)
Several species of flatfish are managed under the same TAC (total allowable catch). In NAFO Divisions 4X5Y, these species are yellowtail flounder, American plaice, winter flounder and witch flounder (grey sole). In Divisions 4VW, the species are American plaice, yellowtail flounder, and witch flounder. On Georges Bank (NAFO Division 5Z), yellowtail flounder is the primary species caught and this stock is managed separately.
The flatfish TAC in 4VWX and 5Y has been combined because in the past, landings of the different flatfish species were not always reported separately. Landings from the four species mentioned above as well as from unspecified flounder are shown on this map. Landings reported as unspecified flounder made up 30 percent of the flatfish landings in 2002 in NAFO Divisions 4VW (DFO 2002). Comparisons with earlier logbook data indicate that these “unspecified” flounders are usually one of the four species mentioned above (Fowler and Stobo 2000).
In general, the fishing banks are important for the yellowtail and plaice fisheries, while deeper areas are more important for witch flounder. Winter flounder is uncommon on the eastern shelf and on the western shelf it is concentrated in only a few areas. Historically, the eastern Scotian Shelf (4VW) was more important than the western Scotian Shelf (4X), not including Georges Bank, for yellowtail and plaice fisheries. However, a general reduction in the groundfish fishery on the eastern shelf and a declining abundance of flatfish have resulted in low catches in the east. The yellowtail fishery on the eastern shelf has not been very active in recent years (including the years shown on the map) but was formerly concentrated on Sable Island Bank and the eastern part of Banquereau. American plaice is fished primarily in Sydney Bight and on Banquereau (DFO 2002). Farther west, Georges Bank is an important area for the yellowtail flounder fishery.
No flatfish fishing is allowed in the juvenile haddock nursery area (shown), the Lophelia Coral Conservation Area, the Gully Marine Protected Area and the Northeast Channel Coral Conservation Area (more information on the conservation areas and the marine protected area can be found with the map entitled “Special Management Areas: Marine Biodiversity”). There are also restrictions on fishing in the haddock spawning areas (shown).
G.M. Fowler and W.T. Stobo. 2000. Status of 4VW American Plaice and Yellowtail Flounder. CSAS Research Document 2000/144 (CSAS resdocs - 2000/144) .
Halibut Landings (1999-2003)

Halibut Landings (1999-2003)

Legend: Halibut Landings (1999-2003)
The halibut fishery is conducted separately from the fisheries for other flatfish. While other species of flatfish are caught mainly by mobile gear (largely otter trawl but also Danish and Scottish seine), halibut are mostly caught by bottom longline. This map shows commercial landings for the five-year period 1999-2003, but does not include landings from the commercial index survey. Survey landings total 100 tonnes or less each year over the entire survey area, which includes both the Scotia-Fundy region and the Grand Banks (Zwanenburg and Wilson 2000).
Halibut is found in deeper waters than other commercial flatfish species and the fishing grounds used are somewhat different. The deep channels and the area along the edge of the shelf have high landings. Other areas of hard bottom are also important for the fishery.
There are restrictions on fishing for halibut in the haddock spawning areas and the haddock nursery area (shown on map). As well, halibut fishing is not permitted in the Lophelia Coral Conservation Area and there are restrictions in the Northeast Channel Coral Conservation Area and the Gully Marine Protected Area (MPA). The map on “Special Management Areas: Marine Biodiversity Protection” shows the location of the conservation areas and the MPA.
Zwanenburg, K.C.T. and S. Wilson. 2000. The Scotian Shelf and Southern Grand Banks Atlantic halibut (Hippoglossus hippoglossus) survey - Collaboration between the fishing and fisheries science communities. Theme session on cooperative research with the fishing industry: Lessons learned. 2000 ICES Annual Science Conference, 27-30 September 2000, Brugge, Belgium.
Redfish Landings (1999-2003)

Redfish Landings (1999-2003)

Legend: Redfish Landings (1999-2003)
Redfish are caught along the shelf edge, in the Northeast and Laurentian channels, and in other deep areas of the Scotian Shelf and Bay of Fundy. The directed fishery is carried out by otter trawl. There are three different redfish management areas in the Maritimes Region, reflecting what is believed to be the stock structure. The management areas are different than the NAFO Divisions used in most other groundfish fisheries. Two of the management areas include parts of other DFO administrative regions.
For most of the year, the Unit 1 redfish management area is the Gulf of St. Lawrence. However, during the winter, fish from this stock move to the Laurentian Channel area, and NAFO Subdivision 4VN and the adjacent 3PN are part of the Unit 1 management area in the winter (January to May). There has been no directed fishery on this stock in the last few years as this area is under moratorium.
The Unit 2 redfish management area includes parts of the eastern Scotian Shelf (4VS and 4Wfg) and subdivision 3PS south of Newfoundland. 4VN is also part of this management area from June to December as is the 3PN subdivision near the Gulf of St. Lawrence. The landings shown in 4VN are from the summer and fall fishery on the Unit 2 redfish stock.
Unit 3 redfish includes most of 4W (4Wdehkl) and all of 4X. There is a special management area in this unit known informally as the “Bowtie.” The Bowtie is closed to fishing using small mesh gear (square mesh less than 130 millimetres) to protect small redfish. Small mesh gear is also not permitted in waters shallower than 50 fathoms (91 metres), in the Bay of Fundy north of 43°30', and in NAFO Area 5 (5Y and 5Z). As well, the haddock spawning area on Browns Bank has an extended closed period to redfish fishing from January 1 to June 30. The fishery uses small mesh gear and many of the restrictions are to prevent bycatch of small fish from other species.
Silver Hake Landings (1999-2003)

Silver Hake Landings (1999-2003)

Legend: Silver Hake Landings (1999-2003)
The directed fishery for silver hake is restricted to three areas: along the shelf edge and slope, and in Emerald and LaHave basins (see the map for the defined fishing areas). These defined windows are due to the small mesh used in the silver hake fishery and are meant to ensure that few other groundfish species are caught. A separator grate is also used to prevent catches of other groundfish. The grate allows the smaller silver hake to enter the net while larger species such as cod, haddock and pollock exit through the escapement window at the top. The fishery is carried out by mobile gear using an otter trawl. The fishery generally operates year-round with summer months being least active.
In the past, most of the silver hake fishery took place along the shelf edge and was conducted by foreign vessels. Since about 1995, the fishery has been conducted by domestic vessels and the focus has been on the two basins of the central shelf. A small test fishery in Georges Basin, in 4X north of Georges, started in 1999.
Herring Landings (1999-2003)

Herring Landings (1999-2003)

Legend: Herring Landings (1999-2003)
Management of the herring fishery uses both the Herring Fishing Areas (HFAs) delineated in the Atlantic Fishery Regulations (1985) and portrayed on the opposite page, and the NAFO Divisions. The embayment lines and the 25-mile line are also important management lines used to separate the offshore purse seine fishery from the nearshore fisheries, and to protect spawning fish.
The herring fishery takes place at different times of the year in different areas. The fishing season is year-round off southwest Nova Scotia (west of Baccaro Point, 65°30' west longitude) and in the Bay of Fundy; however, most fishing takes place at times and in areas with aggregations of feeding, overwintering, and spawning fish. The fishery in Chedabucto Bay, off Chebucto Head and off eastern Cape Breton is a winter fishery running from November to March. There is no fishery in the portion of HFA 20 that is in 4VS (see map).
Some areas are periodically closed to fishing to protect aggregations of spawning fish. The Trinity Ledge area off southwest Nova Scotia is usually closed from mid-August to mid-September, with some variation in dates each year.
Area 4VN (HFAs 17 and 18) is an area where different herring stocks from the Scotian Shelf, the Gulf of St. Lawrence and the Bras d’Or Lakes mix. It is managed separately from other areas of the Scotian Shelf. Seasons have been set in the inshore and offshore areas of 4VN based on the time periods that particular stocks are known to be present or absent.
Mackerel Landings (1999-2003)

Mackerel Landings (1999-2003)

Legend: Mackerel Landings (1999-2003)
The Mackerel Fishing Areas (MFAs) outlined in the Atlantic Fishery Regulations (1985) are the primary management areas for the mackerel fishery in Atlantic Canada. There are also trapnet management zones (not shown) for the nearshore trapnet fishery.
Off Nova Scotia most mackerel are caught in traps, largely in St. Margaret's and Mahone bays. Landings by trap are reported by statistical unit area and trapnet management zone, not by latitude and longitude. For that reason, this map looks different than the other fisheries maps. The colour-coded areas represent landings by gear other than trap, and the shaded areas near the coast represent trapnet fishing areas with high landings. The gillnet, weir and trapnet fishery takes place throughout the region from April to November while the mobile gear fishery occurs year-round off Cape Breton (MFAs 17, 18, 19). Mackerel is also caught by some of the purse seiners that are engaged in the herring fishery.
Mackerel is an important bait fish and is regularly caught by fishers engaged in other fisheries. Statistics for the bait fishery are not kept. More information on the fishery can be found in Grégoire et al. (2004).
Grégoire, F., C. Lévesque, J. Guérin, J. Hudon and J. Lavers. 2004. Atlantic mackerel (Scomber scombrus L.) fishery and biology in NAFO subareas 3 and 4 in 2003. Canadian Science Advisory Secretariat Research Document 2004/079 (CSAS resdocs - 2004/079) .
Bluefin Tuna Landings (1999-2003)

Bluefin Tuna Landings (1999-2003)

Legend: Bluefin Tuna Landings (1999-2003)
The bluefin tuna fishery is conducted in the summer and fall, when tuna are found in the waters off Nova Scotia. Landings can vary greatly from year to year, as bluefin tuna distribution is variable and dependent on water temperature and other oceanographic conditions. Total allowable catches (TACs) for bluefin tuna are set by the International Commission for the Conservation of Atlantic Tunas (ICCAT). The fish are valuable and landings are strictly monitored. License holders must purchase tags in advance of catching tuna. All tuna landed, both through directed fishing and as bycatch, must have a valid tag attached to the fish.
There are many different gear types involved in the fishery. Directed bluefin tuna fishing is carried out using angling (rod and reel), tended line, trap, and electric harpoon gear. There are restrictions on gear use in some areas. For example, in NAFO sub-unit area 4Wd, fishing is permitted using angling gear only.
Some bluefin tuna are taken in the St. Margaret’s Bay mackerel trap fishery. Limits in this fishery are controlled and tags must be purchased for all tuna harvested. Bluefin tuna are also caught as bycatch in the swordfish and other tunas longline fishery. Bycatch in this fishery is limited to the number of valid tuna tags in the license holder’s possession.
There is no bluefin tuna fishing permitted in NAFO Subdivision 4VN. The Hell Hole (Northeast Channel) is an important area for the fishery, as are certain areas near the coast of Nova Scotia, such as Emerald Basin.
Landings of Large Pelagic Species (1999-2003)

Landings of Large Pelagic Species (1999-2003)

Legend: Large Pelagic Landings (1999-2003)
Most of the fishery for large pelagic species (albacore, bigeye and yellowfin tunas, swordfish, and porbeagle, mako and blue sharks) takes place along the shelf edge and over deeper areas of the western Scotian Shelf and the Gulf of Maine. Bluefin tuna landings are not included on this map, as that fishery is conducted quite differently from the fishery for other large pelagic species.
Directed fishing for albacore, bigeye and yellowfin tunas and swordfish is carried out using pelagic (floating) longline gear in the commercial fishery. Shark species are caught as bycatch in this fishery. There is also a small directed fishery for porbeagle and blue sharks. The recreational fishery for sharks is largely hook and release. There is a swordfish harpoon fishery that takes place off southwestern Nova Scotia and to a lesser extent in other coastal areas.
Tunas, sharks and swordfish are wide-ranging species and stock management covers a much larger area than for other species. More details on management are provided in the sections corresponding to each species or species grouping.
Swordfish Landings (1999-2003)

Swordfish Landings (1999-2003)

Legend: Swordfish Landings (1999-2003)
The directed swordfish fishery takes place mainly from June to September, when swordfish are found in Canadian waters. Swordfish are highly migratory and many countries fish the same stock. Total Allowable Catches (TACs) for swordfish are set by the International Commission for the Conservation of Atlantic Tunas (ICCAT).
Pelagic (floating) longline gear is used to catch most of the Canadian quota, while the swordfish harpoon fishery accounts for up to 10 percent of annual landings. In the Scotia-Fundy region, the harpoon fishery occurs mostly in deeper waters of the central and western Scotian Shelf. The longline fishery is largely conducted along the slope, part of a continuum of swordfish fishing that occurs from Georges Bank to the Flemish Cap off Newfoundland, both inside and outside Canada’s exclusive economic zone.
Fishing Zone 1 (Gulf of St. Lawrence) and Fishing Zone 2 (Bay of Fundy) are closed to the swordfish longline fishery. The area west of 65°30'W may be closed until August to minimize bycatch of other large pelagic species. The longline fishery is not permitted to fish inside the Hell Hole (Northeast Channel) from July to November to reduce levels of bluefin tuna bycatch.
There is a seasonal closure in place to protect large female swordfish. The Broodstock Closure Area is closed to the harpoon fishery after September 1 each year. A smaller area within the Broodstock Closure Area, known as the Bluefin Exclusion Zone, is closed to longline fishers after August 1 to prevent bycatch of bluefin tuna.
Albacore, Bigeye and Yellowfin Tuna Landings (1999-2003)

Albacore, Bigeye and Yellowfin Tuna Landings (1999-2003)

Legend: Albacore, Bigeye and Yellowfin Tuna Landings (1999-2003)
The fishery for albacore, bigeye and yellowfin tunas is known to fishers and managers as the “other” tuna fishery to distinguish it from the bluefin tuna fishery. It takes place mainly from September to November, when these fish are present in our waters. Like swordfish, tunas are highly migratory and many countries fish for these species. Catch limits are set by the International Commission for the Conservation of Atlantic Tunas (ICCAT).
A directed fishery for the three tuna species began in the mid-1990s. Previously, these species were caught as bycatch in the swordfish longline fishery. The fishery is conducted using pelagic (floating) longline gear. Some fishers use trolling gear, a method which uses multiple lines with lures and hooks towed behind a fishing vessel. The fishery occurs along the shelf edge and slope. Off Nova Scotia, the slope of the western Scotian Shelf is a more important area for this fishery than the slope of the eastern Scotian Shelf (Stone 1998).
The same management areas are in place as for the swordfish longline fishery. Fishing Zone 1 (Gulf of St. Lawrence) and Fishing Zone 2 (Bay of Fundy) are closed to the fishery. Fishing is not permitted inside the Hell Hole (Northeast Channel) from July to November to reduce levels of bluefin tuna bycatch. An area along the coast of Nova Scotia, known as the Bluefin Exclusion Zone, is closed from August 1 to the end of the season to prevent bluefin bycatch.
Stone, H. 1998. Fish and fisheries: Large pelagic fisheries. In: W.G. Harrison and D.G. Fenton, eds. The Gully: A scientific review of its environment and ecosystem. Canadian Stock Assessment Secretariat Research Document 98/83. pp. 258-282 (CSAS resdocs - 1998/083) .
Porbeagle, Mako and Blue Shark Landings (1999-2003)

Porbeagle, Mako and Blue Shark Landings (1999-2003)

Legend: Porbeagle, Mako and Blue Shark Landings (1999-2003)
Pelagic sharks (largely porbeagle, blue, and shortfin mako) were traditionally and are still caught as bycatch in the swordfish longline fishery. A directed fishery for shark started in the early 1990s that targeted porbeagle and blue sharks. Porbeagle shark is the preferred species. Short-fin mako is retained as bycatch as are other species of pelagic shark which are caught in smaller numbers.
The commercial fishery is largely conducted using pelagic (floating) longline gear, although it can also be conducted using angling (rod and reel) gear and tended line. Pelagic sharks continue to be caught as bycatch in the bluefin tuna, swordfish and other tunas longline fisheries. The recreational fishery is carried out by rod and reel and is a hook and release fishery, except during shark derbies authorized by Fisheries and Oceans Canada. The recreational fishery, targeting blue shark, is becoming more popular.
The commercial fishery occurs along the slope. Catches are also taken in the deep basins of the shelf and Gulf of Maine.
There are restrictions on where and when fishing may occur. Most of these measures are to prevent bycatch of bluefin tuna and the timing of these restrictions may vary from year to year. NAFO area 4VN is closed from September 1 to December 31 to protect female sharks about to bear young. The area west of 65°30'W may be closed until August to minimize bycatch of other large pelagic species. An area near the coast of Nova Scotia, from Liscomb Point to Cape Sable (Bluefin Exclusion Zone), is closed from August to the end of the December to avoid catching bluefin tuna. The Hell Hole (Northeast Channel) is also closed from July until November to reduce bluefin bycatch. The coastal area of 4Wd within 10 miles of the coast (not shown) may also be closed in the period from August to November to prevent bluefin bycatch.
Crab Landings (All Species) (1999-2003)

Crab Landings (All Species) (1999-2003)

Legend: Crab Landings (All Species) (1999-2003)
There are commercial fisheries for red and snow crabs on the Scotian Shelf, as well as exploratory fisheries for Jonah crab, toad crab, stone crab and rock crab. The crab fisheries, particularly for snow crab, have become increasingly important since the decline of the groundfish fishery.
Crabs are fished using conical or rectangular crab traps and, for some species, modified lobster traps. The fisheries target male crabs (retention of all female crab is prohibited) and there are minimum size limits. The different crab fisheries tend to focus on different areas of the shelf.
The snow crab fishery takes place on the eastern Scotian Shelf, where environmental conditions are more suitable for the species. Red crab is fished in the deep waters of the continental slope. The Jonah crab fishery occurs in both offshore and coastal areas of southwestern Nova Scotia and southern New Brunswick. Jonah crab was originally caught as bycatch in the lobster fishery. Like Jonah crab, rock crab was also originally caught as bycatch by the lobster fishery and is primarily found in shallow, nearshore areas. The exploratory toad crab and stone crab fisheries take place off eastern Nova Scotia, although the crabs are also found off southwest Nova Scotia.
Snow Crab Landings (1999-2003)

Snow Crab Landings (1999-2003)

Legend: Snow Crab Landings (1999-2003)
The snow crab fishery is concentrated on the eastern Scotian Shelf, in Crab Fishing Areas (CFAs) 20-24. Only certain habitats in that area are suitable for fishing; thus landings came from relatively few areas and large areas have no crab fishing at all. The fishery generally opens in June or July (depending on the CFA) and continues into the fall. The closing date varies from year to year. The fishery uses traps.
The snow crab fishery off Cape Breton was small and located near the coast until the late 1970s, when the number of license holders expanded. Starting in the late 1980s, licenses were issued to fish in areas of CFA 24 further offshore. In the mid-1990s, the number of license holders expanded again as licenses were granted to some First Nations groups. In addition, temporary access was provided to eastern Nova Scotia fishers not holding snow crab licenses, including fishers who had been negatively affected by the downturn in the groundfish fishery. Allocation of quota and area fished was tied to whether or not the fisher was traditionally a snow crab license holder or a temporary entrant to the fishery. The fishery expanded to the edge of the shelf and the number of management areas and subareas also expanded. Under the current management plan temporary access is being converted to permanent status and all subarea lines are being removed. Subarea lines are not shown on the map.
An exploratory fishery in NAFO Division 4X (the western portion of CFA 24) was initiated in 1994. Unlike the eastern Nova Scotia fishery, catches are relatively low from 4X (generally less than 350 tonnes per year), the season extends from November to May and only one area is considered commercially important.
Crab Landings (Except Snow Crab) (1999-2003)

Crab Landings (Except Snow Crab) (1999-2003)

Legend: Crab Landings (Except Snow Crab) (1999-2003)
The fisheries for the crab species other than snow crab - red crab, Jonah crab, rock crab, toad crab, and stone crab - are much smaller in scale than the snow crab fishery. There are few license holders in each fishery and, for most species, the fishery is less than two decades old. A variety of management units are used, which are different in each crab fishery. These units include crab fishing areas, lobster fishing areas, and NAFO divisions. The reader should refer to other maps found in this section for the location of these management units.
An inshore experimental fishery for Jonah crab started during the 1983-84 fishing season, following decades of bycatch of Jonah crab by lobster fishers in southwest Nova Scotia and southern New Brunswick. This fishery was short-lived and a second experimental phase started in 1994-95. Several of the licenses in Lobster Fishing Area (LFA) 33 were converted from exploratory to commercial licenses in 2001. In 2001-2003, there was an offshore experimental Jonah crab fishery in NAFO Division 4W in the area more than 50 nautical miles from shore, with variable results. Most landings in the Jonah crab fishery are from the Bay of Fundy, Crowell Basin and Browns Bank, with landings also from Georges Basin and Bank. The offshore Jonah crab fishery occurs with the offshore lobster fishery, with offshore lobster license holders provided with a quota for Jonah crab.
An experimental red crab fishery occurred from the late 1960s until the mid-1970s, ending because of poor economic performance. Another short-lived exploratory fishery began in the mid-1980s, lasting for only two seasons. In the early 1990s, there was renewed interest in red crab and the fishery started again. This fishery has continued to the present in the deep waters along the shelf edge.
Like Jonah crab, rock crab was caught as bycatch in the lobster fishery for years. An inshore directed fishery off the Atlantic coast of Nova Scotia and in the Bay of Fundy started in the mid-1990s. The lobster fishery continues to catch both Jonah and rock crabs as bycatch. In LFA 33, off southwest Nova Scotia, lobster fishers are not permitted to retain Jonah crab.
There have been exploratory fisheries for stone crab and toad crab on the eastern Scotian Shelf since the mid-1990s. Few license holders are involved and landings have been low.
Scallop Landings (1999-2003)

Scallop Landings (1999-2003)

Legend: Scallop Landings (1999-2003)
Scallop fisheries occur in a variety of areas off Nova Scotia and New Brunswick, including coastal areas along the Bay of Fundy and southwest Nova Scotia, within the Bay of Fundy, and on offshore banks. There are both recreational and commercial fisheries in inshore areas. The commercial fishery is conducted by scallop drags or scallop rakes, with different types of scallop drags in use in different areas.
The fishery is managed by setting total allowable catches for different management areas and by setting meat counts (yields) for those areas. For most of the areas, the target species is the sea scallop (Placopecten magellanicus).
The offshore management areas are subunits of Scallop Fishing Areas (SFAs) 25, 26 and 27: Georges Bank (A), Georges Bank (B), Browns Bank (North), Browns Bank (South), German Bank, the eastern Scotian Shelf (excluding Banquereau), and Banquereau. St. Pierre Bank (off Newfoundland, landings not shown) is also managed as part of this fishery. There is an exploratory fishery for Icelandic scallop (Chlamys islandica) on Banquereau. The most important area for the offshore scallop fishery is Georges Bank. Middle Bank has been voluntarily closed to scallop fishing since 1997 due to low yields.
The inshore management areas are the Bay of Fundy and Lurcher Shoal to the southern boundary of Scallop Fishing Area 28 (43°40' line) and an inshore area out to 12 miles from the coast (SFA 29), stretching from the 43°40' line to Cape North, Cape Breton. The Bay of Fundy and Lurcher Shoal areas are fished by three fleets (Full Bay, Mid Bay and Upper Bay). Portions of the coastal area are fished by the Full Bay fleet while the coastal area east of Baccaro is fished by the East of Baccaro fleet. The management regime includes year-round access to some areas while in other areas there is seasonal access to prevent interactions with other fisheries. Historically the area off Digby, Nova Scotia in the Bay of Fundy has been the most important area for the inshore fishery. More information on historic trends in the scallop fishery can be found in Black et al. 1993.
The scallop fishery is currently the second most valuable fishery in the Scotia-Fundy area, after lobster. Preliminary figures for 2003 put the landed value of scallops in the region at $120 million (DFO 2005).
DFO. 2005. 2003 Value of Atlantic Coast Commercial Landings, by Region (thousand dollars). (15 March 2005).
Black, G.A.P., R.K. Mohn, G. Robert, and M.J. Tremblay. 1993. Atlas of the biology and distribution of the sea scallop Placopecten magellanicus and Iceland scallop Chlamys islandica in the Northwest Atlantic. Canadian Technical Report of Fisheries and Aquatic Sciences No. 1915.
Scallop Landings by Season (1999-2003)

Scallop Landings by Season (1999-2003)

Legend: Scallop Landings by Season (1999-2003)
The offshore scallop fishery occurs year-round in the Maritimes Region; however, not all areas are open all year. German Bank is generally open from June 1 to November 15. The closure during the late fall and spring is to avoid conflicts with the lobster fishery that takes place in the area from late November until the end of May. Part of Georges Bank is open only from March 1 to December 31st. There may be particular area closures if catch rates or yields (measured in number of meats/500 grams) are low.
The inshore management regime is complex, with some areas available to the fleets year round and other areas fished seasonally to avoid interactions with other gear and species. The fishing seasons may not match the seasonal divisions shown here.
Each seasonal map shown here uses the same categories, meaning that landings for one season can be compared with another season. Much of Georges Bank shows high landings year-round, reflecting the area’s importance to the offshore fishery. There is little activity on the eastern Scotian Shelf during the winter. There are high landings in the area off Digby in the Bay of Fundy for much of the year, reflecting the importance of this area to the inshore fishery.
Offshore Clam Landings (1999-2003)

Offshore Clam Landings (1999-2003)

Legend: Offshore Clam Landings (1999-2003)
An offshore clam fishery has been carried out on the Scotian Shelf since 1986, focussing on Banquereau. The primary species of interest are the Arctic surfclam (Mactromeris polynyma) and the ocean quahog (Arctica islandica). Vessels licensed for the offshore fishery must fish east of 65°30' W longitude and at least 20 miles from shore. Fishing is not permitted in the Bay of Fundy nor in the Gulf of St. Lawrence north of a line drawn from Cape Breton Island to Burgeo Island, Newfoundland.
Ocean quahogs were once part of the TAC for this fishery and were dropped from the management plan due to a lack of effort for the species. There was a renewed interest in fishing this species and an exploratory quahog license was recently issued for Sable Island Bank, where quahogs are found in higher density than Banquereau. As yet, there have been no landings in the exploratory Sable Island Bank fishery. Propeller clams and cockle clams (Greenland cockles) are also caught in the offshore clam fishery.
There is an inshore hard shell clam fishery conducted in defined coastal areas off southwestern Nova Scotia from Pennant Point to the 65°30' W boundary, in St Mary’s Bay and off southwestern New Brunswick. The inshore fishery directs for ocean quahogs with bycatch of other hard shell clams permitted. Other landings reported near the coast of Nova Scotia are bycatch from other fisheries.
Both the inshore and offshore fisheries use a hydraulic clam dredge and catch several other species as bycatch, some of which have potential for commercial importance.
Shrimp Landings (1999-2003)

Shrimp Landings (1999-2003)

Legend: Shrimp Landings (1999-2003)
Northern shrimp are caught on the eastern shelf using shrimp trawls (small-meshed otter trawls) and traps. The shrimp trawl fishery is concentrated on the deep holes of the eastern Scotian Shelf and an inshore area off eastern Cape Breton. The trap fishery is active in Chedabucto Bay. Vessels based in the Gulf of St. Lawrence and along the Atlantic coast of Nova Scotia are active in the trawl fishery.
The three Shrimp Fishing Areas (SFAs) of the eastern Scotian Shelf - SFAs 13, 14, and 15 - are managed together using one total allowable catch (TAC). The fishery operates year-round. The trap fishery is restricted to a nearshore area to separate the trawl and trap fisheries. While Chedabucto Bay is the most important area for the commercial trap fishery, an experimental trap fishery was recently set up in Shrimp Fishing Area 16 (4X). The experimental fishery has focused on St. Margaret’s and Mahone bays.
Prior to the introduction of a separator grate for the small-meshed shrimp trawls in the early 1990s, the shrimp fishery was not very active on the Scotian Shelf due to problems with groundfish bycatch and low prices for shrimp. With the introduction of the separator grate, more licenses were made available and landings increased. In a period of high stock abundance in the late 1990s, temporary licenses were made available. With the decline in stocks and the TAC in 2002, these licenses were not renewed in 2002-03 (see DFO 2004 for more information).
DFO. 2004. Northern shrimp on the eastern Scotian Shelf (SFA 13-15). DFO Science Stock Status Report 2004/045.
Offshore Lobster Landings (1999-2003)

Offshore Lobster Landings (1999-2003)

Legend: Offshore Lobster Landings (1999-2003)
The offshore lobster fishery occurs in Lobster Fishing Area (LFA) 41, an area that includes part of the Gulf of Maine, Georges Bank, the Northeast Channel, the banks of the eastern shelf, and the shelf edge and slope. Most landings are from the Gulf of Maine and along the shelf edge from Georges Bank to LaHave Bank. Other landings shown on the map are bycatch from other fisheries.
The offshore fishery first began in the early 1970s, in an area outside the former lobster fishing area boundaries, 92 kilometres from the coast. In 1979, LFA 40 was established on Browns Bank. This area is closed to lobster fishing to protect lobster broodstock believed to occur on the bank. Crab fishing is also not permitted.
The fishery is carried out using traps. Unlike the inshore fishery, there is no limit on the number of traps; however a TAC (total allowable catch) is set for the offshore fishery. There are few participants in the offshore fishery, with only eight licenses in total.
Jonah crab is caught along with lobster, and offshore lobster license holders are given a quota for Jonah crab. Rock crab is also caught in this fishery and retained. Only male crabs that have reached commercial size are allowed to be retained.
Special Management Areas
Marine Biodiversity Protection

Special Management Areas: Marine Biodiversity Protection

Legend: Special Management Areas - Marine Biodiversity Protection
Several management areas have been established to protect important biodiversity features of the Scotian Shelf and Bay of Fundy. There are two Marine Protected Area (MPA) initiatives in the region. The Gully MPA (designated in 2004) protects 2364 square kilometres of a large and diverse canyon ecosystem in the offshore. Regulations for this MPA include general prohibitions that apply to most marine users. Musquash Estuary is a proposed MPA (also known as an Area of Interest) in the Bay of Fundy, covering 30 square kilometres of productive coastal waters.
Fisheries and Oceans Canada and the Canadian Coast Guard established two Whale Sanctuaries (sometimes referred to as Marine Mammal Conservation Areas) in the early 1990s: Grand Manan Basin and Roseway Basin. Geographical coordinates and guidelines for the areas are published in the Coast Guard’s Annual Notice to Mariners. Their purpose is to raise awareness of areas where the endangered North Atlantic right whale may be found in order to reduce potential interactions with these whales, such as ship strikes.
Deep-sea corals are protected in two areas established under Fisheries Act regulations. The 424-square- kilometre Northeast Channel Coral Conservation Area was established in 2002 to protect high densities of large octocorals. There are restrictions and limitations on bottom ing activities in the area. The 15-square-kilometre Lophelia Coral Conservation Area was established in 2004 to protect a rare cold water coral species. All bottom ing activities in the area are restricted.
Spawning and Nursery Areas

Special Management Areas: Spawning and Nursery Areas

Legend: Special Management Areas - Spawning and Nursery Areas
Several areas of the Scotian Shelf are closed seasonally or annually to protect concentrations of spawning or early life stages of . A few of the longer-standing closures are shown on this map and are also shown on the relevant ery maps. There are many other time and area closures in effect than are shown here.
There are three areas closed at certain times of the year to protect haddock. The spawning closure on Georges Bank runs from March 1 to May 31 and applies to all directed ground eries. Browns Bank is also closed to protect spawning haddock from February 1 until June 15 each year for all directed ground eries. There is a further closure to the use of small mesh gear (square mesh less than 130 millimetres) for red from January 1 until June 30 each year on Brown’s Bank. There are other areas where the use of mesh less than 130 millimetres is prohibited and this varies in area and season.
An area encompassing Western and Emerald banks has been closed year-round to ground ing using mobile gear since 1987 and to all ground gears since 1993. This closure was initially implemented as a nursery area for juvenile haddock.
There are two other closures in the Browns Bank area besides the haddock spawning closure. An area encompassing most of Browns Bank is closed year-round to the lobster and crab eries, with the intention of protecting lobster broodstock. An area known as the “Bowtie,” encompassing Roseway Basin and a small portion of Browns Bank, is closed to the small-meshed gear used in the red ery in order to prevent high catches of juvenile red.
Time and area closures in the herring ery can vary greatly; however a closure in the Trinity Ledge area, near the western coast of Nova Scotia, is generally put in place in September each year. This closure protects aggregations of spawning herring. The timing of the closure may change from year to year.
In addition to closures that protect commercial at particular life stages, Fisheries and Oceans Canada also establishes ing seasons and closures to separate eries and prevent gear conflicts, to conduct research, and to protect human health (as in the case of many coastal shell closures). Maps and descriptions of eries, found earlier in this atlas, provide further information on management measures related to particular eries.
Coastal Areas: Restricted Land Use and Protected Areas

Coastal Areas: Restricted Land Use and Protected Areas

Legend: Coastal Areas - Restricted Land Use and Protected Areas
Along the coasts of Nova Scotia and New Brunswick, a number of provincial and federal protected areas have been established to conserve ecosystems and protect wildlife. Within these areas, large-scale commercial and residential developments are generally prohibited, but varying levels of wilderness recreation, hunting, ing, and industrial activity such as forestry may be permitted.
This map shows coastal areas with restricted land uses in New Brunswick and Nova Scotia. Areas less than 3 square kilometres in size are shown as a point. In addition to the federal and provincial sites here, there are some coastal sites set up by private conservation organizations that are not shown.
Federal protected areas in New Brunswick and Nova Scotia include the migratory bird sanctuaries and national wildlife areas administered by the Canadian Wildlife Service, and the national parks administered by Parks Canada. These areas are established to protect vulnerable or threatened species, conserve nationally significant or representative natural areas, and/or meet Canada’s international conservation commitments (CWS 2004, Parks Canada 2004). In addition to the national parks, national historic sites on the coast are shown. Like the national parks, national historic sites administered by Parks Canada have restrictions on development and other activities.
In Nova Scotia, protected beaches, nature reserves, and wilderness areas have been established at the provincial level to conserve ecologically significant, sensitive, and/or representative areas. Additionally, wildlife management areas and game sanctuaries have been created to protect specific wild species. Provincial parks also exist, but are established for a mix of recreation and tourism purposes as well as for conservation. New Brunswick has a similar mix of provincial protected areas, with Class I (very highly protected) and Class II (highly protected) protected natural areas, as well as provincial parks much like those in Nova Scotia (NBNR 2004).
Sable Island is a special case as a protected terrestrial area in the offshore. It is a federal migratory bird sanctuary. It is also protected by a special set of regulations established under the Canada Shipping Act that restrict access to the island.
CWS (Canadian Wildlife Service). 2004. Habitat Conservation. (7 December 2004).
NBNR (New Brunswick Department of Natural Resources). 2004. New Brunswick Protected Areas. (7 December 2004).
Parks Canada. 2004. National Parks of Canada. (7 December 2004)
Marine Traffic
Search and Rescue Incidents (1999-2004)

Search and Rescue Incidents (1999-2004)

Legend: Search and Rescue Incidents (1999-2004)
The year-round nature of human use in the waters surrounding Nova Scotia is associated with a significant number of distress incidents requiring maritime search and rescue (SAR) response. This map shows the density of search and rescue incidents in the region over a five-year period. The majority of these distress calls involve small craft, such as fishing and recreational vessels. The highest density of search and rescue incidents occur in the more heavily used and transited areas. For example, the waters off southwest Nova Scotia and the Bay of Fundy experience the highest number of incidents owing to the significant levels of fishing activity there, while the approaches to Halifax record a high number of incidents related to seasonal yachting and recreational boating in the area.
The specific nature of the individual incidents shown on this map varies in terms of the severity and the response required. Only a small percentage of distress incidents are classed as life-threatening and requiring immediate assistance. The majority of distress calls involve a potential risk to vessels and require regular monitoring and communications with search and rescue authorities.
The lead federal authorities for maritime search and rescue are the Canadian Forces (air force and navy) and the Canadian Coast Guard. Regional search and rescue operations are coordinated from the Joint Rescue Coordination Centre (JRCC) in Halifax. The JRCC is staffed 24 hours a day by both Canadian Forces and Coast Guard personnel. The map shows the locations of Coast Guard bases, lifeboat stations and Canadian Forces air bases in the region. Distance intervals have been projected from each lifeboat station to illustrate zones of coverage in relation to incident patterns. In general, Coast Guard lifeboats are used to respond to near and mid-shore incidents while larger vessels are used farther offshore. In many cases, trained volunteers with the Canadian Coast Guard Auxiliary and other fishing and commercial vessels in the vicinity of distressed vessels are contacted by the JRCC to assist in search and rescue operations.
Shipping Routes and Harbours

Shipping routes and harbours

Legend: Shipping Routes and Harbours
A significant amount of international and domestic commercial shipping traffic occurs over the Scotian Shelf. Commercial shipping in this area is generally in the form of tankers and general, bulk and containerized cargo carriers. The area is also transited by a range of fishing vessels, cruise ships and various government vessels. The primary commodities being moved in the region include crude oil and gas, minerals and chemicals, paper and forest products, coal and coke, and various containerized goods.
The map shows the main shipping routes through the region. These routes are drawn from the internationally recognized Ocean Passages for the World issued by the United Kingdom Hydrographic Office. The map also shows the vessel traffic service (VTS) zones that are used to control and separate vessels in high density traffic areas, such as major ports or channels. Four distinct regional traffic patterns are highlighted below:
- international shipping over the Scotian Shelf as part of the “great circle route” (i.e., shortest distance over the earth’s surface) between Europe and the eastern seaboard of the United States and Canada;
- international and domestic shipping along the coast of Nova Scotia bound to and from the United States, Bay of Fundy, Gulf of St. Lawrence and Newfoundland;
- shipping through the Cabot Strait, a major sea route linking trans-Atlantic shipping lanes to the St. Lawrence Seaway and the Great Lakes; and
- traffic associated with the major ports of Halifax, Saint John, Port Hawkesbury (Strait of Canso) and Sydney.
United Kingdom Hydrographic Service. 1987. Admiralty Ocean Passages for the World. 4th ed. Taunton, UK: Hydrographer of the Navy.
Commercial Shipping: Traffic Density (2000)

Commercial Shipping: Traffic Density (2002)

Legend: Commercial Shipping - Traffic Density
This map depicts commercial shipping density for a representative year of inbound vessel traffic to the region. The primary source of commercial vessel data for Canadian waters is the Canadian Coast Guard’s Eastern Canada Vessel Traffic Services Zone (ECAREG) system. This is a mandatory reporting system for all commercial vessels over 500 gross registered tons (GRT) transiting within Canada’s 12-nautical-mile territorial sea. Vessel trip records include information on vessel size, class, cargo and departure/destination points. The ECAREG system also provides geo-referenced information (latitude/ longitude) for chronological movement reports made during individual vessel trips.
This map does not show all international shipping through the region for the year 2000 for several reasons. The map includes only inbound traffic; however, other analyses have shown that the density pattern of departing vessels is much the same as the inbound traffic pattern. As well, the ECAREG system does not include information on vessels transiting through Canada’s 200-nautical-mile exclusive economic zone (EEZ) if they are not departing or entering the territorial sea or internal waters.
The vessel tracks shown on this map were generated by plotting vessel movements as straight lines between reported vessel locations in the ECAREG dataset. Subsequently, the number of ship tracks passing through each cell of a four-minute grid was counted. The number of ships passing through each cell was interpolated across the study area. A vessel count and weighting analysis was used to determine relative densities of the vessel tracks and routes. The resulting traffic density map corresponds to the known and expected shipping patterns in the region, with the highest density of traffic from the United States over the Scotian Shelf and through the Cabot Strait, where it is joined by trans-Atlantic vessel traffic from Europe.
Oil and Gas Industry
Introduction: Oil and Gas Activities in the Offshore
Petroleum Reserves
The Scotian Basin in Nova Scotia’s offshore is known to possess significant deposits of petroleum. The Sable Subbasin, centred on Sable Island, appears to be particularly rich in natural gas with local reserves potentially exceeding 18 trillion cubic feet (Tcf) and about 1 billion barrels (BB) of oil and gas liquids (Canadian Gas Potential Committee 2001). These reserves have received considerable attention from the petroleum industry, in part because of their location in shallow water and proximity to significant energy markets in the northeastern United States. Many hundreds of millions of dollars have been spent on exploration in the offshore and several billion dollars have been spent on production (Nova Scotia Department of Energy 2004).
There are similar estimates for hydrocarbon reserves in other geologically related basins in Nova Scotia’s offshore, but they remain virtually unexplored. These include the deep water Scotian Slope (Kidston et al. 2002), the Laurentian Subbasin (MacLean and Wade 1992), and the Shelburne Subbasin (Georges Bank) (Hardie et al. 1986). Together, the combined volumes for the entire Scotian Basin are thought to be similar to those found in other Canadian frontier basins such as the Beaufort-MacKenzie Basin and the Labrador Shelf (Kidston et al. 2002).
Exploration History
The petroleum industry has been exploring for petroleum on the Scotian Shelf for nearly half a century. In 1959 Mobil Oil Canada was issued the first offshore exploration permit covering the Sable Island area. This led to the drilling of the first exploration well on Sable Island in 1967 which encountered a number of oil and gas “shows” (observations of oil and gas). This was followed two years later by the first discovery of significant quantities of natural gas on the Scotian Shelf by Shell Canada just south of Sable Island. Between 1972 and 1979, a number of significant hydrocarbon discoveries were made in the Sable Subbasin. The Cohasset-Panuke Project (COPAN) was the first offshore energy project on the Scotian Shelf. Its oilfields came into production in 1992. The larger Sable Offshore Energy Project (SOEP) began production seven years later and continues to produce oil and gas today (Nova Scotia Department of Energy 2004).
Management
Jurisdiction over offshore resources was a matter of debate between Canada and Nova Scotia during the first two decades of exploration on the Scotian Shelf (La Forest et al. 2001). Early exploration rights were issued by the federal Department of Indian Affairs and Northern Development. In 1966, the federal Department of Energy, Mines and Resources assumed administrative authority.
Initial exploration rights were issued in large blocks that covered most of the Scotian Shelf (see e.g., Figure 2). Actual exploration activity (e.g. seismic surveys and drilling) occurred only in small portions of each block. As more geological data was collected and knowledge increased it became possible to identify areas where significant petroleum reserves were more likely to be found. Exploration activities began to focus on specific areas. This resulted in smaller land parcels being nominated and awarded. By 1982 exploration had become focussed around Sable Island and along the shelf break and slope (Figure 3).

Figure 2. Federal petroleum exploration permits in 1969 (Mills 1971).

Figure 3. Exploration leases, permits and agreements in 1982 (COGLA 1982).
During the 1980s, the Government of Canada agreed to manage offshore resources jointly with Nova Scotia and Newfoundland and Labrador in the areas adjacent to those provinces. Consequently, the federal government signed accords with Nova Scotia (1986) and Newfoundland and Labrador (1988) that led to the establishment of joint federal-provincial management boards for offshore petroleum. These became the Canada-Nova Scotia Offshore Petroleum Board (CNSOPB) and the Canada-Newfoundland Offshore Petroleum Board (C-NOPB), which became the Canada-Newfoundland and Labrador Offshore Petroleum Board (C-NLOPB) on May 1, 2005.
In accordance with common legislation passed at both the federal and provincial levels, the boards are responsible for managing virtually all aspects of the offshore petroleum exploration and development process. This process is fairly complex and involves a number of distinct steps, which are explained in more detail on the following pages. There are environmental review processes at various stages, from land nomination to development plan submission.
Many aspects of the petroleum exploration and development process are shown in this section of the atlas. Some of the information used in the maps was generated by industry and provided through the offshore boards; however, some industry data is proprietary and cannot be shown in this atlas. As well, changes in the regulatory structure for the offshore over past decades have resulted in discontinuity in data records. For that reason, the maps in this section should not be considered a complete record of all activity that has occurred or is occurring in the offshore. Nonetheless, these maps offer a general illustration of major trends and patterns in ocean use related to offshore petroleum activities.
Canadian Gas Potential Committee. 2001. Natural Gas Potential in Canada - 2001. Canadian Gas Potential Committee.
COGLA (Canada Oil and Gas Lands Administration). 1982. Offshore Oil and Gas Lands, January 1, 1982.
Hardie, D., F.R. Engelhardt, R.H. Bailey, C. Briscoe and A.C. Murray. 1986. Petroleum Exploration on the Canadian Georges Bank - A discussion paper on environmental implications. Canada Oil and Gas Lands Administration, Energy Mines and Resources Canada.
Kidston, A.G., D.E. Brown, B. Altheim, and B. Smith. 2002. Hydrocarbon Potential of the Deep-Water Scotian Shelf. Canada-Nova Scotia Offshore Petroleum Board. (7 April 2005).
La Forest, L., L. Legault, and J. Crawford. 2001. Arbitration Between Newfoundland and Labrador and Nova Scotia Concerning Portions of the Limits of Their Offshore Areas: Award of the Tribunal in the First Phase. (15 December 2004).
MacLean, B.C and J.A. Wade. 1992. Petroleum geology of the continental margin south of the islands of St. Pierre and Miquelon, offshore eastern Canada. Bulletin of Canadian Petroleum Geology, 40: 222-253.
Mills, H. 1971. Eastern Canada’s Offshore Resources and Boundaries: study in political geography. Journal of Canadian Studies 6: 36-50.
Nova Scotia Department of Energy. 2004. Oil and Gas Offshore. (15 December 2004).
Management Areas and Exploration Licenses in 2005

Management areas and exploration licenses in 2005

Legend: Management areas and exploration licenses in 2005
The Canada-Nova Scotia Offshore Petroleum Board manages petroleum exploration and development in most areas of offshore Nova Scotia. The north side of the Bay of Fundy and parts of the southern Gulf of St. Lawrence are outside the Canada-Nova Scotia Accord area and fall under federal jurisdiction. Accord-defined “Inland Water” regions such as St. Georges Bay and Minas Basin are under the exclusive jurisdiction of the province of Nova Scotia. The Canada-Newfoundland and Labrador Offshore Petroleum Board (C-NLOPB) manages part of the Laurentian Subbasin.
Certain areas of the Nova Scotia offshore are temporarily closed to petroleum exploration. One of these areas is Georges Bank, where a moratorium has existed since 1988 and remains in effect to December 31, 2012. Exploration was also suspended until recently in the Laurentian Subbasin, southeast of Cape Breton, because of a decades-long boundary dispute between Newfoundland and Nova Scotia. This dispute was finally settled by tribunal in 2002 and the C-NLOPB has since issued eight licenses in its portion of the basin. As of early 2005, the CNSOPB had nearly completed the conversion of the original exploratory permits issued under the former federal regime to new exploration licences that it will issue to the interest holders.
Exploration licenses (ELs) grant the holder the right to explore for petroleum and obtain a production license on lands designated in the license, subject to conditions defined by relevant legislation. ELs are awarded through a competitive bidding process. The process begins with a Call for Nominations, under which oil and gas companies nominate offshore lands that they would like to see offered in a Call for Bids. Following a review of the nominations by the board, a Call for Bids for ELs may be issued. Companies bid on lands they wish to explore and successful bidders are issued an EL that gives them specific exploration rights over a defined period of time - usually about five years. An EL may be renewed if a well is drilled before the license expires.
At present there are 33 active ELs in the area under CNSOPB jurisdiction. With the exception of the western Cape Breton parcel and two parcels in Sydney Bight, most CNSOPB ELs are situated on the outer offshore banks and along the shelf break and slope.
Recent Trends in Exploration Licenses

Recent trends in exploration licenses

Legend: Recent Trends in Exploration Licenses
Interest in exploring and developing Nova Scotia’s offshore area grew rapidly in the late 1990s, as natural gas pricing was deregulated in North America, production technologies advanced and geological knowledge improved, particularly as related to deep water deposits. In 1998, the number of new exploration licenses (ELs) jumped to five from only one the previous year, indicating the beginning of a new wave of exploration. Most of the new exploration was focused on the deep water Scotian Slope. This pulse of exploration was initially quite successful, and consequently the number of new ELs climbed to six in 1999, eight in 2001, and nine - the annual record to date - in 2002.
After 2002, interest in the Scotian Shelf and Slope waned as a number of exploratory wells failed to discover significant hydrocarbon accumulations, and estimates of reserves at several fields currently in production were reduced. Only two new ELs were issued for the Nova Scotia offshore area in 2003 and none in 2004, while a number of existing licenses were allowed to expire. Interest nevertheless remains high in the relatively unexplored Laurentian Subbasin between Nova Scotia and Newfoundland, and the successful Abenaki reef trend (a geological feature west of Sable Island). Eight new ELs were issued in the Newfoundland and Labrador portion of the Laurentian Subbasin last year to replace previous federal exploration permits
Commercial Seismic Surveying on the Scotian Shelf (1999-2003)

Commercial seismic surveying on the Scotian Shelf (1999-2003)

Legend: Commercial Seismic Surveying on the Scotian Shelf (1999-2003)
Seismic surveying is a technique used to predict the location of petroleum resources. Marine surveys make use of airgun arrays that direct energy pulses into the seabed. The sound waves reflect and refract differently depending on the underlying geological structure. By recording and analyzing the sound waves that return to the surface, scientists can determine geological characteristics and predict whether oil and gas deposits are likely to be present. Seismic surveys are also used to define bathymetry and identify potential geological hazards.
Until recently, marine seismic programs captured a two-dimensional cross section of the substrate along each survey line. New technology emerged in the mid-1990s that allowed scientists to create more accurate three-dimensional images of sub-surface structures. Three-D seismic involves a denser sailing pattern and a greater number of hydrophone streamers (for more detail on seismic technology, see Davis et al. 1998).
Once an exploration license has been issued, the holder usually begins exploration by conducting a 2-D seismic survey. If the results of the survey suggest that petroleum deposits are likely to be present, smaller areas with the most potential are evaluated using 3-D seismic surveys. The survey results are ultimately used to locate and plan exploration drilling programs, targeting the structures or features with the highest potential for oil or natural gas. As seismic coverage increases and geological knowledge of the shelf improves, it becomes possible to focus seismic acquisition on areas where undiscovered hydrocarbons are most likely to be present.
Information on seismic programs for the entire CNSOPB management area is shown here, including programs that overlapped with other management areas. However, only programs that had digital data available were included. Each shaded cell (10 kilometres x 10 kilometres) on the map shows 2-D seismic acquisition effort as the sum of estimated trackline kilometres shot in that cell between 1999 and 2003. The 3-D programs are shown as shaded lines on top of the coloured cells. The map shows only the seismic programs that were conducted by industry and not those conducted by government or other researchers. The majority of the outer Scotian Shelf was surveyed during the 1999-2003 period. The survey pattern generally reflects the location of exploration licenses on the shelf.
Davis, R.A., D.H. Thomson, and C.I. Malme. 1998. Environmental Assessment of Seismic Exploration on the Scotian Shelf. LGL Limited Environmental Research Associates. Prepared for Mobil Oil Canada Properties Ltd., Shell Canada Ltd. and Imperial Oil Ltd. for Submission to the Canada-Nova Scotia Offshore Petroleum Board. (14 December 2004).
Exploratory Wells and Significant Discoveries

Exploratory wells and significant discoveries

Legend: Exploratory Wells and Significant Discoveries
Exploratory wells are used to confirm the existence of hydrocarbons and to determine the types and volumes present. Before drilling, companies use the results of seismic surveys to determine which areas have the best prospects. The wells are drilled using mobile platforms. Depending on water depth, these may sit directly on the ocean bottom (jack-up rigs), or float above it (semi-submersibles and drill ships). The wells can be drilled to over 6000 metres in depth to evaluate and test potential hydrocarbon reservoirs, including the size of the reserve, its flow rate and potential production rates. Data from the well is also used to evaluate and estimate the hydrocarbon potential for similar prospects in the basin and for the basin as a whole.
Over one hundred exploratory wells have been drilled on the Scotian Shelf, the majority on the eastern shelf with a particular concentration around Sable Island. Although most wells have been drilled on the shelf’s relatively shallow banks, some have been drilled in much deeper water - up to 2085 metres - along the Scotian Slope. If an exploratory well leads to a significant discovery of oil or gas, the proponent may apply for a significant discovery license (SDL). The SDL applies to the specific area where the discovery has been made and allows the holder to maintain the rights granted by an exploration license until they are ready to start production. The license holder may make an application for a commercial discovery declaration when an area appears to have enough petroleum reserves for commercial production.
Petroleum Development and Production

Petroleum development and production

Legend: Petroleum development and production
If an oil or gas field is found to possess commercially viable reserves, a production license may be issued that allows the extraction of petroleum for sale. To date, production has ccurred from two projects on the Scotian Shelf: the Cohasset-Panuke Project (COPAN) and the Sable Offshore Energy Project (SOEP). COPAN, which began production in 1992, consisted of 11 production wells on two fields just west of Sable Island. By 1999, when the project was completed, 44.5 million barrels of light crude oil had been extracted (Jacques Whitford 2004).
The larger SOEP began production in late 1999, initially drawing gas and gas-liquids from three fields: Thebaud, Venture, and North Triumph. Two additional fields, Alma and South Venture, have since come into production. A sixth field, Glenelg, was considered for production, but plans to develop this field have been suspended. The hub for the project at Thebaud connects processing platforms at the active fields to a submarine pipeline. The pipeline runs to an onshore gas plant in Goldboro, Guysborough County. According to activity reports from the Canada-Nova Scotia Offshore Petroleum Board, SOEP produced a daily average of approximately 11.86 million cubic metres of natural gas in 2004 (CNSOPB 2005).
PanCanadian (now EnCana) unveiled plans in 2001 for a production project at its Deep Panuke gas discovery, beneath the older COPAN oil field. The company later announced that it was putting the project on hold due to economic concerns. EnCana is still considering proceeding with the project on a more limited scale.
CNSOPB. 2005. Weekly Operations Report: Sable Gas Project Production Status (February 10, 2005). Canada-Nova Scotia Offshore Petroleum Board. (March 3, 2005).
Jacques Whitford. 2004. CEAA Screening Environmental Assessment for Cohasset-Panuke Phase II Decommissioning. Prepared for EnCana Corporation.
Other Activities
Submarine Cables

Submarine cables

Legend: Submarine Cables
Several active submarine telecommunications cables make landfall in Nova Scotia. Two Atlantic Provinces Optical Cable System (APOCS) cables run from Aspy Bay and Sydney Mines, Cape Breton to Newfoundland (APOCS 1C and APOCS 2). APOCS 1A crosses the Bay of Fundy (Margaretsville, NS to Rogers Head, NB), while APOCS 1B connects Nova Scotia and PEI. Two Teleglobe cables land at Pennant Point: CANUS 1 runs to Manasquan, New Jersey and CANTAT-3 to Iceland. The Hibernia Atlantic cable system links Nova Scotia to the USA, Ireland and the UK via three active cable segments (Segment E, Ketch Harbour to Lynn, Massachusetts; Segment D, Ketch Harbour to Dublin, Ireland; and Segment A, Hospital Point (Herring Cove) to Southport, UK). International cables, both commercial and scientific, cross Canada’s Atlantic continental slope linking the US northeast directly with Europe. No high voltage DC power cables cross the Scotian Shelf, although proposals for DC power cables have recently been considered.
There are numerous inactive cables on the Scotian Shelf and Slope, some of which are more than 100 years old. CANTAT-2 was originally an international cable originating in Beaver Harbour, NS. It was re-routed to Sable Island, recommissioned as SITIFOG 2000 and operated for a period. It recently became inoperational and has not been repaired. Teleglobe’s TAT-9 cable was deactivated in 2003.
In addition to the longer interprovincial and international cables described above, numerous submarine telecommunications and power cables provide services to coastal islands along Nova Scotia’s Atlantic coastline.
Military Exercise Areas

Military Exercise Areas

Legend: Military Exercise Areas
Canada’s maritime forces engage in a range of operations and activities including sovereignty patrols, maritime surveillance, naval training and combat readiness, search and rescue, humanitarian relief and aid to civil authorities, and operational support to other government departments, including fisheries and environmental protection. Canada’s east coast naval presence is provided through Maritime Forces Atlantic (MARLANT), which has its headquarters in Halifax. To carry out its missions, MARLANT uses a range of platforms, including patrol frigates, coastal defence vessels, destroyers, submarines, ship-borne helicopters and long-range patrol aircraft.
In addition to and during the various types of missions and patrols carried out by MARLANT, naval training activities may take place in designated exercise areas off Nova Scotia. These areas are identified by a set of call names, such as ALPHA (A), BRAVO (B) and CHARLIE (C1 to C3). Each exercise area is zoned for specific types of activities, such as surface and subsurface exercises, bombing practice from aircraft, anti-aircraft firing from surface vessels, and anti-surface firing from surface vessels. The most common activity in the region is subsurface training involving aircraft, surface vessels and submarines. Live fire training is not usually conducted in the MARLANT area. Exercise areas may also be used by foreign vessels or aircraft during periodic multinational exercises or with permission from the Government of Canada. Maps, coordinates and descriptions of military activities permitted in these exercise areas are provided in the Canadian Coast Guard’s Annual Notice to Mariners.
Ongoing Marine Research and Monitoring

Ongoing marine research and monitoring

Legend: Ongoing Marine research and Monitoring
This map shows the location of some of the ongoing research and monitoring activities that are carried out on the Scotian Shelf, as well as research institutions whose predominant focus is field research in the marine environment. It is not meant to be a complete picture of all research activities or institutions, but is intended to show sampling locations for some of the long-term projects that monitor the state of the marine environment. Universities are not shown but university field stations that focus on marine research are.
The Atlantic Zone Monitoring Program regularly takes samples along transects, known as “sections.” There are several transects on the Scotian Shelf: the Cabot Strait line across the Cabot Strait, the Louisbourg line across Misaine and Banquereau banks, the Halifax line across Emerald Basin and Emerald Bank, and the Browns Bank line across Browns Bank. The program also takes samples at fixed stations near the coast, including one near the mouth of Halifax Harbour and another near St. Andrews, NB. The program collects physical, biological and chemical data on the marine environment.
Environment Canada maintains a series of moored buoys (shown) and drifting buoys (not shown) to monitor marine weather and for meteorological research. Drifting and moored buoys are also deployed for oceanographic research projects. One long-term project is the Gulf of Maine Ocean Observing System (GOMOOS), which uses buoys and other devices to collect both oceanographic and weather monitoring data. Two of the GOMOOS buoys (shown) are in Canadian waters. There may be many other research buoys present on the Scotian Shelf and in the Bay of Fundy than are depicted by this map.
The Continuous Plankton Recorder Survey, run by the Sir Alister Hardy Foundation for Ocean Science, has been using vessels of opportunity to collect plankton samples since 1931 (SAHFOS 2005). Samples from the northwest Atlantic date from 1959. The points shown on the map represent samples taken over the entire history of the program, although for many periods (e.g., from the late 1970s to early 1990s), coverage of the Scotian Shelf is sparse (Myers et al. 1994).
Myers, R.A., N.J. Barrowman, G. Mertz, J. Gamble and H.G. Hunt. 1994. Analysis of Continuous Plankton Recorder Data in the Northwest Atlantic 1959-1992. Canadian Technical Report of Fisheries and Aquatic Sciences 1966.
SAHFOS (Sir Alister Hardy Foundation for Ocean Science). 2005. SAHFOS (16 February 2005).
Marine Fish Research and Monitoring

Marine fish research and monitoring

Legend: Marine Fish Research and Monitoring
Scientists at Fisheries and Oceans Canada monitor fish populations of the Scotian Shelf, Bay of Fundy and Gulf of Maine on an ongoing basis. Some of the most important sources of information on the state of marine fish populations are bottom trawl surveys. Carried out by research vessels, the surveys have been conducted annually since 1970. There are earlier bottom trawl surveys, but these did not occur every year and did not follow the same survey design (Halliday and Koeller 1981). Bottom trawl surveys target groundfish in particular but also provide data for use in the evaluation of pelagic fish and invertebrate resources.
For the annual summer research vessel survey, the Scotian Shelf was divided into strata based on location and depth (Halliday and Koeller 1981). Each of the strata is surveyed in at least two locations each year, with tows that are approximately 1.75 nautical miles. A vertical profile of temperature and salinity is obtained with a conductivity/temperature/depth (CTD) cast at each tow location. Oxygen and nutrient samples are collected and a vertical plankton haul is made at selected stations. Strata that are large generally have more sets allocated to them, although some adjustments have been made to reflect areas where cod, haddock and pollock were historically abundant (Strong and Hanke 1995). Survey locations within each stratum are chosen randomly. The survey is not carried out in shallow coastal waters.
The map shows the depth range category and the number of sets made in each stratum each year. Approximately 300 fishing sets are completed each year and over 8800 have been conducted since 1970.
This map is shown as an example of marine fisheries research and the reader should be aware that there are other surveys that occur. These include cooperative surveys with industry, such as the 4VN and 4VSW sentinel surveys for groundfish, the 4VSW skate survey, the Scotian Shelf and Grand Banks halibut survey, and surveys for invertebrates such as shrimp, scallops, and snow crab. These may use different research designs or different stratification schemes than the summer groundfish survey.
Halliday, R.G. and P.A. Koeller. 1981. A history of Canadian groundfish trawling surveys and data usage in ICNAF Divisions 4TVWX. Canadian Special Publication of Fisheries and Aquatic Sciences 58.
Strong, M. and A. Hanke. 1995. Diversity of finfish species in the Scotia-Fundy region. Canadian Technical Report of Fisheries and Aquatic Sciences 2017.
Marine Tourism: Recreational Activities

Marine tourism: Recreational activities

Legend: Marine Tourism - Recreational Activities
There are a wide range of marine tourism activities that occur off the coasts of Nova Scotia and New Brunswick, such as whale and seabird watching, sport fishing, sea kayaking, sailing, and scuba diving. This map shows some of the marine tourism businesses and organizations that are based along the Atlantic and Fundy coasts of Nova Scotia (as of 2003) and New Brunswick (as of 2004). Because of the way in which tourism activity is recorded, it is difficult to provide a complete picture of marine tourism in the two provinces. Nonetheless, available data indicates that the tourism industry is a significant marine user in coastal areas.
There were at least 174 marine tourism businesses throughout the province of Nova Scotia in 2003 (Praxis 2004). Whale and seabird watching tours made up the largest category of marine tourism operators, with sport fishing and boat tours the second and third largest categories (Praxis 2004). Based on research conducted in 2000, about 5 percent of visitors to Nova Scotia took part in a whale or seabird watching tour in that year, while 7 percent participated in a sport fishing or sightseeing cruise (Corporate Research 2001).
Not surprisingly, whale watching activities tend to be concentrated around areas of whale congregation, particularly around the mouth of the Bay of Fundy and off northern Cape Breton (Economic Planning Group 1997). Other marine tourism activities are more geographically dispersed, with sea kayaking and boating opportunities found in many locations along the coast. All activities tend to be concentrated in coastal rather than offshore areas. The vast majority of tourism activities in New Brunswick and Nova Scotia occur between May and October (NBTP 2003, NSTCH 2004).
Corporate Research Associates. 2001. 2000 Nova Scotia Visitor Exit Survey. Prepared for Nova Scotia Department of Tourism and Culture. Nova Scotia Tourism Partnership Council Website. (9 December 2004).
Economic Planning Group of Canada. 1997. Nova Scotia Marine Tourism Study. Nova Scotia Department of Tourism, Culture, and Heritage Website. (9 December 2004).
NBTP (New Brunswick Department of Tourism and Parks). 2004. Tourism Industry Performance 2003. (9 December 2004).
NSTCH (Nova Scotia Department of Tourism, Culture and Heritage). 2004. Tourism Insights, June 2004 issue. (9 December 2004).
Praxis Research and Consulting. 2004. Between the Land and the Sea: The social and economic importance of wharves and harbours for Nova Scotia. Prepared for the Coastal Communities Network, Pictou, NS.
Cruise Ship Ports and Passengers

Cruise ship ports and passengers

Legend: Cruise Ship Ports and Passengers
Over the past decade, cruise ship activity has increased rapidly in Nova Scotia and New Brunswick but has remained concentrated around three main ports (ACCA 2003a). Halifax, Nova Scotia is by far the most frequently visited cruise ship port in the region, with 211,000 passengers arriving on 122 cruise ships in 2004 (Halifax Port 2004). This represents an increase in passenger visits of more than 400 percent since 1998. Saint John, New Brunswick and Sydney, Nova Scotia are the second and third most frequently visited ports, with 138,672 and 60,410 passenger visits respectively in 2004 (Saint John Port 2004, Sydney Ports Corp. 2004). Other cruise ship ports in New Brunswick and Nova Scotia operate on a much more limited scale, servicing relatively small coastal cruising vessels. For example, Lunenburg, Nova Scotia, which was the fourth most visited cruise ship port in 2003, welcomed only six ships carrying a total of 602 passengers (ACCA 2003b).
The cruise ship industry has become a significant contributor to the economies of Nova Scotia and New Brunswick. An economic impact study conducted in 2002 estimated that cruise ships brought at least $21.8 million in revenues to the two provinces in that year (MarketQuest Research 2003). This amount has likely grown since the study was conducted, as passenger visits have continued to increase.
Atlantic Canada Cruise Association (ACCA). 2003a. Atlantic Canada Cruise Ship Activity, 1997-2003. Atlantic Canada Cruise Association.
Atlantic Canada Cruise Association (ACCA). 2003b. 2003 Atlantic Canada Cruise Ship Activity Results. Atlantic Canada Cruise Association.
Halifax Port Authority. 2004. Port Business - Cruise. Website. (17 December 2004).
Market Quest Research. 2003. Economic Impact of the Cruise Ship Industry in Atlantic Canada. Prepared for the Atlantic Canada Cruise Association.
Saint John Port Authority. 2004. Cruise Saint John History. Website. (17 December 2004).
Sydney Ports Corporation. 2004. Completed Schedule for 2004. Sydney Ports Corporation Inc.
Ocean disposal and marine environmental quality
Disposal of Material in the Ocean

Disposal of Material in the Ocean

Legend: Disposal of Material in the Ocean
A wide variety of material is deposited in the ocean both intentionally and accidentally, legally and illegally. Historically, the common practice of transporting and disposing dangerous wastes at sea prompted the Convention on the Prevention of Marine Pollution by Dumping of Wastes and Other Matter, referred to as the London Convention. In 1975, more than 50 countries, including Canada, ratified the convention. Canadian legislation on ocean dumping is found in the Canadian Environmental Protection Act (CEPA).
Under CEPA, disposal of approved substances at sea is permitted. Approved substances are limited to dredged material; fish waste and other organic matter resulting from fish processing operations; ships, aircraft, platforms or other structures from which all floating debris or other marine pollution has been removed to the maximum extent possible; inert, inorganic geological matter; uncontaminated organic matter of natural origin; and bulky substances that are primarily composed of iron, steel, concrete or similar matter that does not have a significant adverse effect on the sea or the seabed.
Various locations contain unexploded military ordinance, either through the regulated disposal of materials by the Department of National Defence in designated and charted munitions dump sites, or as a result of shipwrecks from the First and Second World Wars. During the Second World War, Canada and her Allies participated in a chemical and biological warfare program that included production, testing and training activities. At the end of the war, it was standard practice for Allied nations to dispose of their stockpiles of surplus materials in the ocean or through burial. Some of the surplus materials disposed of in Canadian waters contained chemical agents, like mustard gas, or biological warfare agents. A number of chemical and unexploded ordinance sites are being assessed to determine risks posed to the environment and other activities, such as fishing, and to identify potential mitigation needs.
In addition to the regulated introduction of material to the ocean, the marine environment receives a large amount of man-made material as a result of illegal spills and discharges, either accidental or deliberate. One of the most significant environmental concerns in the region is the chronic introduction of oil from vessel traffic, primarily as a result of bilge and oily water discharges. Other pollution issues include marine debris, various chemical contaminants from vessels and offshore hydrocarbon development activities, and the introduction of invasive species and pathogens through ballast water. The region has also experienced several large-scale environmental emergencies, including the wreck of the Arrow oil tanker and other vessel sinkings.
Introduction: Marine Environmental Quality and Heavy Metals in the Marine Environment
Heavy Metals in the Marine Environment
Heavy metals are introduced to the marine environment by both natural processes and human activities. Natural sources are predominantly from river runoff and atmospheric precipitation, but other sources such as hydrothermal vents can, in some locations, be important. Metal mining, metal processing and industrial and domestic uses of metals and metal-containing products add a human-made component to these natural inputs. Human activities can lead to direct discharges along the coastline, from offshore industrial developments such as oil and gas development, and from shipping activity. Metals can also be mobilized during other activities, for example the burning of coal or oil, because all natural materials contain varying amounts of heavy metals. Heavy metals will be removed from coastal waters either by deposition into coastal sediments or transport offshore. The pelagic ocean can represent another “source” of metals, returning metals to the shelf environment during onshore water transport.
Concentrations of heavy metals in water and sediments illustrate the impacts of chemical contamination on marine environmental quality. The observed distributions represent the exposure of biota to potentially toxic heavy metals in both water and sediments. The maps in this section show the observed distributions of dissolved cadmium and copper in surface water, and total chromium, copper, lead and zinc in surface sediments. The surface layer dissolved contaminant maps can be used to locate metal sources and the sediment maps to locate both sources and areas of metal deposition. For the Scotian Shelf, the main source of fresh water and of heavy metals is the discharge from the Gulf of St. Lawrence. Additional inputs of heavy metals would be anticipated from populated, industrialized areas such as Sydney and Halifax, as well as from offshore oil and gas activities. Metals will be deposited in the finer grained sediments in the deeper basins along the shelf or transported offshore with the currents.
Water and Sediment Quality
The impacts on environmental quality that result from inputs of metals can be assessed by comparing the observed distributions to water and sediment quality guidelines. Because heavy metals are naturally occurring components of the marine environment, natural background concentrations are another useful environmental quality threshold. In this analysis we have used a geochemical technique (Loring 1991) to account for the natural grain-size related variability in metal concentrations. The sediment maps in this section show sediment quality codes for each sampling location based on comparisons to natural levels and the Canadian marine sediment quality guidelines for protection of aquatic life (CCME 1999). Blue sites have levels below natural background concentrations; green sites are above background but less than the sediment quality guidelines threshold effects level (TEL); and yellow sites are above the TEL but less than the probable effects level (PEL). Sediments above the PEL would be red, but there have been no observations of concentrations above the PEL on the Scotian Shelf.
CCME. 1999. Canadian sediment quality guidelines for the protection of aquatic life. Canadian Council of Ministers of the Environment, Winnipeg.
Loring, D.H. 1991. Normalization of heavy metal data from estuarine and coastal sediments. ICES Journal of Marine Science 48: 101-115.
Dissolved Cadmium

Dissolved Cadmium

Legend: Dissolved Cadmium
Distributions of dissolved cadmium are governed by inputs from coastal areas that are related to salinity and by internal oceanic cycling that is driven by primary biological productivity and associated with phosphate dristributions. The concentrations of cadmium decrease with increasing salinity and increase with increasing phosphate concentration. The average cadmium distribution for surface waters (025 metres) in fall (September to December) is shown here. It is derived by first estimating cadmium concentrations from the relationship between cadmium and both salinity and phosphate determined from available data from the shelf. Optimal estimation techniques are then used to predict cadmium levels for the entire shelf.
The relationship between cadmium and salinity and phosphate is based on data collected on oceanographic cruises conducted since 1985. The on-going data collection is being conducted to investigate changes in cadmium concentrations over time. So far, no such temporal trends in concentration have been observed.
At the northeastern end of the shelf, the distribution shows the influence of the input of cadmium from the Gulf of St. Lawrence in the low-salinity Nova Scotia Current and the importance of the high tidal energies in the outer Bay of Fundy in mixing higher cadmium levels from subsurface waters into the surface layer. Offshore concentrations in the surface layer are very low because of the removal of phosphate and cadmium from oceanic surface waters by the growth and subsequent death and sinking of phytoplankton.
The Canadian marine environmental quality guideline for the protection of aquatic life is 0.11 nanomoles of cadmium per litre (a nanomole is one billionth of mole). The highest concentrations observed on the shelf are less than half of this guideline.
Dissolved Copper

Dissolved Copper

Legend: Dissolved Copper
Distributions of dissolved copper are governed by inputs from rivers and coastal communities that are related to salinity. The average copper distribution for surface waters in fall is shown here. It is derived by first estimating copper concentrations from the relationship between copper and salinity determined from available data for the shelf and then using optimal estimation techniques to predict copper levels for the entire shelf. Copper concentrations are high in fresh waters from both natural and anthropogenic sources and decrease in coastal waters with increasing salinity. The on-going shelf monitoring program has not detected any systematic temporal trends in copper concentration.
At the northeastern end of the shelf, the distribution shows the influence of the input of copper from the Gulf of St. Lawrence in the low-salinity Nova Scotia Current. Local discharges along the Nova Scotia coastline also contribute to this signal. Because of the magnitude of the Gulf of St. Lawrence freshwater discharge, concentrations on the eastern shelf are noticeably higher than those on the western shelf. Input of copper to the Bay of Fundy from rivers draining into the bay is also evident from this map. The copper concentrations in these rivers are relatively high, so this signal is stronger than would simply be indicated by salinity.
There is no Canadian marine environmental quality guideline for the protection of aquatic life for copper. Copper, however, is very toxic to many planktonic organisms and concentrations on the eastern shelf may be high enough to limit the growth of certain copper-sensitive species.
Chromium in Sediments

Chromium in Sediments

Legend: Chrominum in Sediments
The background concentrations of chromium and most other heavy metals in marine sediments increase with decreasing grain size of the sediments, and can be estimated from the relationship between metal concentration and grain size. Concentrations are thus highest in the shelf basins and along the continental slope where finer sediments such as clays and silt are accumulating and lowest along the Nova Scotia coastline and on the offshore banks where coarser sediments such as sands and gravel are found.
The distribution shown on this map is based on all the data for surficial sediments collected by Fisheries and Oceans Canada from 1970 to the present. It also includes data from the first year of the Sable Offshore Energy Project environmental monitoring program and from an environmental survey carried out by EnCana. The samples are not very evenly distributed in space, being based almost entirely on geochemical studies of processes in the deep basins and surveying of environmental conditions in the vicinity of oil and gas exploration.
Sediments accumulate very slowly in continental shelf environments and physical and biological processes tend to mix the top few centimetres of sediment, so the entire data set can be seen as a snapshot of recent conditions. Temporal trends on decadal time frames would not be expected except near very large sources.
Two hundred and eighty-three of the 302 samples in the dataset are at background concentrations. Most of the 17 samples that are above background concentrations but below the Canadian marine sediment quality guidelines threshold effects level (TEL) are in the immediate vicinity of the Venture and South Venture offshore oil and gas platforms or in the vicinity of one of the exploratory drilling lease areas on the slope. However, most samples taken in the vicinity of these platforms are at background concentrations. The two samples that are above the TEL were collected in Emerald Basin, the largest depositional basin on the shelf. None of the samples are above the probable effects level.
Copper in Sediments

Copper in Sediments

Legend: Copper in Sediments
The concentrations of copper in marine sediments increase with decreasing grain size of the sediments, and can be estimated from the relationship between metal concentration and grain size. Concentrations are thus highest in the shelf basins and along the continental slope where finer sediments are accumulating and lowest along the coastline and on the offshore banks were coarser sediments are found.
The distribution shown on this map is based on all the data for surficial sediments collected by Fisheries and Oceans Canada from 1970 to the present. It also includes data from the first year of the Sable Offshore Energy Project environmental monitoring program and from an environmental survey carried out by EnCana. The samples are not very evenly distributed in space, being based almost entirely on geochemical studies of processes in the deep basins and surveying of environmental conditions in the vicinity of oil and gas exploration. Sediments accumulate very slowly in continental shelf environments and physical and biological processes tend to mix the top few centimetres of sediment, so the entire data set can be seen as a snapshot of recent conditions. Temporal trends on decadal time frames would not be expected except near very large sources.
Two hundred and ninety-seven of 314 samples in the dataset are at background concentrations, four are above background but below the Canadian sediment quality guidelines threshold effects level (TEL), and 13 are above the TEL. No samples are above the probable effects level. The samples that are above background concentrations are located in Emerald Basin, three smaller basins on the eastern shelf and along the continental slope. Natural processes that generate larger gradients in concentrations between continental shelf and pelagic sediments for copper than for chromium, lead or zinc are likely responsible for these observations. None of the samples with elevated concentrations were associated with the Sable Island Bank offshore oil and gas locations or the pipeline corridor.
Lead in Sediments

Lead in Sediments

Legend: Lead in Sediments
The concentrations of lead in marine sediments increase with decreasing grain size of the sediments and can be estimated from the relationship between metal concentrations and grain size. Concentrations are thus highest in the shelf basins and along the continental slope where finer sediments are accumulating and lowest along the coastline and on the offshore banks where coarser sediments are found.
The distribution shown on this map is based on all the data for surficial sediments collected by Fisheries and Oceans Canada from 1970 to the present. It also includes data from the first year of the Sable Offshore Energy Project environmental monitoring program and from an environmental survey carried out by EnCana. The samples are not very evenly distributed in space, being based almost entirely on geochemical studies of processes in the deep basins and surveying of environmental conditions in the vicinity of oil and gas exploration. Sediments accumulate very slowly in continental shelf environments and physical and biological processes tend to mix the top few centimetres of sediment, so the entire data set can be seen as a snapshot of recent conditions. Temporal trends on decadal time frames would not be expected except near very large sources.
Two hundred and sixty-five of 303 samples in the dataset are at background concentrations and 38 are above background. None are above the Canadian sediment quality guidelines threshold effects level. The observations of above-background concentrations are broadly distributed, including samples from Emerald Basin, the smaller basins on the eastern shelf, the pipeline corridor, the shelf break, and the immediate vicinity of the Sable Island Bank offshore gas production platforms.
Zinc in Sediments

Zinc in Sediments

Legend: Zinc in Sediments
The concentrations of zinc in marine sediments increase with decreasing grain size of the sediments and can be estimated from the relationship between metal concentrations and grain size. Concentrations are thus highest in the shelf basins and along the continental slope where finer sediments are accumulating and lowest along the coastline and on the offshore banks were coarser sediments are found.
The distribution shown on this map is based on all the data for surficial sediments collected by Fisheries and Oceans Canada from 1970 to the present. It also includes data from the first year of the Sable Offshore Energy Project environmental monitoring program and from an environmental survey carried out by EnCana. The samples are not very evenly distributed in space, being based almost entirely on geochemical studies of processes in the deep basins and surveying of environmental conditions in the vicinity of oil and gas exploration. Sediments accumulate very slowly in continental shelf environments and physical and biological processes tend to mix the top few centimetres of sediment, so the entire data set can be seen as a snapshot of recent conditions. Temporal trends on decadal time frames would not be expected except near very large sources.
Two hundred and ninety-nine of 312 samples are at background concentrations and 13 are above background. None are above the Canadian sediment quality guidelines threshold effects level. Concentrations are close to background everywhere with the few above-background samples showing no particular pattern.
- Date modified: