
Report of the Atlantic Seal Science Task Team: Appendix 5
Background provided to the task team by DFO with regards to Atlantic seal populations and their impact on fish stocks
To date, harp and grey seals have been the focus of DFO's research efforts off the NW Atlantic largely because of their commercial harvests and the potential for interactions with commercial fish species. To a lesser degree, harbour and hooded seals are (or have previously been) the subject of some population studies by DFO, whereas studies on bearded and ringed seals have been limited.
Harp seals: population dynamics
Harp seals are the most abundant seal species in Canada, inhabiting waters from the southern Gulf of St. Lawrence (GSL) and the Scotian Shelf north to Labrador, Baffin Bay and Greenland. Adult harp seals grow to be 1.7 - 2.0 m long and weigh between 115 to 140 kg. They are present in Atlantic Canadian waters for approximately 6 months/year (~Nov-May), including the breeding season, and summer in either the waters of the Canadian Arctic or Greenland. Harp seals generally require stable ice for pupping, nursing and resting, and give birth to a maximum of one pup annually. When ice is scarce, harp seals will occasionally pup on land, but pup survival is greatly diminished. As such, the majority of the population pups on the ice off of the eastern shore in Newfoundland and Labrador, with the remainder (approximately 1/3) pupping in the GSL (Figure 1).
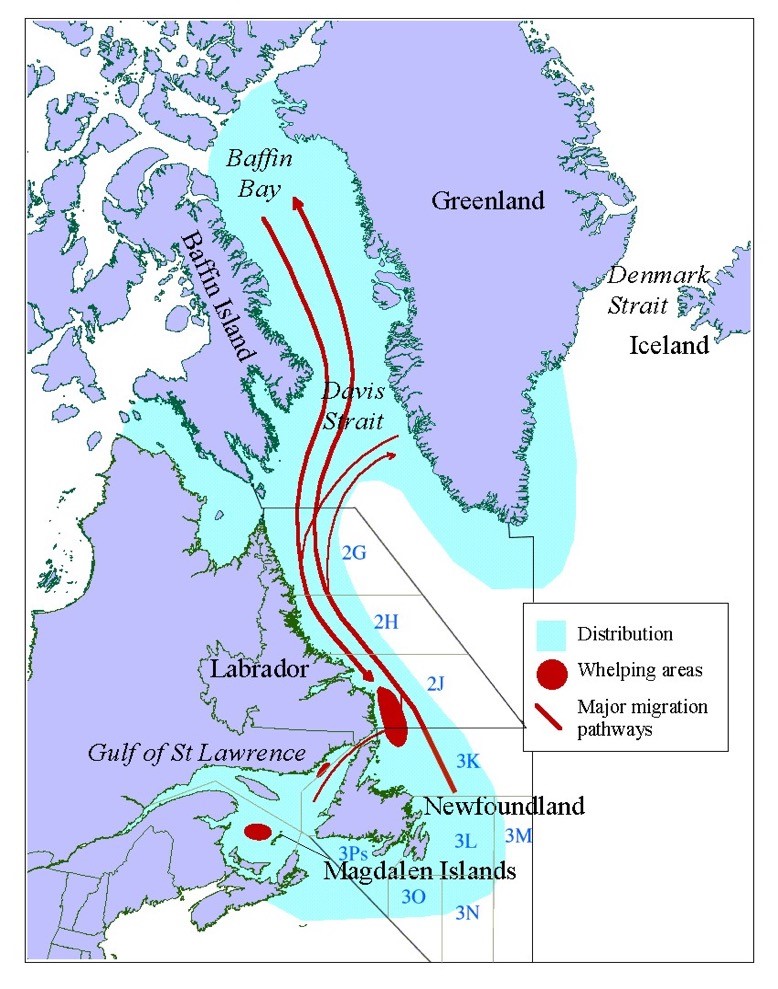
Figure 1. Harp seal distribution and breeding areas
In 2019, the population was estimated at 7.6M (95% confidence interval = 6.55M - 8.82M) based on the 2017 survey; the next survey is planned for March 2022. The harp seal assessment model indicates that the population increased from the 1970s until the mid-1990s and was relatively stable between the mid-1990s and 2011. The levelling off of the population was due to lower reproductive rates, some years of high ice-related mortality and the very high level of catches of young between 1996-2008 (i.e., > 300,000 in some years in Canada alone). Since 2011 the population has begun to increase, likely due to reductions in removals and higher reproductive rates (Figure 2). Reproductive rates of harp seals are highly variable between years and are related to changes in capelin abundance (Stenson et al 2016).
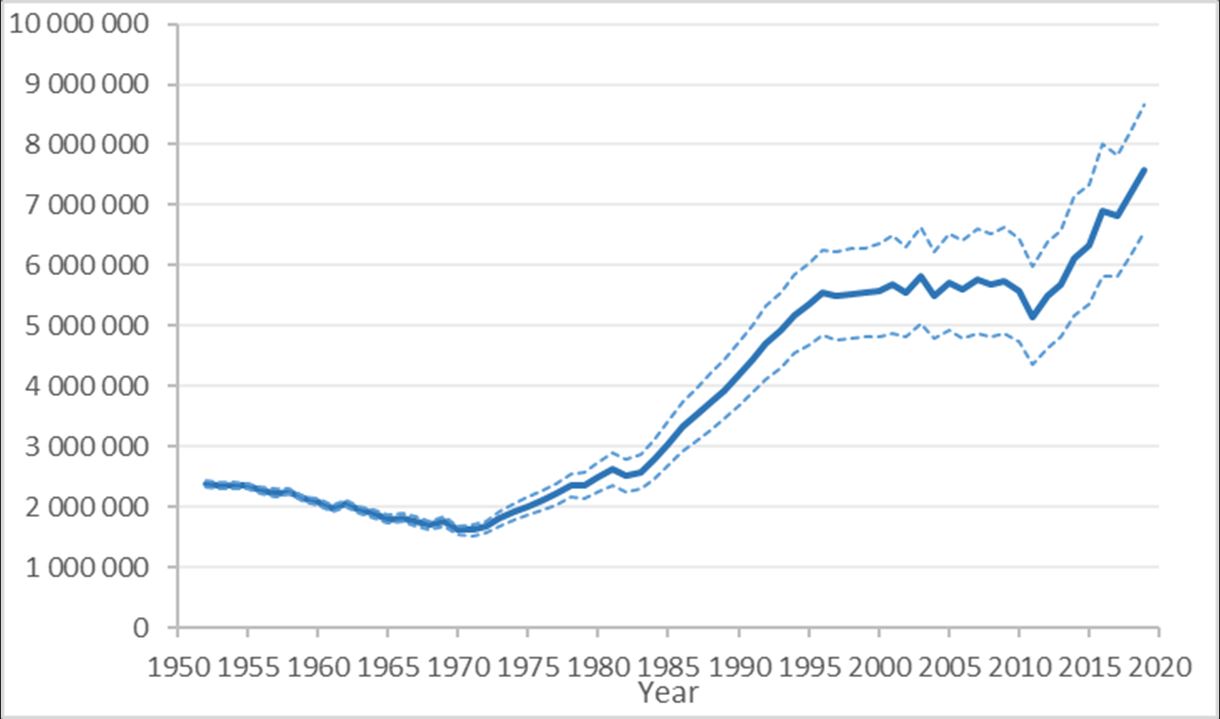
Figure 2. Harp seal population abundance
Individual growth rates have declined from the 1980's to the 2000's, and females are now on average 5 cm shorter and 20 kg lighter than they were in the 1970's. Body condition is influenced by winter ice and rate of ice breakup. Changes in harp seal abundance are largely influenced by ecosystem factors such as capelin abundance and deteriorating ice conditions which has greatly reduced pupping success and pup survival in the GSL. The expected decline in ice cover in Atlantic Canada is expected to lead to increases in harp seal pup mortality and changes to prey availability which will in turn influence harp seal reproductive rates. Mortality of young caused by poor ice conditions has been incorporated into harp seal population assessment models. If the ice cover continues to decline, the fraction of the population breeding in the Gulf is also expected to decline and may result in a permanent redistribution of the breeding population.
DFO's scientific activities on harp seals have included estimating current abundance and trends in the population to further develop the assessment model, researching the role of seals in NW Atlantic ecosystems and their impacts on the ecosystem.
Grey seals: population dynamics
Grey seals are present in Atlantic Canadian waters year round, occurring in the GSL, Scotian shelf and off Newfoundland & Labrador. Males can be up to 2.7 m long and weigh up to ~400 kg, with females up to 2.05 m and weighing up to 250 kg. Females give birth to a maximum of one pup annually (pupping is done primarily on land), with the largest colony located on Sable Island, NS. Grey seals are also considered “data rich”, and the population was last estimated in 2017 at 424,300 individuals (95% confidence interval = 263,600 - 578,300) based on the January 2016 survey. The most recent survey was completed in January 2021, and the population assessment will be updated via DFO peer-review in fall 2021. The current population model predicts that the population size continues to increase at an overall rate of 4.4% per year; this is a reduced rate of increase compared to previous decades (e.g., between 2007 and 2012, the rate was 5.2%). Juvenile mortality doubled between the early 1990s and the mid-2000s.
Prior to the 1980's, most grey seals bred in the Gulf, however, since 2016, 90% of the breeding takes place on the Scotian shelf on Sable Island. In the last thirty years, new grey seal colonies have been established on coastal islands throughout the Maritimes (Figure 3). Satellite tracking of individual grey seals over the last 25 years has demonstrated their extensive distribution across the Northwest Atlantic from Georges Bank to the Northern reaches of the GSL and the south coast of Newfoundland (Figure 4).
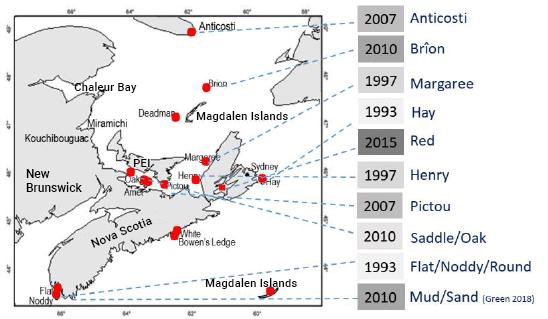
Figure 3. Year of establishment of new grey seal colonies
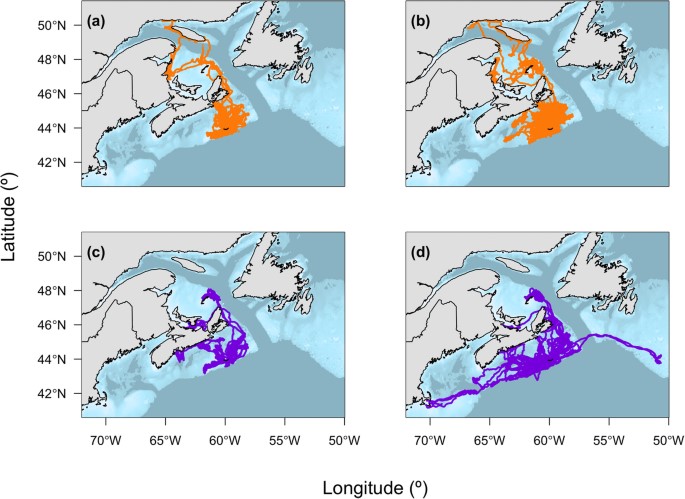
Figure 4. Locations of grey seals (n = 79) between June and December over the study period separated by season and by sex: a females in summer (n = 37), b females in fall (n = 59), c males in summer (n = 9), and d males in fall (n = 20) (Nowak et al. 2020).
Adult survival of grey seals has remained constant over time, as has reproductive rates of animals aged 8 years and older. Conversely, age at maturity has increased for Sable Island breeders and the reproductive rate for animals aged 4-6 years old has decreased for GSL breeders.
Significant DFO research efforts have been focused on grey seals via the historical research program on Sable Island and through targeted research to evaluate the potential impacts of seal predation on key fish stocks throughout the Atlantic region.
Estimating impacts of seal predation on commercial fish stocks
Estimating the amount of prey consumed by seals requires data on both seal and prey species population sizes, seasonal distribution and growth rates, as well as seal diet composition data varying by age/sex/season/region.
The lack of data on seals and their prey species' population abundance and/or seasonal distribution, combined with the large geographical ranges occupied by seals, makes it challenging to estimate prey consumption, and even more difficult to translate those estimates of consumption to estimates of “impacts”.
Harp and grey seal diets have been studied extensively using a variety of scientific techniques, each with their implicit assumptions and limitations. Variability in these estimates of diet composition adds layers of complexity in determining the relative “impact” of seals on their prey populations. There are 2 general mechanisms through which seal consumption can impact the status of fish stocks: predation and competition. The impact of seals on fish stocks has been confirmed in some cases (e.g., grey seals and 4T cod; DFO 2010) and not in others (e.g., harp seals and Northern cod; Buren et al. 2014).
The relative impact of seals on their prey will depend on many factors, including: the relative and absolute abundance of the various prey species, their availability, their energy content, the impact of other predators and various environmental factors affecting the prey demography. For example, prey species that have been subject to previous overfishing and now exist in very low numbers may be more susceptible to seal predation than stocks that are considerably healthier and are currently harvested. Newer and more sophisticated quantitative fish stock assessment models can allow for factors such as predator-prey dynamics to be included, which, combined with diet data, may begin to facilitate a better understanding of the impact of predators on commercial fish stocks.
Harp seal diet has been investigated using a variety of methods, including: classic hard parts analysis, fatty acids and stable isotopes. Results stemming from all methods suggest that harp seal diets vary considerably between seasons, ages, sexes, and among areas and years. Offshore winter diet (2J3KL) consists mostly of capelin, arctic cod, sandlance, and amphipods, whereas the inshore winter diet is dominated by capelin, arctic cod, amphipods, and herring (Figure 5a). Diet changes between seasons as evidenced, with summer inshore diet having much less arctic cod and a greater proportion capelin and herring (Figure 5b). Historically, DFO diet sampling has been more comprehensive for inshore areas.
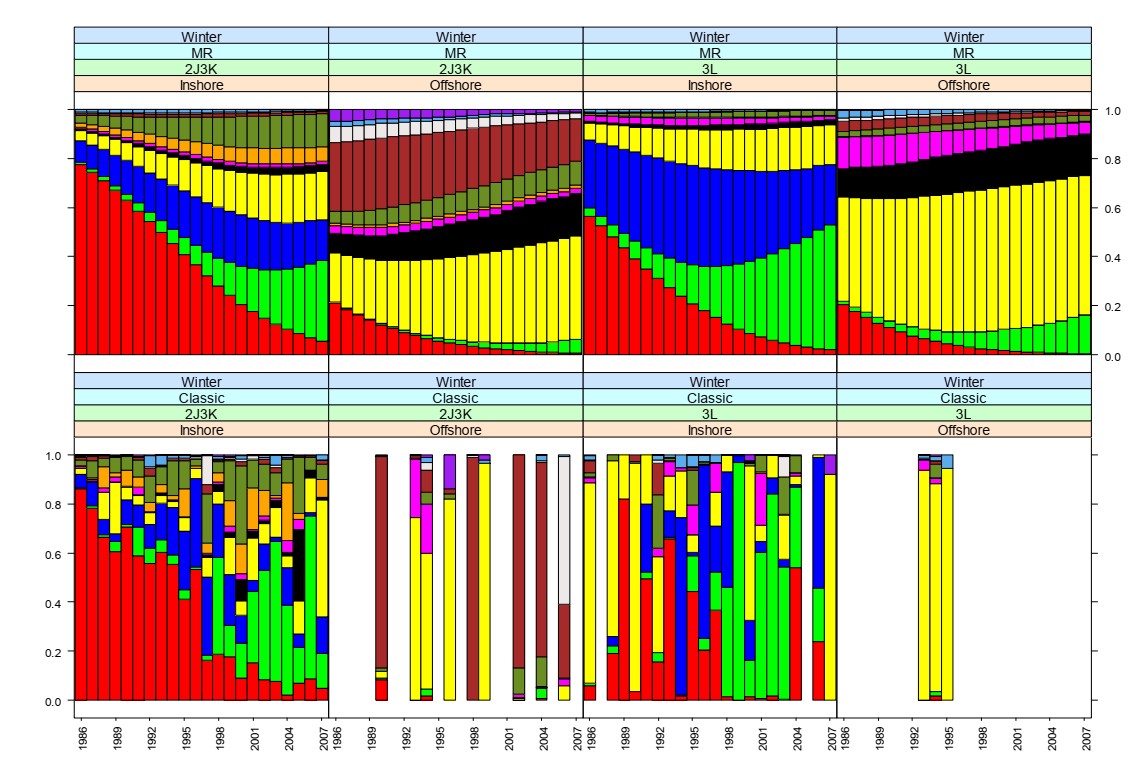
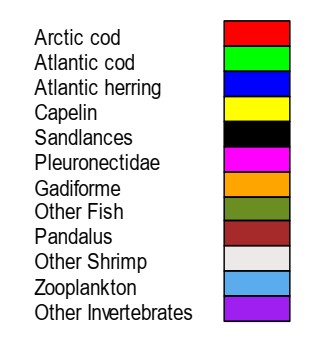
Figure 5a. Estimated winter diets (1986-2007) of Harp Seals in Div. 2J3KL determined using: i) a multinomial regression method and (top panel) and ii) classic hard parts analysis (bottom panel) (from DFO 2012).
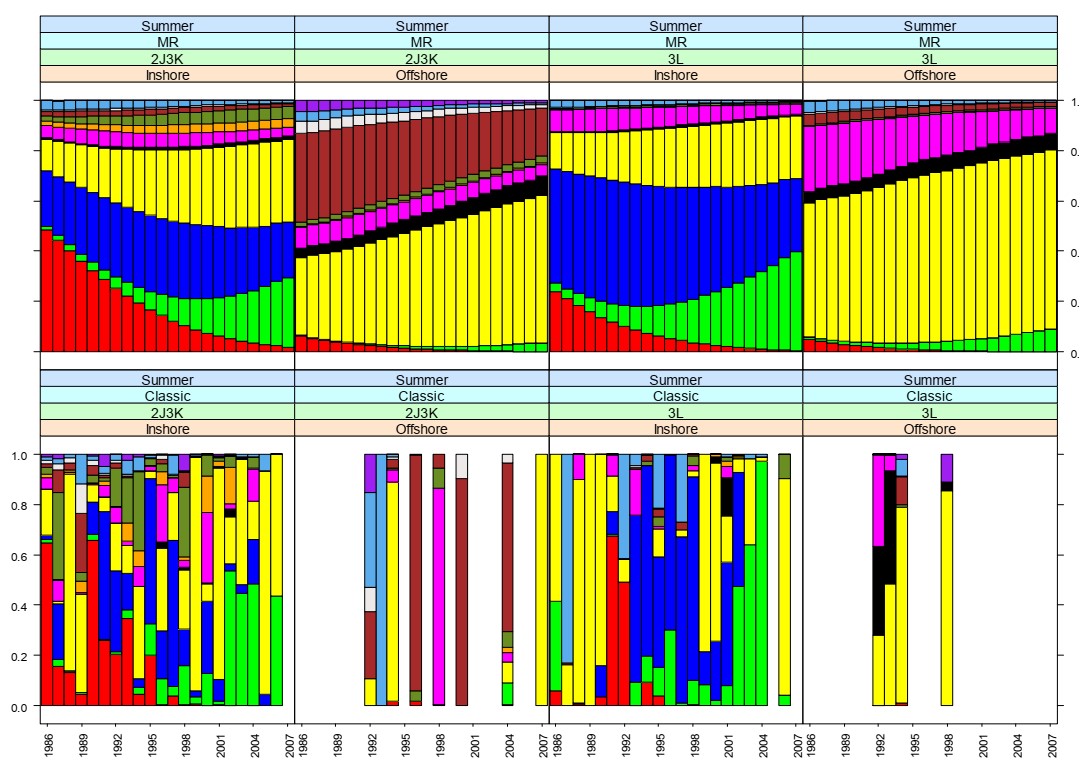
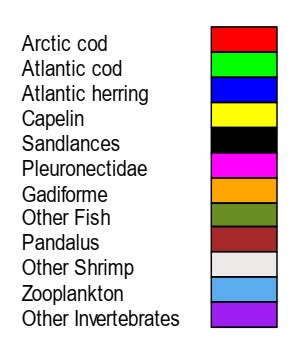
Figure 5b. Estimated summer diets of Harp Seals in Div. 2J3KL (1986-2007) determined using: i) a multinomial regression method and (top panel) and ii) classic hard parts analysis (bottom panel) (from DFO 2012).
In 2007/2008 DFO Science evaluated the impacts of harp seals on fish stocks in Atlantic Canada. Results suggested that harp seal predation was not a significant factor in the lack of cod recovery, and although capelin (i.e., a key food for cod) can be a significant part of harp seal diet, there was no evidence that harp seals negatively impacted the capelin population (DFO 2009).
In 2014, further work by DFO (Buren et al. 2014) suggested that consumption by harp seals is not limiting capelin abundance; instead, capelin population dynamics are primarily explained by variations in environmental factors (e.g., ice, ocean temperature etc.). However, reproductive rates of harp seals are highly variable between years and are related to changes in capelin abundance. Most recently, harp seals were not specifically identified as primary drivers of cod abundance in the northern GSL or in 2J3KL in 2020 DFO assessments. In the latter population, ecosystem conditions and specifically limited food availability (i.e., shrimp and capelin) is thought to be stalling stock growth (DFO 2021). A bioenergetic model (Stenson 2012) suggests that in 2008, the population of harp seals was 8.3 million, and they accounted for the consumption of 4 million tonnes of prey in NAFO division 2J3KL. For comparison purposes, it is thought that fish species consume from 2.5 to 10 times as much prey (including capelin and shrimp) as harp seals in the same NAFO (Figure 6; Stenson 2012).
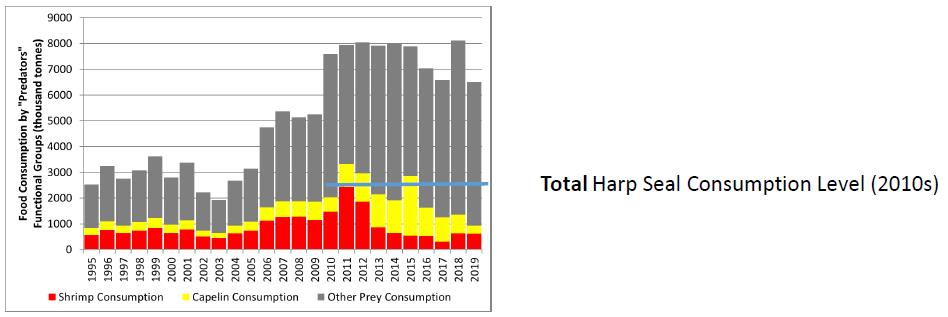
Figure 6. Median consumption by Fish Predators (Medium and Large Benthivores, Plankpiscivore, and Piscivore Functional Groups), partitioned by key prey (Buren et al. 2014; DFO 2021. M.Koen-Alonso, unpublished).
Grey seals consume 1.5- 2 tons of food per year, almost entirely fish such as sandlance, cod and other groundfish, flatfish, herring, and skates, depending on the geographic area. Diets also vary considerably between seasons, ages, sexes, and among areas and years. The known influence of grey seals on prey populations such as cod varies by ecosystem. In 2010, DFO sought scientific advice to quantify the impact that grey seal predation had on Atlantic cod stocks. Results suggested that grey seal predation is the greatest contributor to increased natural mortality of large cod in the Southern Gulf (NAFO area 4T) and that in order to lower natural mortality of cod to a rate that would promote cod recovery, it was concluded that approximately 70,000 seals foraging in the Southern Gulf area would need to be removed (DFO 2010; Figure 7). However, the link between grey seals and Atlantic cod in other ecosystems, namely the Scotian Shelf and the northern GSL was less clear, and comparable information was not available for the mortality inflicted by grey seals on cod in the southern Scotian Shelf and Bay of Fundy (NAFO area 4X) and the Cabot Strait (NAFO area 4Vn).
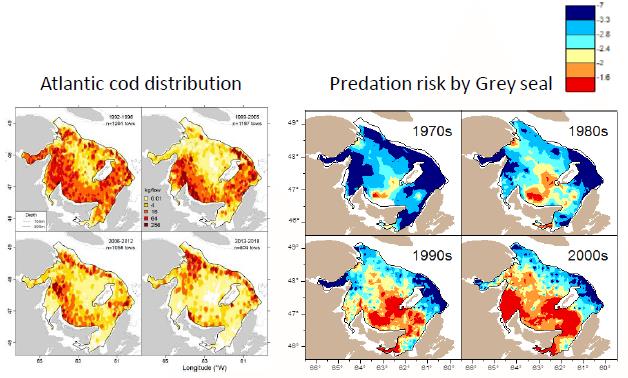
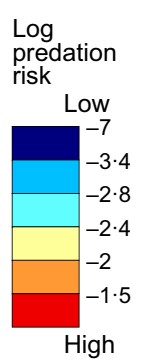
Figure 7. Grey seal predation risk and Atlantic cod distribution (DFO, 2019; and adapted from Swain et al. 2015)
Though there are many reports of seal predation on salmon in estuaries and in rivers, DFO research shows that salmon is a rare component of harp and grey seal diet (Cairns and Reddin 2000). Diet studies found that Atlantic salmon consist of 0.2-0.4% of Grey seal diet (Hammill and Stenson 1997, Cairns and Reddin 2000). Forty seal stomachs collected in Miramichi from June to August found no evidence of salmon (adults or smolts) (MSA, 2002). The predation window is in summer and fall, so potential prey are post-smolt and returning adults. The low abundance of salmon in the environment reduces the probability of detecting their presence in samples. Given its very low abundance, the loss of a few Atlantic salmon, especially spawners, can be far more significant to the salmon population than for more abundant fish species.
References
- Buren A.D., Koen-Alonso M, Stenson GB. 2014. The role of harp seals, fisheries and food availability in driving the dynamics of northern cod. Mar Ecol Prog Ser 511:265-284.
- Cairns, D.K. and D.G. Reddin. 2000. The potential impact of seal and seabird predation on North American Atlantic salmon. Canadian Stock Assessment Secretariat, Research Document 2000/12 36 pp.
- DFO. 2009. Proceedings of the National Workshop on the Impacts of Seals on Fish Populations in Eastern Canada (Part 2); 24-28 November 2008. DFO Can. Sci. Advis. Sec. Proceed. Ser. 2009/020.
- DFO. 2010. Impacts of grey seals on fish populations in eastern Canada. Fisheries and Oceans Canada (DFO) Canadian Science Advisory Secretariat (CSAS) Science Advisory Rep. 2010/071.
- DFO. 2012. Estimating consumption of prey by Harp Seals, Pagophilus groenlandicus, in NAFO Divisions 2J3KL. Research Document. DFO Can. Sci. Advis. Sec. Ser. 2012/156.
- DFO. 2019. Assessment of Atlantic Cod (Gadus morhua) in the southern Gulf of St. Lawrence (NAFO Div. 4T-4Vn (Nov. – April)) to 2018. DFO Can. Sci. Advis. Sec. Sci. Advis. Rep. 2019/021.
- DFO. 2020. 2019 Status of Northwest Atlantic Harp Seals, Pagophilus groenlandicus. DFO Can. Sci. Advis. Sec. Sci. Advis. Rep. 2020/020
- DFO. 2021. 2020 Stock Status Update for Northern Cod. DFO Can. Sci. Advis. Sec. Rep. 2021/004.
- DFO. 2021. Assessment of 2JK3L Capelin in 2019. DFO Can. Sci. Advis. Sec. Rep. 2021/045.
- Hammill, M.O. and G.B. Stenson. 1997. Estimated prey consumption by Harp seals (Phoca groenlandica), Hooded seals (Cystophora cristata), Grey seals (Halichoerus grypus) and Harbour seals (Phoca vitulina) in Atlantic Canada. J. Northw. Atl. Fish. Sci. 26: 1-23.
- MSA. 2002. [Missing reference]
- Nowak, B.V.R., Bowen, W.D., Whoriskey, K. et al. 2020. Foraging behaviour of a continental shelf marine predator, the grey seal (Halichoerus grypus), is associated with in situ, subsurface oceanographic conditions. Mov Ecol 8, 41.
- Stenson, GB, Alejandro D. Buren, Mariano Koen-Alonso. 2016. The impact of changing climate and abundance on reproduction in an ice-dependent species, the Northwest Atlantic harp seal, Pagophilus groenlandicus. ICES Journal of Marine Science, Volume 73, Issue 2, January/February 2016, Pages 250–262
- Swain, D.P., Benoit, H.P., Hammill, M.O. 2015. Spatial distribution of fishes in a Northwest Atlantic ecosystem in relation to risk of predation by a marine mammal. Journal of Animal Ecology, 84:1286–1298.
- Date modified: