
Socio-Economic Impact of the Presence of Asian Carp in the Great Lakes Basin
Prepared by
Salim Hayder, Ph.D.
Edited by
Debra Beauchamp
Fisheries and Oceans Canada, Policy and Economics
501 University Crescent, Winnipeg, Manitoba R3T 2N6
Table of Contents
- Executive Summary
- Introduction
- Chapter 1: A Brief Overview of the Study Area
- Chapter 2: Literature Review
- Chapter 3: Methodology Adopted
- Chapter 4 - Baseline Values of Activities around the Great Lakes
- Water Use
- Raw Water Use
- Industrial Water
- Agricultural Water
- Commercial Fishing
- Recreational Fishing
- Recreational Hunting
- Recreational Boating
- Beaches and Lakefront Use
- Wildlife Viewing
- Commercial Navigation
- Oil and Gas
- Ecosystem Services
- Option Value
- Non-Use Value
- Aggregated Economic Contribution
- Limitations/Gaps Identified in the Study
- Chapter 5: Social and Cultural Values of the Great Lakes
- Chapter 6: Scenario Based on Biological Risk Assessment
- Chapter 7: Socio-Economic Impact Assessment
- Chapter 8: Conclusion
- Bibliography
- Matrix 1: Total Economic Valuation Flowchart
- Definitions
- Matrix 2: The Great Lakes - Total Economic Valuation Flowchart
- Matrix 3: Summary of Empirical Studies Used for Valuation of Economic Activities in the Great Lakes basin
- Annex 1: Selected Socio-Economic Indicators for Ontario
- Annex 2: Aboriginal identity population by Sexes, Age Groups, Median Age for Ontario and Canada
- Annex 3: Estimated Water Consumption and Values by Sector, Lake and Province for the Year 2008
- Annex 4: Landings and Landed Values of Commercial fisheries in the Great Lakes by Species and Lake in 2011
- Annex 5: Number of Fish Harvested All Anglers Who Fished on the Great Lakes, by Species and Lake, 2005
- Annex 6: Heat-Map - Commercial and Recreational Fishing for 20 and 50 Years
Executive Summary
“Socio-Economic Impact of the Presence of Asian Carp in the Great Lakes Basin” provides a detailed socio-economic analysis of the potential economic impact to Canada of the establishment of Asian carp in the Great Lakes.
The Great Lakes – Superior, Huron, Michigan, Erie and Ontario - are the world's largest freshwater system, with 20% of the world’s fresh surface water and 95% of North America’s fresh surface water. With the exception of Lake Michigan, they straddle the Canada-United States border, and form a basin that is home to more than 11 million people, including 98% of Ontario’s residents and over 60 aboriginal communities (Ontario Ministry of Natural Resources, 2010).
The Great Lakes are an important source of drinking water and support fish, wildlife, plants, thousands of wetlands and a variety of landscapes. They are home to world-class commercial and recreational fisheries, numerous recreational activities and commercial transportation, and provide both tangible and intangible benefits to residents of Canada and of the United States.
The Lakes and their watersheds are facing threats from Asian carp, an Aquatic Invasive Species (AIS) in North America that is responsible for significant impacts on native species and associated human activities, through ecological damage, habitat alterations and direct competition for resources. This threat has attracted the attention of the governments of Canada, the United States, the province of Ontario, a number of states, as well as First Nations, the general public, industry associations and non-governmental environmental organizations.
In 2010, the Government of Canada renewed $4 million in funding to facilitate an AIS monitoring system and to meet AIS assessment needs, such as research funding, biological risk assessment, and regulatory policy development. In 2012, Fisheries and Oceans Canada (DFO) received $17.5 million over five years to protect the Great Lakes from Asian carp, under its Great Lakes Asian Carp Program. This study is a result of the risk assessment initiative.
DFO undertook the study to supplement the bi-national (Canada -US) Ecological Risk Assessment (DFO, 2012) to address the Asian carp threat to the Great Lakes, which was led by the Centre of Expertise for Aquatic Risk Assessment, DFO. This study also supports the AIS objectives under DFO’s “Sustainable Fisheries and Aquaculture” strategic outcome.
The methodology adopted for the study’s analysis is the Total Economic Valuation technique. This methodology has been used for both valuation of activities on the Canadian side of the Great Lakes basin, and for Net Present Valuation for discounting purposes. In order to estimate the economic values of identified activities, the study arrived at best estimates of the expenditures made and of the consumer surplus generated by the activities in Canada. For the purposes of estimating the impact to Canada, the study has excluded Lake Michigan. In alignment with DFO (2012), it was assumed that following the arrival of Asian carp, it would take 7 years for the impact to emerge in areas where the carp were present. Therefore, as the socio-economic study uses 2011 as the base year, it uses an adjusted base of 2018 from which to consider the 20 year and 50 year impacts.
The study used secondary source information, and was benefitted greatly from: (i) community profiles around the Great Lakes, primarily from Statistics Canada; (ii) the bi-national Ecological Risk Assessment (DFO, 2012), including supplementary reports; (iii) a workshop held on March 29, 2012, jointly organized by the Great Lakes Fisheries Commission and Policy and Economics, Central and Arctic Region, DFO;Footnote 1 and (iv) expert opinion exchanged between a group of science experts involved in the Ecological Risk Assessment and economists involved in analyzing this socio-economic study of the presence of Asian carp in the Great Lakes.
In selecting the scenario for the impact assessment, the study followed DFO (2012) and assumed that in the absence of additional preventive measures, Asian carp will arrive, establish populations, survive, and spread throughout the Great Lakes, due to the availability of suitable food, thermal and spawning habitats, and the high productivity of embayments in the Great Lakes basin. Since there is no feasible way to separate out the impact of an introduction of Asian carp into the Great Lakes from other influences in the economy such as urbanization and climate change, the analyses in the study were premised on scenarios both with, and without, the presence of Asian carp, holding other variables unchanged.
Based on a literature review, the study identified the following major activities for the development of the baseline: (i) water use; (ii) commercial fishing; (iii) recreational fishing; (iv) recreational hunting; (v) recreational boating; (vi) beaches and lakefront use; (vii) wildlife viewing; and (viii) commercial navigation. It estimated the annual value of economic contribution of these activities in and around the Great Lakes basin at $13.8 billion dollars (see the attached matrix). Of that total, expenditures made and imputed values/prices for these activities comprised $13.4 billion (96.9%), while consumer surplus made up the remaining $0.4 billion (3.1%).
The study recognized that the Great Lakes basin provides invaluable services to society through maintaining ecosystem health and biodiversity. Those intrinsic values are, however, difficult to quantify, because they are much more intangible than other benefits, such as commercial fish harvesting (Krantzberg et al., 2006). The study found a similar challenge in quantitatively capturing the benefits of option and non-use values based on the existing set of information. However, these total non-use values might fall in the range of 60% - 80% of the total economic value (Freeman, 1979).
The Great Lakes provide considerable subsistence, social, cultural, and spiritual benefits to the people residing in the region, and considerable benefit to the economy as a whole. Freshwater fisheries have contributed substantially to preserving traditional aboriginal life-styles in the study region. Socially, the Lakes’ beaches and shorelines provide a “sense of place” and unique source of community pride, and serve as key measures for public perceptions of environmental quality. The Lakes also provide opportunities for research and educational activities that result in a better understanding of the ecology.
The study estimated that the total present (economic) values of commercial fishing, recreational fishing, recreational boating, wildlife viewing, and beaches and lakefront use were $179 billion and $390 billion, in 20 years and 50 years, respectively, starting in 2018 (see Table below).Footnote 2
Description
The table in the Executive Summary is titled “Estimated Present Values of Affected Activities in the Great Lakes in 20 and 50 Years by Activity”. It is sourced from a Fisheries and Oceans Canada staff calculation, Policy and Economics, Central and Arctic Region. The table has four columns. The first column is captioned “List of Activities”; the second “Base Year 2008 ($Million); the third “20 Years ($Billion)”; and the fourth “50 Years ($Billion)”. There are six rows. Row 1 is commercial fishing with a base year 2018 value of $227 million, a 20-year value of $5 billion and a 50-year value of $10 billion. Row 2 is recreational fishing with a base year 2018 value of $560 million, a 20-year value of $12 billion and a 50-year value of $26 billion. Row 3 is recreational boating with a base year 2018 value of $7,291 million, a 20-year value of $153 billion and a 50-year value of $333 billion. Row 4 is wildlife viewing with a base year 2018 value of $218 million, a 20-year value of $5 billion and a 50-year value of $10 billion. Row 5 is beaches and lakefront use with a base year 2018 value of $248 million, a 20-year value of $5 billion and a 50-year value of $11 billion. Row 6 is the total values for all activities combined. The total base year 2018 value is $8,544 million; the total 20-year value is $179 billion; and the total 50-year value is $390 billion.
| List of Activities | Base Year 2018
($Million) |
20 Years
($Billion) |
50 Years
($Billion) |
|---|---|---|---|
| Commercial Fishing | $227 | $5 | $10 |
| Recreational Fishing | $560 | $12 | $26 |
| Recreational Boating | $7,291 | $153 | $333 |
| Wildlife Viewing | $218 | $5 | $10 |
| Beaches and Lakefront Use | $248 | $5 | $11 |
| Total | $8,544 | $179 | $390 |
Source: Fisheries and Oceans Canada staff calculation, Policy and Economics, Central and Arctic Region.
The study examined the risks presented by Asian carp to these values and found that the establishment of Asian carp in the Great Lakes would cause moderate to high damage to commercial fishing, recreational fishing, recreational boating, wildlife viewing, and the beaches and lakefront use sectors/activities during the periods covered, with the exception of the 20 year period for Lake Superior, where the damage would be low to moderate. Asian carp would likely have either negligible or no impact on recreational hunting, water use, commercial navigation, and oil and natural gas extraction activities.
Over time, the introduction of Asian carp to the Great Lakes basin could change the domination of lake ecosystems from native fish species to Asian carp, with the potential to damage the public image of these lakes regionally, nationally and internationally and to also harm the well-being of residents living close to this unique natural resource. The introduction of Asian carp species would damage subsistence harvests from the Great Lakes and reduce the social, cultural and spiritual values of the lakes and of lake-related activities. Quantitative assessments of these impacts, however, are not feasible due to a lack of pertinent information.
During the periods considered, there could be factors in the economy at work that might create counteracting forces on the impacts of Asian carp on communities, businesses, and individuals in the study area. Therefore, the net economic impacts could be counterbalanced at the regional and national levels, while remaining significant for the stakeholders (e.g. communities, harvesters, users), when taking into account the (re)distribution of income and employment as a consequence of change in the scale of activities in and around the Great Lakes basin.
The baseline values generated by activities in and around the Great Lakes basin should not be directly compared with those provided in the extant literature, because of differences in methodology followed by different studies. Methodologies varied in terms of scope, estimation procedures, time periods considered, and industries covered. Variances in estimations also arose due to considerations of whether to include both Canada and the US, and to secondary multiplier effects (indirect and induced) in appraising the baseline values, as well as the impacts.
The study had some limitations due to a lack of information. The most notable obstacles were: (i) lack of Great Lakes’ specific information by activity; (ii) forecasted values in 20 and 50 years were based on the values by activity for the most recent year assuming that the values would prevail for the time period covered if everything else remains the same; (iii) lack of a quantitative scale of ecological consequence that could directly link between ecological and socio-economic impacts, which could be applied to assess socio-economic impacts more accurately in a quantitative manner; and (iv) lack of adequate information to provide an incremental analysis showing a quantitative estimate or a range of estimates of the socio-economic impact of the presence of Asian carp.
These limitations were somewhat mitigated through the adoption of assumptions and the application of proxies from the extant literature, with suitable adjustments within the existing time constraints. However, the appropriate remedy would be further research. For example, in order to have a proper assessment of baseline value(s), a possible next step might be to undertake a comprehensive survey in the study area to obtain values being generated by activity and by lake (including willingness to pay and subsistence harvests). Similarly, for forecasting, estimation methodologies such as Computable General Equilibrium model, which try to identify parameters important to a decision or set of decisions in part to reflect welfare changes from complementarity and substitutability of key goods, may mitigate biases associated with forecasting.
Introduction
With the exception of Lake Michigan, the Great Lakes straddle the Canada-United States borderFootnote 3 and are the world's largest freshwater system. The Great Lakes basin, including watersheds,Footnote 4 covers an area of 766,000 square kilometres (295,700 square miles), an area larger than New Brunswick, Nova Scotia and Prince Edward Island combined. The shoreline of the five Great Lakes and the connecting rivers stretches for 17,000 kilometers (10,200 miles), long enough to reach nearly halfway around the world.Footnote 5 More than 11 million people – including 98% of Ontario’s residents and over 60 aboriginal communities - live within the Great Lakes basin (Ontario Ministry of Natural Resources [OMNR], 2010).Footnote 6
The Great Lakes and their watersheds are facing significant threats from the increasing number of aquatic invasive speciesFootnote 7 (AIS) that are weakening/threatening the health of the lakes, and affecting both activities linked to the lakes and the utilities they generate for the economy.Footnote 8 Asian carp, AIS from the North American perspective, are well-known to be responsible for significant impacts on native species and associated human activities, through ecological damage, habitat alterations and direct competition for resources.Footnote 9
The threat of Asian carp to the Great Lakes has attracted the attention of Canada, the province of Ontario, national and state governments of the United States (US), First Nations, the general public, industry associations and environmental non-governmental organizations.Footnote 10 Stakeholders (e.g. citizens in both Canada and the US, industries relying on the Great Lakes fishery, and non-governmental organizations, such as the Ontario Federation of Anglers and Hunters, and EcoJustice Canada,) are looking forward to appropriate measures to prevent the presence of Asian carp in the Great Lakes.
The Government of Canada’s Budget 2010 renewed approximately $4 million in funding from 2005 through the Aquatic Invasive Species Program,to facilitate an AIS monitoring system and to meet assessment needs, such as research funding, biological risk assessment, regulatory policy development. Additionally, in 2012, the Fisheries and Oceans Canada (DFO) allocated $17.5 million over five years to protect the Great Lakes from Asian carp under its Great Lakes Asian Carp Program. The funding has been directed tofour key activities: prevention, early warning, rapid response, and management and control.
As part of the Government of Canada’s initiatives, a bi-national (Canada -US) ecological risk assessment to address the Asian carp threat to the Great Lakes, led by the Centre of Expertise for Aquatic Risk Assessment (CEARA), DFO, has been carried out.Footnote 11 A necessary follow-up to the biological risk assessment is an assessment of the socio-economic impact of the establishment of Asian carp in the Great Lakes Basin, in order to provide decision-makers with information regarding the economic value that may be at risk and to assist in developing options that may be considered for prevention. The outcomes of this study will support the AIS objectives under DFO’s “Sustainable Fisheries and Aquaculture” strategic outcomes.Footnote 12
Objectives of the Study
The goal of this study is to provide a detailed socio-economic analysis of the economic impact to Canada of the establishment of Asian carp in the Great Lakes. The specific objectives of the study are to: (i) provide estimates of the economic value generated by the Great Lakes for Canada; and (ii) examine the economic impact/cost of the presence of Asian Carp in the Great Lakes for Canada.
Organization of the Study
The rest of the study is organized as follows: Chapter 1 presents an overview of the Great Lakes; Chapter 2 reviews the literature relevant to assessing the economic impact of the establishment of Asian carp in the Great Lakes; Chapter 3 presents the methodology adopted in the study; Chapter 4 presents the baseline values of activities in and around the Great Lakes by sector; Chapter 5 presents the social and cultural values associated with the Great Lakes; Chapter 6 presents a scenario based on the biological risk assessment; Chapter 7 presents the socio-economic impact assessment; and Chapter 8 draws conclusions.
Chapter 1: A Brief Overview of the Study Area
Socio-Demographic ProfileFootnote 13
In 2006, Ontario had a population of 12 million people, which was 38% of Canada’s total population (see Annex 1). Of the total population in Ontario, 2% (242,490) are of aboriginal identity, as compared to 4% for Canada.Footnote 14
Of Ontarians 15 years of age and older, 22% do not have a diploma or degree, as compared to 24% for Canada as a whole. The percentage of the province’s population of 15 years of age and older with a high school certificate or university diploma or degree is higher as compared to Canada (51% while the national figure was 48%).
The employment rate for Ontario is 94%, as compared to 93% for Canada overall. Manufacturing, business services and retail trade sectors employ most of the total experienced labour force age 15 years and over. The median of earnings of persons 15 years and over who work an entire year full-time in Ontario is $44,748, which was higher than the national average of $41,401.
A Brief Overview of the Great LakesFootnote 15
The Great Lakes hold 20% of the world’s fresh surface water and 95% of North America’s fresh surface water. They contain 22.8 quadrillion litres (or (22.8 x 10¹⁵) litres) of water, of which only 1% is renewable (Krantzberg et al., 2006). The Great Lakes provide drinking water to more than 8.5 million or 70% of Ontario residents (OMNR, 2010) and to 40 million people living in Canada and the US (OMNR, 2011). The Lakes support thousands of wetlands, and a variety of landscapes, plants, fish and wildlife (e.g. over 150 native species of fish and more than 50 native plant communities) (OMNR, 2011).Footnote 16
The Great Lakes also directly impact the lives of approximately 40 million people living in the Canadian provinces and US states that directly border them (OMNR, 2011). They support world-class commercial and recreational fisheries in both Canada and the US, provide recreation, serve as platforms for commercial transportation, and provide both tangible and intangible benefits to both Canadian and US residents. The Lakes provide water for factories and industries, wind power to create electricity, sources of oil and natural gas, and are shipping routes for iron ore, coal, and grain for overseas markets.
The Great Lakes basin is home to 98% of Ontario's population and supports 40% of Canada's economic activity (EC, 2010). More than 80% of the power generated in Ontario depends on the Great Lakes. Manufacturing industries accounted for 38.2% of total water intake from the Great Lakes basin and 14.0% from the St. Lawrence River basin (Statistics Canada, 2005). The Lakes support 25% of Canada's agricultural capacity and 45% of its industrial capacity (EC, 2010).
AIS Threats to the Great Lakes
The Great Lakes basin is facing significant threats from an increasing number of AIS. The AIS have historically been introduced to the Lakes through several vectors/sources of transmission and dispersion, including canals and international ship ballast water.Footnote 17 Commercial ships traveling only within the Great Lakes system facilitate the inter-lake spread of AIS through ballast water. Other known pathways include the aquaculture industry, aquarium trade, the live-food fish industry, recreational boating, sport fish stocking, bait bucket transfers, canals and waterways, and various horticultural practices.Footnote 18
In the past, AIS have severely damaged the Great Lakes and economic activities dependent on the Lakes, such as commercial and recreational fisheries. Other major activities significantly affected include beach and lakefront use, wildlife watching, recreational boating, and hunting. The vital changes experienced within Great Lakes ecosystems due to the introduction of AIS have been documented for decades (e.g. DFO, 2012; Marbek, 2010a). The major affected areas in the ecosystem services are nutrient availability, water clarity, and productivity, which result in negative impacts to the environment and to biodiversity, as well as to the surrounding economy and infrastructure.Footnote 19
Asian carp are well-known to be responsible for significant impacts on native species through both direct competition for resources and alterations to habitat. Asian carp can disrupt the balance of aquatic life in lakes/rivers, altering nutrient cycles, because of their aggressive eating behaviour, high reproductive rate, and lack of natural North American predators. This allows them to out-compete and crowd out native fish species, including fish that are popular for commercial and/or recreational fishing (EC, 2010, 2004; DFO, 2004; Kelly, Lamberti, and MacIsaac, 2009).
Four Asian carp species (bighead, black, grass, and silver carp) are found in the Mississippi watershed, two of which (bighead and silver carp) are known to have established breeding populations in that watershed.Footnote 20 Canada is highly vulnerable to Asian carp threats, as the species has a pathway to the Great Lakes from the Mississippi River through the Chicago Ship and Sanitary Canal (CSSC) via the Chicago Area Waterway System (CAWS).Footnote 21
Chapter 2: Literature Review
While a continuous effort has been made to improve the understanding of the impacts of AIS in the Great Lakes for the US economy (e.g. Felts, Johnson, Lalor, Williams, and Winn-Ritzenberg, 2010; Thomas, 2010; Austin, Anderson, Courant, and Litan, 2007; Leigh, 1998; and Ainsworth, 1977), until recently, comparatively less attention has been paid to measuring the impacts for Canada. Therefore, the extant literature provides very limited information for Canada. This section provides a summary of the extant literature that examines the economic aspects of invasive species threatening the Great Lakes from Canadian and/or US perspective.
Felts, Johnson, Lalor, Williams, and Winn-Ritzenberg (2010) examined the policy implications of AIS for the City of Milwaukee, and proposed that appropriate AIS policies balance the ecological responsibility, minimize economic damage by AIS, maximize Milwaukee’s economic vitality, and political feasibility. The report also concluded that in the short-term, the primary focus should be preventing AIS introductions from ships entering the Port of Milwaukee, while in the long-term, AIS management should also focus on managing and removing established AIS.
Using a bio-economic simulation model, Thomas (2010) conducted a cost-benefit analysis of preventative management for zebra and quagga mussels in the Colorado-Big Thompson system. The study showed that the boat inspection program was very effective, and almost entirely eliminated the possibility of invasion of the reservoir system. However, the benefits of reduced control costs to infrastructure were unlikely to exceed the costs of the boat inspection program, because the probability of invasion was likely to be low, even without the boat inspection program. The study also noted the following important limitations: (i) many benefits were omitted from the analysis; (ii) the scope of the analysis was limited; and (iii) the uncertainty inherent in the bio-economic model.
Employing specific improvements and aggregate improvement approaches, Austin et al. (2007) conducted a study to determine the costs and likely ecological impacts of restoring the Great Lakes,Footnote 22 and to estimate the economic benefits of those ecological impacts. The first approach identified the specific improvements in the environment expected from restoration, and then added up the individual estimates. The second approach estimated the increase in property values in all the areas likely to be affected by the restoration initiative.
Following those approaches, Austin et al. found that ecological restoration initiatives generated a present-value of the long-term economic benefits of over USD50 billion to the US economy.Footnote 23 In addition to these long-term economic benefits, the study estimated additional short-term benefits in the form of multiplier effects within the range of USD30 to 50 billion, primarily to the regional economy. However, the estimation did not capture the benefits of the development of new technologies and industries that would be generated by the investment in Great Lakes restoration.
Leigh (1998) evaluated the cost-effectiveness of alternate control strategies, and determined the economic value of enacting the ruffe control program for the Great Lakes fishery. Based on biometric changes that were projected to occur, the study showed that early control of a non-indigenous fish species such as ruffe, could result in significant returns on investment. Instituting a ruffe control program would, under a moderate-case projection of benefits, yield an estimated net public savings of USD513 million for the US over five decades up to 2050.
Using both market models of supply and demand and Structured Expert Judgement (based on relevant scientific research and their professional opinions), Rothlisberger, Finnoff, Cooke, and Lodge (2012) examined the impact of invasive species from ocean-going vessels on wildlife watching, raw water use, and commercial and sport fishing in the Great Lakes from the US perspective. Compared to a scenario of no ship-borne invasions, the study found that in the US waters, median damage aggregated across multiple (ecosystem) services was USD138 million/year, broken down as follows: commercial fishery - USD5.3 million; sport fishing - USD106 million (with a greater degree of uncertainty in impact distributions); and raw water useFootnote 24 - USD27 million (median additional operating costs aggregated over all Great Lakes facilities). The study also noted that the negative impact of invasive species on sport fishing alone might be as high as USD800 million, with a 5% probability.
Employing the hedonic property-value method, Zhang & Boyle (2010) found that as Eurasian watermilfoil (an invasive aquatic weed) infested in selected Vermont lakes, adding to the total macrophyte (an aquatic plant that grows in or near water) growth, property values could diminish by less than 1% to as high as 16%, with incremental increases in the infestation level.
Braden, Won, Taylor, Mays, Cangelosi, and Patunru (2008) estimated the economic benefits of remediation of an AOC in the Sheboygan River, Wisconsin, using hedonic analysis and a survey-based method. Hedonic analysis found that for owner-occupied homes within a 5-mile radius of the Sheboygan River AOC, the overall estimated loss of property value was USD158 million (8% of market value). The impacts were proportionally greatest for properties closest to the AOC. A survey-based method yielded a mean estimate of USD218 million (10% of property value) in willingness to pay (WTP) for full cleanup of the AOC.
Results of a separate study (Braden et al., 2008) focusing on an AOC on the Buffalo River, New York, showed that after controlling for numerous structural, community, and spatial effects, single-family residential property prices south of the river were depressed due to their proximity to the AOC by USD118 million (5.4% of total market value). Considering only the area for which the market study showed price discounts, the survey-based estimates revealed a WTP for full cleanup of the AOC of approximately USD250 million (14% of median-based market value).
On the Canadian north shore of Lake Erie, using contingent valuation methodology (a methodology used to estimate economic values of ecosystem and environmental services) on 703 users of the public marsh at Long Point and Point Pelee in 1978, Kreutzwiser (1981) found that recreational users spent a total of $119,000 to receive wetland benefits that were estimated to have a contingent value of $213,000 and generated directly and indirectly $225,000 in local spending (e.g. travel, food, accommodation) per year implying a return of 179%.
As indicated above, literature assessing the (net) economic impact of AIS in the Great Lakes for the Canadian economy is substantially less as compared to that for the US. Most of the Canadian studies (e.g. Genesis Public Opinion Research Inc., 2007; and EC, 2000) were undertaken from either a provincial or national perspective, and remarkably few studies (e.g. DFO, 2008; Krantzberg et al., 2008, 2006) highlighted the economic contributions of the Great Lakes for Canada by activity and/or area. The present study will discuss the pertaining literature by activity in Chapter 5.
Chapter 3: Methodology Adopted
This study aims to evaluate the socio-economic impact of the presence of Asian Carp in the Great Lakes Basin in Canada. This was done in two steps: Firstly, baselines values (by sector and aggregated) of all the economic activities in and around the Great Lakes have been estimated which provided the foundation for a quantitative discussion of the magnitude of values that might be impacted. It should be noted that while developing the baseline values the study deferred from speculating whether a particular activity would be impacted or not by the presence of Asian carp.; Secondly, the results from the bi-national ecological risk assessment (henceforth DFO (2012)) which was discussed below and in Chapter 6 in details) led by CEARA, DFO, have been used to determine the activities impacted.
The analytical principles set down in Treasury Board of Canada Secretariat (2007) guided the analysis. They are: (i) all feasible options, including the status quo, are considered; (ii) impacts that cannot be expressed in quantitative values are discussed qualitatively; and (iii) non-market values are considered (and can be gauged based on existing or similar data gleaned from the literature).
The methodology adopted for the analysis is the Total Economic Valuation (TEV) technique, which relates all benefits to human welfare measures. The economic valuation method was chosen because (i) it is defined as the sum of benefits involved and can be used to assess economic benefits quantitatively or qualitatively; (ii) it allows for a robust measurement and comparison of values and presents these values in terms that people are familiar with; and (iii) it is both logical and comprehensive, due to its foundations in microeconomic theory, emphasis on marginal values, and inclusion of all aspects of the associated values. Moreover, since the TEV approach is followed by economists in valuing environmental goods and services, the relevant literature could be consistently analyzed using this framework.
In the study, the TEV framework considers that the benefits provided by the Great Lakes are linked to both use and non-use values:
TEV = Use Value + Non-use Value
The use values are subdivided into current and future use values. Current use values are sub-categorized as direct and indirect use values. Finally, direct use values are sub-categorized as extractive and non-extractive use values. Based on the TEV framework developed by EnviroEconomics (2011), a revised chart showing the total economic values, along with definitions for all categories and sub-categories of values, is provided in Matrix 1.
Under the category of use values, extractive use values include activities such as commercial and recreational fishing, and non-extractive use values include activities such as wildlife watching and beach use. Indirect use values generally include ecosystem services and biodiversity. The future use values include option value to use the resource in future for commercial and/or recreational activities, as well as possible sources of research value. Finally, non-use values include bequest value (also known as legacy value) and existence value.Footnote 25
In order to estimate the economic value of the Great Lakes to Canada and the impact should Asian carp establish in those lakes, the study includes estimates of: (a) the expenditures at market values, and (b) the consumer surplus generated by major activities, based on information obtained from extant literature.
The analysis was carried out as follows:
- A situational overview of the study area was provided.
- The scenarios and available options were considered.
- Available information was interpreted and quantified to convert into values, whenever feasible, based on a feasible time horizon for the analysis.
- Information was analyzed for the biological and economic impacts for each option.
- The values were adjusted using the present value approach.Footnote 26
AIS can lead to significant ecosystem alterations, including general reductions in biodiversity (DFO, 2012) and accelerated extinction rates of native species. The full effects and consequences of AIS sometimes take decades to emerge (Wilson, 1992).Footnote 27 In alignment with DFO (2012),Footnote 28 this study assumes that following the arrival of Asian carp, it would take seven (7) years for the impact to be felt in the area where they are present. Therefore, the time periods considered for impact assessments begin in 2018, and are for intervals of 20 years and 50 years as the study uses 2011 as the base year.
The study extrapolated baseline values to the base year of 2011 using the inflation rate, given that the data pertained to different years. For the socio-economic impact assessment, adjustments are necessary because future losses are worth less than current losses. Money today, even in an inflation-free economy, is always worth more than money obtained in the future, because of its earning potential as well as the psychic gratification of having money now rather than tomorrow. Therefore, the discounting of future impact was performed according to the Treasury Board of Canada’s recommendation of 3%. This rate represents the social opportunity cost.Footnote 29 The discount formula used for present value is:
PV =FVt /(1+i)t
PV is the present/current value, FVt the future value in year t, and i is the discount rate.
Data Sources
The data used to develop the community profiles around the Great Lakes primarily came from Statistics Canada. The scenario followed for the study and the assumptions made were based on information derived from DFO (2012) which incorporated existing, ongoing, and new research results to inform the potential for Asian carp arrival, survival, establishment, spread and impact in the Great Lakes. As discussed in Chapter 2, while the extant literature provides very limited data on AIS for the Canadian side of the Great Lakes, where appropriate, the study used information available at relevant websites and in the literature as secondary sources of information. Moreover, where information on a particular impact was unavailable, the study used proxies based on rational judgment from the findings of studies in comparable situations with appropriate adjustment(s) as necessary, or made a qualitative assessment of the impact.
One of the major challenges encountered by the study was that the biological risk assessments expressed consequences that could not be unambiguously linked to socio-economic impact analysis. Establishing a linkage between ecological risk assessment and human risk has historically been challenging due to uncertainties in terms of the direction and the rate of change in environmental and human behavior. Therefore, in addition to results extracted from the ecological risk assessment, the study greatly benefitted from expert opinion exchanged through personal communications between a group of science experts involved in the ecological risk assessment and economists involved in the socio-economic study of the presence of Asian carp in the Great Lakes. This discourse helped to provide a defensible foundation for the socio-economic impact assessment.
Since there is no feasible way to separate out the impact from the presence of Asian carp into the Great Lakes and from other influences in the economy (e.g. climate change, urbanization), the analyses in the study were premised on scenarios both with, and without, the presence of Asian carp, holding other variables unchanged. For instance, the study projected that the reductions in native fish populations would be solely caused by Asian carp. Other changes and/or developments in the economy that might alter the native fish biomass in the Great Lakes were assumed to be absent during the period of analysis.Footnote 30
It is also important to recognize that projections of the extent and degree of impact caused by AIS are problematic because scientists rarely find opportunities to predict impact in relatively undisturbed environments. Consequently, because of the inherent uncertainties, the socio-economic impact reported in the study is mostly speculative, providing the best estimates from available research. Furthermore, since the ecological risk assessment delivered the foundation for the socio-economic assessment, the uncertainties associated with the socio-economic assessment must be greater than, or equal to, that of the ecological risk assessment.
Scope of the Study
The scope of this socio-economic study aligns with the scenario provided by the DFO (2012), particularly in terms of the impact of the presence of Asian carp, and includes:
- an overview of the Great Lakes;
- a range of estimates of the economic value of the Great Lakes to Canada;
- a review of relevant literature, to gauge the extensiveness of the research and data availability on the issue being addressed, and to adopt an appropriate methodology. The literature particularly focused on the types of activities considered, the methodology adopted and the results;
- a discussion of the methodology used in the study;
- a description of the baseline scenario, based on the available quantitative and qualitative information, and an attempt to reduce and/or eliminate any gaps. The baseline scenario included the current direct human use of the study area and the future trend, non-market value (e.g. ecosystem value), a profile of local demographics, and a description of the current level of protection already in place for the period of analysis chosen for the study. The baseline scenario provided a comprehensive socio-economic and ecosystem value of the study area;
- identification and documentation of the major activities, environmental elements, and stakeholders that would be affected by the presence of Asian carp;
- a description and quantification of the particular impacts that are expected to be experienced. Qualitative descriptions of the impacts were provided if they were not quantifiable and/or if no feasible proxies were available;
- sensitivity analyses based on discount rate and other uncertainties to be identified in the analyses; and
- identification of the uncertainties and shortcomings of the analysis.
Chapter 4 - Baseline Values of Activities around the Great Lakes
This chapter provides the situational overview, estimating the economic values to Canada generated by the major activities in and around the Great Lakes. As stated in Chapter 3, the values in aggregate provide a baseline value of the major activities from which the impact of Asian carp in the Great Lakes is estimated.
Based on relevant literature, the study identified the following major activities for the development of the baseline: (i) water use; (ii) commercial fishing; (iii) recreational fishing; (iv) recreational hunting; (v) recreational boating; (vi) beaches and lakefront use; (vii) wildlife viewing; and (viii) commercial navigation. In order to estimate the economic values of the above-mentioned activities, the study tried to arrive at the best estimates of the expenditures made, as well as the consumer surplus generated by the identified activities, as information from extant literature permitted (see Matrix 3).
The following portion of the chapter provides a detailed discussion of the methods applied and then estimates the economic values of activities around the Great Lakes in Canada.
Water Use
Canadians consistently rank water as this country’s most important asset (Renzetti, Dupont and Wood, 2011). Water withdrawn from the Great Lakes is used in neighbouring municipalities and supplied to homes, businesses, and institutions like schools and hospitals for a diverse range of activities, such as drinking, washing, gardening, fire-fighting and landscape irrigation. In the manufacturing and agricultural sectors, water is used as raw material to support the production of goods and services. Water is also used for electricity generation (heating/cooling), oil/gas extraction, and mining (e.g. cleaning ore, cooling drills).
The Great Lakes Commission (2010) categorized water use from the Great Lakes basin as follows: (i) public water supply; (ii) self-supply domestic; (iii) self-supply irrigation; (iv) self-supply livestock; (v) self-supply industrial; (vi) self-supply thermoelectric power; (vii) self-supply hydroelectric power; and (viii) self-supply other.
According to the Great Lakes Commission (2010), approximately 850.5 billion gallons of water was withdrawn from the Great Lakes basin per day in 2008, of which almost 24% was withdrawn in Ontario (203.24 billion gallons per day). Of the total withdrawal in Ontario, hydroelectric use accounted for 93%. The remaining 13,697.1 million gallons per day was distributed as follows: nuclear plants, 74%; fossil fuel power, 11%; industrial users, 7%; public water supply, 6%; domestic (residential, commercial, institutional) and agricultural users, 1%; and other,Footnote 31 1%.Footnote 32 In Québec, of the total water withdrawals of 305.2 billion gallons per day from the St. Lawrence River basin, hydroelectric power accounts for 304 billion per day (99.6%). The remaining 14 billion gallons per day was distributed as follows: public supply (residential, commercial, and institutional), 81%; industrial users, 9%; domestic supply, 5%; fossil fuel power, 3%; and agricultural users, 2%.
The valuations of water used from the Great Lakes basin provided in this section are based on consumption and withdrawal data primarily taken from the Great Lakes Commission (2010) and on water use values information compiled from literature review.Footnote 33
Raw Water UseFootnote 34
Twenty four million people drink water that is drawn from the Great Lakes every day (U.S. Environmental Protection Agency, 2003). The Great Lakes Commission (2010) estimated that Ontario’s annual water withdrawal and consumption by public sector and self-supply domestic categories were 1,203 and 180 million m3, respectively. In Quebec, total withdrawal and consumptive use were 1,618.8 and 161.7 million m3, respectively (see Table 1).
Description
Table 1 is titled “Estimated Raw Water Withdrawal and Consumption by Use/Lake/Province for the Year 2008” and is sourced from the Great Lakes Commission (2010). Table 1 has four columns. The first column is captioned “Name of the Lake”; the second “Public Sector (Mil. M3/Year) with two sub-columns captioned “Withdrawal” and “Consumption” the third is “Self-Supply (Mil. M3/Year)” with two sub-columns captioned “Withdrawal” and “Consumption”; and the fourth is “Total (Mil. M3/Year)” with two sub-columns captioned “Withdrawal” and “Consumption.” There are 9 rows. Row 1 is “Ontario” in bold, denoting the entire region, under which fall five sub-regions. The values for Ontario are 1,054.2 for public sector withdrawal and 158.1 for public sector consumption; 149.1 for self-supply withdrawal and 22.4 for self-supply consumption; and 1,203.3 for total withdrawal and 180.5 for total consumption. Row 2 is the St. Lawrence, the first sub-region of Ontario. The values for the St. Lawrence are 100.9 for public sector withdrawal and 15.1 for public sector consumption; 15.8 for self-supply withdrawal and 2.4 for self-supply consumption; and 116.7 for total withdrawal and 17.5 for total consumption. Row 3 is Lake Ontario, the second sub-region of Ontario. The values for Lake Ontario are 643.8 for public sector withdrawal and 96.6 for public sector consumption; 88.7 for self-supply withdrawal and 13.3 for self-supply consumption; and 732.4 for total withdrawal and 109.9 for total consumption. Row 4 is Lake Eerie, the third sub-region of Ontario. The values for Lake Eerie are 129.7 for public sector withdrawal and 19.5 for public sector consumption; 27.6 for self-supply withdrawal and 4.1 for self-supply consumption; and 157.3 for total withdrawal and 23.6 for total consumption. Row 5 is Lake Huron, the fourth sub-region of Ontario. The values for Lake Huron are 116.6 for public sector withdrawal and 17.5 for public sector consumption; 14.7 for self-supply withdrawal and 2.2 for self-supply consumption; and 131.2 for total withdrawal and 19.7 for total consumption. Row 6 is Lake Superior, the fifth and final sub-region of Ontario. The values for Lake Superior are 63.2 for public sector withdrawal and 9.5 for public sector consumption; 2.4 for self-supply withdrawal and 0.4 for self-supply consumption; and 65.7 for total withdrawal and 9.9 for total consumption. Row 7 is “Quebec” in bold, denoting the entire region, under which there is one sub-region. The values for Quebec are 1519.9 for public sector withdrawal and 151.8 for public sector consumption; 98.9 for self-supply withdrawal and 9.9 for self-supply consumption; and 1618.8 for total withdrawal and 161.7 for total consumption. Row 8 is the St. Lawrence, the only sub-region for Quebec. The values for the St. Lawrence are the same as for Quebec: 1519.9 for public sector withdrawal and 151.8 for public sector consumption; 98.9 for self-supply withdrawal and 9.9 for self-supply consumption; and 1618.8 for total withdrawal and 161.7 for total consumption. Row 9 is the grand total for both regions and their sub-regions. The grand total values are 2574.1 for public sector withdrawal and 310.0 for public sector consumption; 248.0 for self-supply withdrawal and 32.2 for self-supply consumption; and 2822.1 for total withdrawal and 342.2 for total consumption.
| Name of the Lake | Public Sector (Mil. M3/Year) | Self-Supply (Mil. M3/Year) | Total (Mil. M3/Year) | ||||
|---|---|---|---|---|---|---|---|
| Withdrawal | Consumption | Withdrawal | Consumption | Withdrawal | Consumption | ||
| Ontario | 1,054.2 | 158.1 | 149.1 | 22.4 | 1,203.3 | 180.5 | |
| St. Lawrence | 100.9 | 15.1 | 15.8 | 2.4 | 116.7 | 17.5 | |
| Lake Ontario | 643.8 | 96.6 | 88.7 | 13.3 | 732.4 | 109.9 | |
| Lake Erie | 129.7 | 19.5 | 27.6 | 4.1 | 157.3 | 23.6 | |
| Lake Huron | 116.6 | 17.5 | 14.7 | 2.2 | 131.2 | 19.7 | |
| Lake Superior | 63.2 | 9.5 | 2.4 | 0.4 | 65.7 | 9.9 | |
| Quebec | 1,519.9 | 151.8 | 98.9 | 9.9 | 1,618.8 | 161.7 | |
| St. Lawrence | 1,519.9 | 151.8 | 98.9 | 9.9 | 1,618.8 | 161.7 | |
| Grand Total | 2,574.1 | 310.0 | 248.0 | 32.2 | 2,822.1 | 342.2 | |
Source: The Great Lakes Commission (2010)
In terms of the economic value of drinking water, Statistics Canada estimated that, in 2007, the operating and maintenance costs of treating 180.5 million cubic metres of raw intake water from the Great Lakes basin was approximately $260 million (Marbek, 2010b). Assuming that water revenue structures closely reflect the full cost of water production, the present study inflation-adjusted the 2007 value of $260 million to determine the present value of drinking water derived from the Great Lakes, as follows:
Estimated Value of Drinking Water in Ontario (EVDW) = C2007 * π(2011/2007)
Where C is the cost of water production and π is inflation rate.
To calculate the value of water consumption from the Great Lakes basin in Quebec, the study first calculated the unit costs of raw intake water from Statistics Canada’s estimate of the operating and maintenance costs of water intake from the Great Lakes basin in Ontario, and then applied the unit costs to consumption data for Quebec as follows:
Estimated Value of Drinking Water in Quebec (EVDW) = Q2011 * UC2007 * π(2011/2007)
Where Q is consumption, UC is the unit cost of water production and π is inflation rate. Following this approach, the total economic contributions of the Great Lakes raw water consumption is estimated to be in the amount of $531.7 million/year (Ontario - $280.4 and Quebec - $232.8).
Industrial WaterFootnote 35
Water from the Great Lakes is also used as input in a variety of industrial sectors. Using data for 2000, the Great Lakes Commission (2010) estimated that Ontario’s industrial users withdrew 1,275.6 million m3 of water from the Great Lakes and consumed 80.4 million m3 each year. In Quebec, total withdrawal and consumptive use were 173.4 and 17.3 million m3, respectively (Table 2).
Description
Table 2 is titled “Estimated Industrial Withdrawal and Consumption of Water by Province/Lake for the Year 2008” and is sourced from the Great Lakes Commission (2010). Table 2 has two columns. The first column is captioned “Name of the Lake” and the second “Industry (Mil. M3/Year)” with two sub-columns captioned “Withdrawal” and “Consumption.” The table has 9 rows and is broken down the same way as Table 1 with the two main regions of Ontario and Quebec and their sub-regions. Row 1 is Ontario with a withdrawal value of 1275.6 and a consumption value of 80.4. Row 2 is the St. Lawrence with a withdrawal value of 222.2 and a consumption value of 14.0. Row 3 is Lake Ontario with a withdrawal value of 317.3 and a consumption value of 20.0. Row 4 is Lake Eerie with a withdrawal value of 249.3 and a consumption value of 15.7. Row 5 is Lake Huron with a withdrawal value of 262.8 and a consumption value of 16.6. Row 6 is the Lake Superior with a withdrawal value of 224.0 and a consumption value of 14.1. Row 7 is Quebec with a withdrawal value of 173.4 and a consumption value of 17.3. Row 8 is the St. Lawrence with a withdrawal value of 173.4 and a consumption value of 17.3. Row 9 is the grand total with a withdrawal value of 1448.9 and a consumption value of 97.7.
| Name of the Lake | Industry (Mil. M3/Year) | |
|---|---|---|
| Withdrawal | Consumption | |
| Ontario | 1,275.6 | 80.4 |
| St. Lawrence | 222.2 | 14.0 |
| Lake Ontario | 317.3 | 20.0 |
| Lake Erie | 249.3 | 15.7 |
| Lake Huron | 262.8 | 16.6 |
| Lake Superior | 224.0 | 14.1 |
| Quebec | 173.4 | 17.3 |
| St. Lawrence | 173.4 | 17.3 |
| Grand Total | 1,448.9 | 97.7 |
Source: The Great Lakes Commission (2010)
Pertaining to industrial water use value, using data for Canadian business sector industries for the period 1981-1996, Dachraoui and Harchaoui (2004) estimated that the shadow priceFootnote 36 of water intake was $0.73/m3 and varied significantly across industries. The value is reported to be slightly lower than that estimated for the top seven water using industries ($0.76/m3).Footnote 37
In order to estimate the value of water provided to industrial facilities in the Great Lakes, the present study multiplied the consumption data provided by the Great Lakes Commission (2009) with the average value of water intake estimated by Dachraoui et al. (2004), after adjusting for inflation, as followsFootnote 38:
Estimated Value of Industrial Water (EVIW) = Q2011 * (V1996 * π(2011/1996))
Where Q is consumption, π is inflation rate, and V is the average value of water intake. Following this approach, the economic contributions of the Great Lakes water consumption by industrial sector in Canada is estimated to total $96.4 million/year (Ontario - $79.3, Quebec - $17.1).
Agricultural WaterFootnote 39
In the agricultural sector, water from the Great Lakes basin is used by farms as input into the production process, livestock watering and irrigation. About one-third of the land located in the Great Lakes basin is used for agriculture. This amounts to nearly 25% of the total Canadian agricultural production (including dairy, grain, corn, livestock, and a variety of orchards, vineyards and other specialty crops) being supported by the Great Lakes.Footnote 40
The Great Lakes Commission (2010) estimated that the agricultural sector withdrew a total of 110.3 million gallons per day of water for irrigation and livestock uses from the Great Lakes basin. The following table provides water withdrawal data for irrigation and livestock purposes by province and lake:
Description
Table 3 is titled “Estimated Agricultural Water Withdrawal and Consumption by Use/Lake/Province 2008” and is sourced from The Great Lakes Commission (2010). All consumption data is sourced from a Staff estimation, Policy and Economics, Fisheries and Oceans Canada, based on consumption coefficient data provided in The Great Lakes Commission (2010). Table 3 has four columns. The first column is captioned “Name of the Lake”; the second is “Irrigation (Mil. M3/Year)” with two sub-columns captioned “Withdrawal” and Consumption”; the third is “Livestock” (Mil. M3/Year)” with two sub-columns captioned “Withdrawal” and Consumption”; and the fourth is is “Total” (Mil. M3/Year)” with two sub-columns captioned “Withdrawal” and Consumption.” There are 9 rows with the main regions of Ontario and Quebec and their sub-regions. Row 1 is Ontario with an irrigation withdrawal value of 101.2 and an irrigation consumption value of 78.9; a livestock withdrawal value of 50.9 and a livestock consumption value of 40.7; a total withdrawal value of 152.0 and a total consumption value of 119.6. Row 2 is the St. Lawrence with an irrigation withdrawal value of 3.2 and an irrigation consumption value of 2.5; a livestock withdrawal value of 8.2 and a livestock consumption value of 6.5; a total withdrawal value of 11.4 and a total consumption value of 9.1. Row 3 is Lake Ontario with an irrigation withdrawal value of 24.5 and an irrigation consumption value of 19.1; a livestock withdrawal value of 7.5 and a livestock consumption value of 6.0; a total withdrawal value of 32.0 and a total consumption value of 25.1. Row 4 is Lake Eerie with an irrigation withdrawal value of 44.0 and an irrigation consumption value of 34.3; a livestock withdrawal value of 18.3 and a livestock consumption value of 14.6; a total withdrawal value of 62.3 and a total consumption value of 48.9. Row 5 is Lake Huron with an irrigation withdrawal value of 28.9 and an irrigation consumption value of 22.5; a livestock withdrawal value of 16.8 and a livestock consumption value of 13.4; a total withdrawal value of 45.7 and a total consumption value of 36.0. Row 6 is Lake Superior with an irrigation withdrawal value of 0.5 and an irrigation consumption value of 0.4; a livestock withdrawal value of 0.2 and a livestock consumption value of 0.2; a total withdrawal value of 0.7 and a total consumption value of 0.6. Row 7 is Quebec with an irrigation withdrawal value of 12.7 and an irrigation consumption value of 11.5; a livestock withdrawal value of 26.4 and a livestock consumption value of 21.1; a total withdrawal value of 39.1 and a total consumption value of 32.6. Row 8 is the St. Lawrence with an irrigation withdrawal value of 12.7 and an irrigation consumption value of 11.5; a livestock withdrawal value of 26.4 and a livestock consumption value of 21.1; a total withdrawal value of 39.1 and a total consumption value of 32.6. Row 9 is the grand total with an irrigation withdrawal value of 113.9 and an irrigation consumption value of 90.4; a livestock withdrawal value of 77.2 and a livestock consumption value of 61.8; a total withdrawal value of 191.1 and a total consumption value of 152.2.
| Name of the Lake | Irrigation (Mil. M3/Year) | Livestock (Mil. M3/Year) | Total (Mil. M3/Year) | |||
|---|---|---|---|---|---|---|
| Withdrawal | Consumption* | Withdrawal | Consumption* | Withdrawal | Consumption* | |
| Ontario | 101.2 | 78.9 | 50.9 | 40.7 | 152.0 | 119.6 |
| St. Lawrence | 3.2 | 2.5 | 8.2 | 6.5 | 11.4 | 9.1 |
| Lake Ontario | 24.5 | 19.1 | 7.5 | 6.0 | 32.0 | 25.1 |
| Lake Erie | 44.0 | 34.3 | 18.3 | 14.6 | 62.3 | 48.9 |
| Lake Huron | 28.9 | 22.5 | 16.8 | 13.4 | 45.7 | 36.0 |
| Lake Superior | 0.5 | 0.4 | 0.2 | 0.2 | 0.7 | 0.6 |
| Quebec | 12.7 | 11.5 | 26.4 | 21.1 | 39.1 | 32.6 |
| St. Lawrence | 12.7 | 11.5 | 26.4 | 21.1 | 39.1 | 32.6 |
| Grand Total | 113.9 | 90.4 | 77.2 | 61.8 | 191.1 | 152.2 |
Source: The Great Lakes Commission (2010).
Note: * Staff estimation, Policy and Economics, Fisheries and Oceans Canada, based on consumption coefficient data provided in The Great Lakes Commission (2010).
In terms of the value of water used for these agricultural sector purposes, a few studies (e.g. Dachraoui and Harchaoui, 2004; Bruneau, 2007) provided estimates of the value of water used for these purposes in the southern Saskatchewan region of Canada. Using an economic rent approach, Gardner Pinfold (2006), estimated that the average short-run and long run values of water use to be $0.06/m3 and $0.014/m3, respectively, in the South Saskatchewan River basin area. Samarawickrema and Kulshreshtha (2008) estimated that the short-run and long-run estimates of irrigation water use range from $0.017 - $0.088/m3 and $0.010 - $0.068/m3, respectively, in a number of sub-basins in the South Saskatchewan River basin.
Using a residual imputation method, Bruneau (2007) estimated the values of water withdrawn for a variety of reasons (e.g. irrigation, livestock) in the South Saskatchewan River basin. The values presented in the study (20 to 100 times more than the average household pays) showed the value-added per unit of water used in livestock production, under the assumption that livestock owners, faced with a water shortage, would be forced to reduce their herds.Footnote 41 Therefore, the values may be treated as the maximum WTP of the owners to obtain water and as upper estimates, as the entire net value was attributed to water input and excluded other unmeasured inputs also critical to production (Bruneau, 2007). Using data for Canadian business sector industries for the period 1981-1996, Dachraoui et al. (2004) estimated that the shadow price of water intake for agricultural and related service sector was $0.46/m3.
Estimates of the value of water used in irrigation for a variety of crops in the Big Creek watershed in southern Ontario were provided by To (2006), cited in Marbek (2010b). Using the average market crop price received by producers from 2000-2004, the study calculated the loss in profitability in the short-term due to a decrease in water, assuming fixed costs. These estimates ranged from $3.79/m3 for ginseng, to 0.22/m3 for sweet corn.
Given that estimates of water use values for irrigation/livestock purposes vary by geographic location (Bruneau, 2007), and to maintain consistency in the estimation of the value of water used from the Great Lakes for other purposes discussed above (e.g. industrial use), the study at hand refrained from using value estimations from a few studies in other regions in Canada.
Therefore, to estimate the values of water withdrawn for irrigation and livestock from the Great Lakes, an inflation adjusted average ($1.10/m3) of the estimates of the short-run values of water for irrigation provided by To (2006) was used.Footnote 42 As a result, the estimated values should be considered as very conservative estimates of the water use values.
Estimated Value of Agricultural Water (EVAW) = Value of Irrigation Water + Value of Livestock Water
(i) Value of Irrigation Water = QI x (VI2004 x π(2011/2004))
(ii) Value of Livestock Water = QL x (VL2004 x π(2011/1996))
Where Q is quantity, π is inflation rate, and V is water use value. Following this approach, the economic contributions to Canada of the Great Lakes water consumption by the agricultural sector is estimated to be in the amount of $164.7 million/year (Ontario - $131.9 (Irrigation $87.0, Livestock $44.9) and Quebec - $32.8 (Irrigation $11.5, Livestock $21.3)).
Commercial Fishing
The Ontario Ministry of Natural Resources (OMNR) is responsible for regulating Ontario’s commercial fishery. There are more than 500 active commercial fishing licences in OntarioFootnote 43 and, in 2011, approximately 12,141t of fish were commercially caught from the Great Lakes, generating an estimated landed value of $33.6 million. OMNR (2010) estimated that, in 2008, Ontario's commercial licence holders caught nearly 14,808t of fish, for which the dockside/wholesaleFootnote 44 value was $29.2 million. Once the fish has been processed and sent to food stores and restaurants in Ontario, the US and around the world, the industry’s total contribution to the economy in 2008 was in the range of $180 - $215 millionFootnote 45, with an average value of $197.5 million. This implies that the value added to the landings by the processors resulted in a value more than six times higher than the dockside value.
However, neither the existing data nor the literature provides the total economic value (e.g. WTP) of commercial fishing generated for the Canadian economy.Footnote 46 With respect to the contributions of the Great Lakes commercial fishery, it should be noted that since the fishing industry is fairly competitive because of the availability of close substitute goods (e.g. fish from other parts of Canada or meat), the associated consumer surplus could be safely assumed to be insignificant.
Therefore, to calculate the economic contributions of commercial fishing in the Great Lakes, the present study tallies only the market values of the landings, calculated by applying the ratio of market value to dockside value (as mentioned above) to the landed value for the year 2011, as follows:Footnote 47
Estimated Market Value of Commercial Fishing (EVCF) = LV * M/D
Where LV is landed value; M and D are market and dockside prices. Following this approach, the economic contributions of commercial fishing in the Great Lakes to the Canadian economy is estimated to be $226.5 million per year.Footnote 48
Recreational Fishing
There are a number of sources (e.g. Austin et al., 2007; DFO, 2008; EC, 2000) that estimated the value of recreational fishing in the Great Lakes, employing different methodologies, such as survey question sequencing or Nested Logit models. For Canada, the most relevant and recent information on expenditures incurred for recreational fishing estimated in DFO (2008) employs travel costs and expenditures for fishing trips to estimate the contributions of recreational fishing in the Great Lakes. Moreover, the consumer surplus value associated with recreational fishing that is not captured by expenditures is reported in EC (2000).
In terms of expenditures, DFO (2008) estimated that anglers spent a total of $214.6 million in Canada in direct recreational fishing expenditures in the Great Lakes in 2005, which was 25.1% and 8.7% of the totals of $856.2 million (weighted) and $2.5 billion direct expenditures on recreational fishing activities in Ontario/Quebec and in Canada, respectively.Footnote 49
Description
Table 4 is titled “Direct Recreational Fishing Expenditures ($Mil.) Made by All Anglers by Lakes/Types, 2005” and the data is sourced from DFO’s 2005 Survey of Recreational Fishing in Canada. Table 4 has eight columns. The first column is captioned “Name of the Lakes”; the second “Packages”; the third “Food & Accommodation”; the fourth “Fees” with a note that it includes campsites, licences and access fees; the fifth “Travel”; the sixth “Boating Expenses” with a note that it includes household boat costs, boat rentals and supplies; the seventh “Other Expenses” with a note that it includes expenses such as travel and guides; and the eighth “Total”. The table has seven rows. Row 1 is Superior with $4.1 million in Packages; $5.2 million in Food & Accommodation; $1.3 million in Fees; $3.3 million in Travel; $3.0 million in Boating Expenses; and $0.1 million in Other Expenses for a Total of $17.1 million. Row 2 is Huron with $5.9 million in Packages; $30.3 million in Food & Accommodation; $7.5 million in Fees; $18.3 million in Travel; $29.4 million in Boating Expenses; and $0.7 million in Other Expenses for a Total of $92.1 million. Row 3 is Eerie with $1.7 million in Packages; $7.9 million in Food & Accommodation; $5.0 million in Fees; $7.6 million in Travel; $10.9 million in Boating Expenses; and $0.2 million in Other Expenses for a Total of $33.4 million. Row 4 is Ontario with $1.4 million in Packages; $11.4 million in Food & Accommodation; $5.3 million in Fees; $10.0 million in Travel; $16.3 million in Boating Expenses; and $0.7 million in Other Expenses for a Total of $44.9 million. Row 5 is Lake St. Clair with $1.3 million in Packages; $2.9 million in Food & Accommodation; $1.4 million in Fees; $2.8 million in Travel; $4.7 million in Boating Expenses; and $0.8 million in Other Expenses for a Total of $13.9 million. Row 6 is the St. Lawrence with $0.8 million in Packages; $4.2 million in Food & Accommodation; $1.2 million in Fees; $2.5 million in Travel; $4.0 million in Boating Expenses; and $0.5 million in Other Expenses for a Total of $13.2 million. Row 7 is the Great Lakes with $15.2 million in Packages; $62.0 million in Food & Accommodation; $21.6 million in Fees; $44.5 million in Travel; $68.3 million in Boating Expenses; and $3.0 million in Other Expenses for a Total of $214.6 million.
| Name of the Lakes | Packages | Food & Accommodation | Fees* | Travel | Boating Expenses** | Other Expenses*** | Total |
|---|---|---|---|---|---|---|---|
| Superior | $4.1 | $5.2 | $1.3 | $3.3 | $3.0 | $0.1 | $17.1 |
| Huron | $5.9 | $30.3 | $7.5 | $18.3 | $29.4 | $0.7 | $92.1 |
| Erie | $1.7 | $7.9 | $5.0 | $7.6 | $10.9 | $0.2 | $33.4 |
| Ontario | $1.4 | $11.4 | $5.3 | $10.0 | $16.3 | $0.7 | $44.9 |
| Lake St. Clair | $1.3 | $2.9 | $1.4 | $2.8 | $4.7 | $0.8 | $13.9 |
| St. Lawrence | $0.8 | $4.2 | $1.2 | $2.5 | $4.0 | $0.5 | $13.2 |
| Great Lakes | $15.2 | $62.0 | $21.6 | $44.5 | $68.3 | $3.0 | $214.6 |
Source: Survey of Recreational Fishing in Canada 2005, DFO.
Notes: * Includes campsite, licences, and access fees; ** Includes household boat costs, boat rentals, and supplies; *** Includes expenses such as travel, guides.
In 2005, anglers invested $228.3 million in major purchases and investments that could be wholly attributable to recreational fishing in the Great Lakes. The investment accounted for 31.5% and 8.8% of the totals of $715.5 million (weighted) and $2.6 billion worth of purchases and investments made for recreational fishing in Ontario/Quebec, and in Canada, respectively.
Description
Table 5 is titled “Major Purchases and Investments ($Mil.) by All Anglers by Lake/Type, 2005” and is sourced from DFO’s 2005 Survey of Recreational Fishing in Canada. The table has eight columns. The first is captioned “Name of the Lakes”; the second “Fishing Equipment” with a note that it includes expenditures on fishing rods, reels, depth finders, etc.; the third “Boating Equipment”’; the fourth “Camping Equipment”; the fifth “Vehicles”; the sixth “Land/Buildings”; the seventh “Other Investments”; and the eighth “Total.” The table has 10 rows. Row 1 is Superior with a fishing equipment value of $0.8 million; a boating equipment value of $1.1 million; a camping equipment value of $1.0 million; a vehicles value of $3.6 million; a land/buildings value of $3.1 million; and an other investments value of $0.7 million for a total value of $10.3 million. Row 2 is Huron with a fishing equipment value of $8.2 million; a boating equipment value of $27.1 million; a camping equipment value of $6.6 million; a vehicles value of $12.4 million; a land/buildings value of $12.2 million; and an other investments value of $2.7 million for a total value of $69.2 million. Row 3 is Eerie with a fishing equipment value of $4.1 million; a boating equipment value of $36.3 million; a camping equipment value of $1.0 million; a vehicles value of $4.0 million; a land/buildings value of $4.6 million; and an other investments value of $0.9 million for a total value of $50.8 million. Row 4 is Ontario with a fishing equipment value of $7.4 million; a boating equipment value of $28.9 million; a camping equipment value of $1.3 million; a vehicles value of $3.7 million; a land/buildings value of $1.0 million; and an other investments value of $5.7 million for a total value of $48.0 million. Row 5 is Lake St. Clair with a fishing equipment value of $1.4 million; a boating equipment value of $5.6 million; a camping equipment value of $1.0 million; a vehicles value of $4.2 million; a land/buildings value of $1.5 million; and an other investments value of $0.5 million for a total value of $14.2 million. Row 6 is the St. Lawrence with a fishing equipment value of $2.0 million; a boating equipment value of $8.4 million; a camping equipment value of $0.8 million; a vehicles value of $6.0 million; a land/buildings value of $18.5 million; and an other investments value of $0.3 million for a total value of $36.0 million. Row 7 is the Great Lakes with a fishing equipment value of $23.9 million; a boating equipment value of $107.3 million; a camping equipment value of $11.6 million; a vehicles value of $33.8 million; a land/buildings value of $41.0 million; and an other investments value of $10.8 million for a total value of $228.4 million. Row 8 is the province of Ontario with a fishing equipment value of $73.1 million; a boating equipment value of $300.7 million; a camping equipment value of $68.1 million; a vehicles value of $147.0 million; a land/buildings value of $197.5 million; and an other investments value of $28.7 million for a total value of $815.0 million. Row 9 is the province of Quebec, with a note that the data is for resident anglers only, with a fishing equipment value of $41.2 million; a boating equipment value of $145.3 million; a camping equipment value of $56.4 million; a vehicles value of $208.4 million; a land/buildings value of $101.5 million; and an other investments value of $21.5 million for a total value of $574.3 million. Row 10 is Canada with a fishing equipment value of $203.5 million; a boating equipment value of $873.6 million; a camping equipment value of $324.8 million; a vehicles value of $606.4 million; a land/buildings value of $493.4 million; and an other investments value of 83.8 million for a total value of $2,585.4 million.
| Name of the Lakes | Fishing Equipment* | Boating Equipment | Camping Equipment | Vehicles | Land/ Buildings | Other Investments | Total |
|---|---|---|---|---|---|---|---|
| Superior | $0.8 | $1.1 | $1.0 | $3.6 | $3.1 | $0.7 | $10.3 |
| Huron | $8.2 | $27.1 | $6.6 | $12.4 | $12.2 | $2.7 | $69.2 |
| Erie | $4.1 | $36.3 | $1.0 | $4.0 | $4.6 | $0.9 | $50.8 |
| Ontario | $7.4 | $28.9 | $1.3 | $3.7 | $1.0 | $5.7 | $48.0 |
| Lake St. Clair | $1.4 | $5.6 | $1.0 | $4.2 | $1.5 | $0.5 | $14.2 |
| St. Lawrence | $2.0 | $8.4 | $0.8 | $6.0 | $18.5 | $0.3 | $36.0 |
| Great Lakes | $23.9 | $107.3 | $11.6 | $33.8 | $41.0 | $10.8 | $228.4 |
| Ontario | $73.1 | $300.7 | $68.1 | $147.0 | $197.5 | $28.7 | $815.0 |
| Quebec** | $41.2 | $145.3 | $56.4 | $208.4 | $101.5 | $21.5 | $574.3 |
| Canada | $203.5 | $873.6 | $324.8 | $606.4 | $493.4 | $83.8 | $2,585.4 |
Source: Survey of Recreational Fishing in Canada 2005, DFO.
Notes: * Includes expenditures on fishing rods, reels, depth finders, etc.; ** Resident anglers only.
The total direct expenditures and major purchases/investment of $443.0 million in recreational fishing in the Great Lakes accounts for 28.7% of the weighted total of $1.5 billion expended in Ontario and Quebec in 2005 (see Table 6).Footnote 50
Description
Table 6 is titled “Major Purchases/Investments and Direct Expenditures ($Mil.) by All Anglers, 2005” and is sourced from the DFO’s 2005 Survey of Recreational Fishing in Canada. The table has four columns. The first column has no caption. The second column is captioned “Direct Expenditures”; the second “Major Purchases” and the third “Total.” The table has 15 rows. Row 1 is the Great Lakes with a direct expenditures value of $214.6 million and a major purchases value of $228.4 million for a total value of $443.0 million. Row 2 is the St. Lawrence with a direct expenditures value of $13.2 million and a major purchases value of $36.0 million for a total value of $49.2 million. Row 3 is Lake Ontario with a direct expenditures value of $44.9 million and a major purchases value of $48.0 million for a total value of $92.9 million. Row 4 is Lake Eerie with a direct expenditures value of $33.4 million and a major purchases value of $50.8 million for a total value of $84.1 million. Row 5 is Lake Huron with a direct expenditures value of $92.1 million and a major purchases value of $69.2 million for a total value of $161.3 million. Row 6 is St. Clair with a direct expenditures value of $13.9 million and a major purchases value of $14.2 million for a total value of $28.1 million. Row 7 is Lake Superior with a direct expenditures value of $17.1 million and a major purchases value of $10.3 million for a total value of $27.4 million. Row 8 is Ontario with a direct expenditures value of $1,031.5 million and a major purchases value of $815.0 million for a total value of $1,846.6 million. Row 9 is Quebec with a direct expenditures value of $378.9 million and a major purchases value of $574.3 million for a total value of $953.2 million. Row 10 is the weighted total with a direct expenditures value of $856.2 million and a major purchases value of $715.5 million for a total value of $1,571.7 million. Row 11 is GL as a % of weighted total with a direct expenditures value of 25.1%, a major purchases value of 31.9%, and a total value of 28.7%. Row 12 is GL as a % of Ontario, with a note that the data excludes the St. Lawrence, with a direct expenditures value of 19.5%, a major purchases value of 23.6%, and a total value of 21.3%. Row 13 is GL as a % of Quebec, with a note that the data includes the St. Lawrence only, with a direct expenditures value of 3.5%, a major purchases value of 6.3%, and a total value of 5.2%. Row 14 is Canada with a direct expenditures value of $2,466.2 and a major purchases value of $2,585.4 for a total value of $5,051.6. Row 15 is GL as a % of Canada with a direct expenditures value of 8.7%, a major purchases value of 8.8%, and a total value of 8.8%.
| Direct Expenditures | Major Purchases | Total | |
|---|---|---|---|
| The Great Lakes | $214.6 | $228.4 | $443.0 |
| St. Lawrence | $13.2 | $36.0 | $49.2 |
| Lake Ontario | $44.9 | $48.0 | $92.9 |
| Lake Erie | $33.4 | $50.8 | $84.1 |
| Lake Huron | $92.1 | $69.2 | $161.3 |
| St. Clair | $13.9 | $14.2 | $28.1 |
| Lake Superior | $17.1 | $10.3 | $27.4 |
| Ontario | $1,031.5 | $815.0 | $1,846.6 |
| Quebec | $378.9 | $574.3 | $953.2 |
| Weighted Total | $856.2 | $715.5 | $1,571.7 |
| GL as a % of Weighted Total | 25.1% | 31.9% | 28.7% |
| GL* as a % of Ontario | 19.5% | 23.6% | 21.3% |
| GL** as a % of Quebec | 3.5% | 6.3% | 5.2% |
| Canada | $2,466.2 | $2,585.4 | $5,051.6 |
| GL as a % of Canada | 8.7% | 8.8% | 8.8% |
Source: Survey of Recreational Fishing in Canada 2005, DFO.
Notes: * Excludes St. Lawrence; ** Includes St. Lawrence only.
Pertaining to the estimation of consumer surplus, following the contingent valuation methodology, based on 39 studies and 122 estimates for the US, Rosenberger & Loomis (2001) presented a range of estimates for consumer surplus of fishing to be USD3.03 to USD369.15. Apogee (1990) used a value of $70 in consumer surplus per angler-day for recreational fishing on the Great Lakes. Dupont (2003) presented WTP values for three user categories (active user, potentially active user and passive user) with respect to three recreational activities (swimming, boating and fishing) using data for Hamilton Harbour, Ontario. The fishing estimates ranged from $10.89 - $39.37 for unspecified improvements to recreational fishing. The most widely used consumer surplus value associated with recreational fishing in Canada is reported by EC in 2000. Based on the results of a survey conducted in 1996, EC (2000) estimated the consumer surplus associated with recreational fishing to be $10.80 in 1996 dollars.
Therefore, to calculate the total economic contributions of recreational fishing in the Great Lakes to Canada, the present study added the inflation-adjusted expenditures on recreational fishing in 2005 estimated by DFO (2008) and the inflation-adjusted economic values estimated by EC (2000), as follows:
Estimated Value of Recreational Fishing (EVRF) = Expenditures in Recreational Fishing (ERF) + Value of Consumer Surplus (CS)
(i) Estimated Expenditures in Recreational Fishing (ERF) = IRF2005 * π2011/2005
(ii) Value of Consumer Surplus (CSRF) = ND * (V1996 * π2011/1996)
Where IRF is direct expenditure and investment in recreational fishing, π is inflation rate, ND is number of angling days, and V is consumer surplus per day. Following this approach, the economic contributions of the recreational fishing industry around the Canadian side of the Great Lakes is estimated to be $560.3 million/year.Footnote 51
Recreational Hunting
A few studies (e.g. Rosenberger, 2001; EC, 2000) provided estimates for Canada (and the US) of the number of hunters and the economic values of hunting activities. However, none of the literature estimated either the number of hunters or the benefits accrued by hunting activities (e.g. waterfowl) occurring specifically along the Great Lakes.
Austin et al. (2007) estimated that approximately 20,000 hunters and 200,000 hunting trips depend on Great Lakes ecosystems each year. These estimates are based on 5% of the estimated 400,000 waterfowl hunters and up to 4 million days of waterfowl hunting per year in the Great Lakes states in 2004 and 2005. Applying USD32 per trip to 200,000 Great Lakes waterfowl hunting days, the report estimated a surplus value of hunting in the amount of USD6.4 million around the Great Lakes in the US.
Using meta-assessments of the literature based on 13 recreation demand studies carried out during 1967-1998, Rosenberger (2001) presented a range of USD3.8 - 249.9 consumer surplus per waterfowl hunting day. Applying conjoint valuation approach analysis on waterfowl hunters in Louisiana,Footnote 52 Gan and Luzar (1993) estimated a WTP in the amount of USD395.77 to increase the daily duck bag limit from the currently mandated three ducks per day, with lower and upper limit estimates of USD326.66 and USD490.72, respectively.Footnote 53
From the Canadian perspective, EC (2000) found that residents of Ontario spent $4.3 billion on nature-related activities in 1996, of which $200.6 million was spent on hunting wildlife. Footnote 54 The average hunter spent $639 during the year, or $37/day of participation. Quebec residents spent $285.6 million on hunting wildlife, of a total of $2.1 billion spent on nature-related activities. The average Quebec hunter spent $726 during the year, or $50/day of participation in hunting. Pertaining to the estimation of consumer surplus, the report estimated that the consumer surplus associated with huntingFootnote 55 was $219.7/yearly or $17.9/daily, in 1996 dollars.
As the above values are not Great Lake specific, to calculate the total economic contributions of hunting in the Great Lakes, the present study scaled down the hunting expenditures and the economic values estimated by EC (2000), Footnote 56 and adjusted for inflation as follows:
Estimated Value of Hunting (EVH) = Expenditures in Hunting (EH) + Value of Consumer Surplus (CSH)
(i) Estimated Expenditures in Hunting (EH) = 0.265 * (OntarioI1996 * π2011/1996) + 0.046 * (QuebecI1996 * π2011/1996)
(ii) Value of Consumer Surplus (CSW) = 0.265 * [OntarioNH * (OntarioV1996 * π2011/1996) + 0.046 * [QuebecNH * (QuebecV1996 * π2011/1996)
where I is expenditure in hunting, π is inflation rate, NH is number of hunters, and V is consumer surplus per year. Following this approach, the economic contributions of recreational hunting around the Great Lakes in Canada was estimated to be $105.7 million/year (Ontario - $85.5, Quebec - $20.2).
Recreational Boating
Several studies (e.g. Dutta, 1984; Hushak, 1999, Dupont, 2003) have assessed the economic values associated with recreational boating in the Great Lakes from both the Canadian and the US context.
From the US side, using travel-cost method, Dutta (1984) found that the economic value of recreational boating and fishing activities in the Central Basin of the Ohio portion of Lake Erie was USD48.44 million in 1982. Husak (1999) estimated that the total boating expenditures of Ohio’s boat-owning households was USD2.6 billion during October, 1997 - September, 1998.Footnote 57 The Great Lakes Commission reported that there were about 4.3 million recreational boats in the eight Great Lakes states and that nearly one-quarter of all recreational boats in the Great Lakes states belonged to residents of Great Lakes shoreline counties. More than 910,000 boats are used primarily on Great Lakes waters.Footnote 58 Applying an input-output model, the Commission also estimated that expenditures on boats and boating activities in the Great Lakes states totaled nearly USD16 billion in 2003. With secondary effects, the number grew to USD19 billion in sales, USD6.4 billion in personal income, and USD9.2 billion in value added. These expenditures directly supported 107,000 jobs, which grew to 244,000 jobs with the inclusion of secondary effects. The U.S. Army Corps of Engineers (2008) estimated that 911,000 recreational boaters in the Great Lakes States spent USD3.68 billion/year on boating trips, and USD2.25 billion/year on boats, equipment and supplies. These expenditures resulted in the creation of 60,000 jobs and USD2.76 billion in personal income.
In the Canadian context, a few studies (e.g. Thorpe and Stone, 2000) have estimated that there were 1.2 million recreational boats in Ontario, of which approximately 780,000 (65%) were used in the Great Lakes.Footnote 59 Every year, more than 1.5 million recreational boaters travel the waters of the Great Lakes (OMNR, 2012, March). Using data from online surveys and publicly available information from Industry Canada, Genesis Public Opinion Research Inc. (2007) estimated that the total direct and indirect expenditures from recreational boating in Ontario was in the amount of $7.3 billion in 2006, but provided no specific estimate for the Great Lakes.
With respect to consumer surplus, Dupont (2003) estimated that the median WTP for improvements to Hamilton Harbour, Ontario, Canada, to support recreational boating was in the $8.20 to $43.27 range for passive and active boating users, respectively. Though no specific value was provided for boating, EC (2000) estimated that the consumer surplus associated with outdoor activities in natural areasFootnote 60 for Ontario residents was $146.6/yearly, or $9.7/daily, in 1996 dollars.
Therefore, to calculate the total economic contributions of recreational boating in the Great Lakes basin in Canada, the present study added inflation-adjusted expenditures estimated by Genesis Public Opinion Research Inc. (2007) (weighted by 65%) and the inflation-adjusted economic values estimated by Environment Canada (2000), as follows:
Estimated Value of Boating (EVB) = Expenditures in Boating (EB) + Value of Consumer Surplus (CSB)
(i) Estimated Expenditures in BoatingFootnote 61 (EB) = 0.65 * (IB2006 * π2011/2006)
(ii) Value of Consumer Surplus (CSB) = NB * (V1996 * π2011/1996)
where IB is boating expenditure, π is inflation rate, NB is number of boaters, and V is consumer surplus per year. Following this approach, the economic contributions of recreational boating around the Great Lakes in Canada is estimated to be $7.3 billion per year.Footnote 62
Beaches and Lakefront Use
Literature relating to the benefits of beach and lakefront use along the Great Lakes is rich compared to that for other activities.
From the US perspective, using results from a survey of 1500 Chicago beach-goers in 2004, Shaikh (2004) estimated that the average day at the beach was worth approximately USD35 to an individual. The total seasonal value for beach-goers was estimated in the range of USD800 million - USD1.0 billion. Based on survey data for recreational use of ocean beaches, Austin et al. (2007) estimated that the annual number of swimmers and swimming days at Great Lakes beaches were 8 million and 80 million, respectively. Furthermore, the study estimated that the economic benefit of a 20% reduction in beach closings and advisories would be in the range of USD130–USD190 million per year.Footnote 63
From a Canadian perspective, using survey data and the travel-cost method, Sohngen (1999) estimated that the recreational value of a day trip to Lake Erie beaches was in the range of $26 - $44. Using data from a 1995 contingent valuation study of recreational improvements for Hamilton Harbour, Hamilton, Ontario, Dupont (2001) estimated individual, sex-specific WTP for swimming, boating, and fishing in the Harbour, and found that the mean WTP for swimming for men and women were $30.55 and $27.69, respectively. Those values were much lower than a recent study that investigated the WTP for improvements to Hamilton Harbour, which determined the range to be $16.06 - $75.18 for swimming activities (Marbek, 2010b). Krantzberg et al. (2006) estimated the WTP value for Canadian Great Lakes beach goers to be in the range of $200 - $250 million, which was derived by proportionally scaling the value derived by Shaikh (2004) for the US.
To calculate the total economic contributions of beaches and lakefront use in the Great Lakes, the present study used inflation-adjusted average value from a range of values estimated by Krantzberg et al. (2006), as follows:
Estimated Expenditures in Beaches and Lakefront Use (EBL) = IBL * π2011/2006
where IBL is beaches and lakefront expenditure, and π is inflation rate. Following this approach, the economic contribution of Canada’s beaches and lakefronts around the Great Lakes is estimated to be $247.8 million per year.
Wildlife Viewing
A number of studies highlighted and estimated the economic value of wildlife viewing for regions of the US and Canada. However, information on the economic values generated by wildlife watching specifically for the Great Lakes is sparse.
From the US perspective, the U.S. Fish and Wildlife Service (2001) estimated that there were 46 million bird watchers in the US, whose expenditures related to wildlife watching in the US were approximately USD32 billion for the year 2001. Using the contingent valuation method, the survey found that the net economic value for a wildlife watcher in their resident state was USD257/year or USD35/day of wildlife watching. Wildlife watchers who travel outside their state have a different demand curve and therefore have higher net economic values of USD488/year and USD134/day of wildlife watching. Kerlinger (unspecified) estimated that there were 10 million bird watchers in the US and that bird watching related expenditures were over USD20 billion per year in the US. The annual spending by active bird watcher averages between USD1,500 and USD3,400. Rosenberger and Loomis (2001) reviewed literature spanning 1967 to 1998 in the US and Canada, and covered 760 value measures estimated from 163 separate empirical research efforts spanning 21 recreational activities. The study found that the consumer surplus for wildlife watching activity was in the range of USD2.36 - 161.59/person/day.
Austin et al., 2007 estimated birding activities specifically for the Great Lakes and found that there were about 17 million bird watchers in the Great Lakes states and 5 million in the Great lakes basin in the US. Surplus value generated by birding was found to be in the range of USD40 – USD153 per trip, with a weighted average value of about USD50/trip. Assuming 2 million traveling bird watchers each visit the Great Lakes basin once per year, the study estimated that the total surplus value was in the range of USD5 – USD10 million annually.Footnote 64
From Canadian perspective, EC (2000) found that Ontario residents spent $410.9 million on wildlife viewing in 1996. On average, the wildlife viewers spent $263/year or $16/day of participation. For Quebec residents, wildlife viewing expenditures were estimated at $281.0 million in the same year. On average, Quebec residents spent $239, or $17/day of participation in wildlife viewing. Footnote 65 Pertaining to consumer surplus, the report estimated that the consumer surplus associated with wildlife viewing was $88.4/yearly or $7.5/daily, in 1996 dollars.
From the Great Lakes context, using the contingent valuation method, Hvenegaard (1989) estimated that bird-watching expenditures were $224/trip, or $66/day, for trips to Point Pelee National Park, Ontario, in 1987. The total expenditures for the year were estimated to be in the amount of $5.4 million, broken down as follows: travel 27.2%; food 26.3%; and accommodations, 22.5%. The WTP (or “net economic value”) was estimated to be in the amount of $256/trip or $76/day, and $6.3 million for the year.
As the values were not Great Lake specific, to calculate the total economic contributions of wildlife viewing in the Great Lakes, the present study scaled down the wildlife viewing expenditures and economic values estimated by EC (2000) and adjusted for inflation as follows:Footnote 66
Estimated Value of Wildlife Viewing = Expenditures in Wildlife Viewing (EW) + Value of Consumer Surplus (CSW)
(i) Estimated Expenditures in Wildlife Viewing (EW) = 0.265 * (OntarioI1996 * π2011/1996) + 0.046 * (QuebecI1996 * π2011/1996)
(ii) Value of Consumer Surplus (CSW) = 0.265 * [OntarioNW * (OntarioV1996 * π2011/1996) + 0.046 * [QuebecNW * (QuebecV1996 * π2011/1996)]
where I is wildlife viewing expenditure, π is inflation rate, NW is number of viewers, and V is consumer surplus per year. Following this approach, the economic contributions of wildlife viewing around the Great Lakes in Canada is estimated to be $217.5 million/year (Ontario - $196.7; Quebec - $20.9).
Commercial Navigation
The Great Lakes provide means of transporting goods from the industrialized core of North America. The Great Lakes-St. Lawrence Waterway extends 3,700 kilometers (2,300 miles) (Martin Associates, 2011), making it the largest inland waterway in the world (Canadian Shipowners Association, 2006). The waterway complements the region’s rail and highway network and offers customers a cost-effective means of moving raw materials, agricultural commodities and manufactured products. It includes 110 system ports located in the eight Great Lakes states and the provinces of Ontario and Quebec. In 2010, a total of 322.1 million metric tons of cargo was “handled” (based on approximately 164 million metric tons of cargo “moved”) by all US and Canadian ports and marine terminals on the Great Lakes-Seaway system (Martin Associates, 2011).
In the US, estimations of the economic contributions made by the Great Lakes - St. Lawrence Seaway System and the 16 major individual ports located on the US side of the border include USD3.4 billion of business revenue to firms providing transportation and cargo handling services, an additional USD1.9 million of local purchases and consumption expenditures, and USD1.3 billion in expenditures by the firms providing the cargo handling and transportation services (Krantzberg et al., 2006).
Martin Associates (2011) estimated that 32 US and Canadian Great Lakes-Seaway system ports contributed USD9.7 billion in personal income and generated 128,227 US jobs (direct, indirect and induced) in 2010. As a result of maritime activity on the Great Lakes-Seaway system, business revenue accrued in 2010 in the US was over USD18.0 billion.
According to Statistics Canada (2008), the Great Lakes region accounts for the majority of the total inbound tonnage from the US. In 2008, the total international shipping of commodities (coal, grain, iron ore, aggregates, salt, and petroleum products) handled (loaded and unloaded) in the Canadian portion of Great Lakes region was 44.3 million tonnes.
LECG (2004) conservatively estimated that, in 2003, over $2.2 billion of provincial gross domestic product (GDP) and over 18,000 jobs were generated by the Great Lakes/St Lawrence waterway Transport and Environment Canada (2004) estimated that the Great Lakes - St. Lawrence Waterway added $3.0 billion annually, and approximately 17,000 jobs, to the Canadian economy. Martin Associates (2011) estimated that the seaway provided an economic benefit of $3.7 billion in personal income and the generation of 76,608 Canadian jobs (direct and indirect) in 2010. As a result of maritime activity on the Great Lakes-Seaway system, in 2010, business revenue accrued was approximately $16.0 billion in Canada.
The Canadian Shipowners AssociationFootnote 67 reported an economic contribution of $4 billion (direct and indirect impact) from cargo handling, vessel services, and inland transportation services on this integrated waterway system in Canada.Footnote 68
The present study calculated that the total value generated by commercial navigation in the Great Lakes in Canada is in the amount of $4.2 billion, by revising the estimate of the Canadian Shipowners Association for inflationary impact, as follows:
Estimated Value of Commercial Navigation (VCN) = V2008 * π2011/2008
where V is value of transportation services and π is inflation rate.
Oil and Gas
In 2009, there were 96 commercial oil and gas producers in Ontario. There were 1,200 active oil wells, 1,300 commercial natural gas wells and 500 private gas wells. Five hundred (500) of the gas wells were located offshore on Crown land under the Lake.Footnote 69
Ontario Ministry of Natural Resources (2012) reported that about 88,000 cubic meters of crude oil with a wellhead value of $50 million was produced in Ontario in 2009. In 2008, approximately 240 million cubic meters of natural gas with a retail value of $80 million was produced in Ontario. All of Ontario's crude oil and natural gas production is consumed within Ontario.Footnote 70
The study calculated the total value of oil and natural gas produced from the Great Lakes in the amount of $136.8 million as follows:
Estimated Value of Oil (VO) = V2009 * π2011/2009
Estimated Value of Natural Gas (VG) = V2008 * π2011/2008
Where V is value of resources and π is inflation rate.
Ecosystem Services
The Great Lakes provides invaluable services to society through maintaining ecosystems and biodiversity. Some of these are captured with the corresponding direct benefits to the Great Lakes economy. The intrinsic values of ecosystems and biodiversity are harder to define because they are much more intangible (Krantzberg et al., 2008, 2006). For example, the Great Lakes provide clean, breathable air by regulating gases (e.g. carbon dioxide) and protect the general maintenance of a habitable planet by regulating the local weather and climatic conditions of the region. These services are usually categorized in the literature as follows:Footnote 71 gas regulation; local climate regulation; water regulation; disturbance prevention; soil formation/retention; waste treatment; nutrient cycling; and habitat, refugium and nursery (Marbek, 2010b; Krantzberg et al., 2008, 2006).Footnote 72 Thus far, however, there has not been sufficient practical guidance provided on how to measure them.
A few studies have attempted to evaluate the value of some of the afore-mentioned specific ecological services provided by the Great Lakes, following different methodologies and primarily from a Canadian or provincial perspective. Yap, Reid, de Brou, and Bloxam (2005) estimated health damages of about $6.6 billion per year of the total economic damage of $9.6 billion per year, which some studies cited as benefits (i.e. avoided costs), associated with reduced air pollution through gas regulation services provided by Lakes. In terms of waste treatment, Brox, Kumar and Stollery (2003) estimated the WTP for different changes in water quality in the Grand River Watershed in Ontario. The study found that households have average WTP in the range of $6.09 - $11.07 per month for minor and major changes in water quality. The study calculated a present value of $1,869 per household as the WTP for a one-time investment in a capital project for water quality improvements. In terms of evaluating wetlands’ value in providing habitat and/or habitat protection, using a meta-analysis approach on 39 wetland valuation studies, Woodward and Wui (2001) estimated an average value of $1,363.79 per hectare. Kazmierczak (2001) estimated the value of habitat and species protection to be $843.55 per hectare. Using the benefit transfer approach, Costanza et al. (1997) estimated a global average of the habitat ecosystem service of $690.71 per hectare. Krantzberg et al. (2008, 2006) cited that wild unprocessed biodiversity in Canada was worth $70 billion, which included values of nutrient cycling, flood control, climate control, soil productivity, forest health, genetic vigour, pollination and natural pest control.Footnote 73
Literature providing relevant values for the entire Great Lakes basin is still limited. Wilson (2008) estimated that the Lake Simcoe watershed’s non-market ecosystem services were worth $975 million ($2,948/hectare/year). Wetlands are worth an estimated $435 million per year ($11,172/hectare) because of their high value for water regulation, water filtration, flood control,Footnote 74 waste treatment, recreation, and wildlife habitat. The ecosystem service attributed to habitat is valued at $6,234.14 per hectare of wetland in Lake Simcoe’s basin. Expanding this approach, the International Lake Ontario-St. Lawrence River Study Board (2006) (cited in Marbek (2010b)), calculated a value of $2,184.40 per hectare of wetland for all Canadian Great Lakes restoration projects.Footnote 75 Wetlands and other natural ecosystems fixate nutrients in their soils. Two of the main non-point source pollutants in the Great Lakes Basin are phosphorous and nitrogen (Marbek, 2010b). Wilson (2008) found that the annual total value for waste treatment of nitrogen and phosphorus by wetlands in the Lake Simcoe watershed is an estimated $83.7 million or $2,148 per hectare (based on a range of values from $1,061 to $3,235/ha/year).
The International Joint Commission (IJC) Study Board (cited in David Suzuki Foundation (2008)) estimated the annual value for wetlands habitat services in the Great Lakes basin at around USD548 million, or USD5,830 per hectare, based on the average annualized wetland habitat restoration costs for a group of relevant Great Lakes Sustainability Fund projects.
Wilson (2008) determined the soil carbon storage of wetlands in Lake Simcoe to be 125 – 312 tonnes per hectare, depending on the type of wetland, and estimated an annual value in the range of $559 - $1,388 per hectare, per year. The annual value of the carbon storage is an estimated $21.9 million, based on the average damage cost of carbon emissions ($52/tonne of carbon). Moreover, wetlands sequester between 0.2 to 0.3 tonnes of carbon per hectare each year, which was valued at $14 per hectare.
The Great Lakes basin provides important erosion control services for society, although the water in the Lakes themselves is one of the main causes of erosion to the surrounding shorelines. Two of the main economic benefits related to erosion control are the public benefit of reduced sedimentation and avoided private property damage.
Pertaining to the public benefit of reduced sedimentation, the cost of replacement method is usually used to provide a monetary estimate of this benefit of decreased water turbidity of the water source caused by increased sedimentation. In the Great Lakes context, the mean cost of sediment removal for municipal water treatment facilities in southern Ontario was estimated to be $28.57/tonne of sediment (Fox and Dickson, 1990).Footnote 76
In terms of avoided private property damage, the International Lake Ontario St. Lawrence River Study Board (2006) (cited in Marbek, 2010b) found that on Lake Ontario, around 600 homes are at imminent risk of damage from erosion and flooding. The David Suzuki Foundation (2008) valued shoreline protection of Sauble Beach, Lake Ontario, beach front and dunes at $6 million. Kriesel (1988) estimated that the average WTP as $80,283 to increase the number of years from 1 to 21 years until the distance between the house and the lake is zero.
There is no existing literature on the potential economic value of natural local climate regulation by the Great Lakes, due to the lack of information and the uncertainty around predicting the future (e.g. knowledge of local weather and climate patterns).
Option Value
Neither economic theory nor empirical literature provides adequate information to quantify the option values. Thus, option value is excluded from the computation of the baseline values. It should, however, be noted that assets with less perfect substitutes are likely to have larger option values. The Great Lakes and associated unique biodiversity characteristics might be a case in point (Marbek, 2010b).
Non-Use Value
As mentioned in Section 4, society, and in particular, people residing in and near the Great Lakes region, derives substantial non-use value from the services provided by the Great Lakes.Footnote 77
In terms of non-use values of the resources embedded in the Great Lakes, a few studies have estimated non-use values for different areas of Canada and the US, using direct stated preference methods (contingent valuation, discrete choice experiments). The total non-use value for the Great Lakes has not been studied so far due to the lack of extensive data. Moreover, neither has there been any applicable study that could serve as proxy values for the Great Lakes. However, some specific estimates of non-use values have been conducted in the Great Lakes context.
In the US, Loomis (1987) found that non-use values were approximately 73 times as large as the corresponding use values at Mono Lake, California. Whitehead et al. (2009) found that 23% of non-users of recreational benefits of the Saginaw Bay coastal marsh in Michigan reported positive WTP for those benefits, generating a present value of USD635/acre.
Using 1980 recreational use and survey data on 218 resident Colorado households, Walsh et al. (1984) estimated separate WTPs for option, existence and bequest values for increments of wilderness designated land. The study found that the three components of non-use value have a relatively equal weight, with existence and bequest values each being slightly more than option value, as follows: option value - USD10.2 million; existence value - USD12.3 million; and bequest value - USD12.5 million.Footnote 78
From the Canadian perspective, Dupont (2003) estimated that passive users of recreational activities in Hamilton Harbour, Ontario, had WTP for improvements as follows: $20.5 for swimming, $10.9 for boating, and $11.7 for fishing. These estimated non-use values excluded existence and bequest values of these activities by active users, and other ecological benefits valued by both groups. Reviewing relevant literature, Apogee (1990) provided additional estimates of non-use values associated with water quality and concluded that the non-use component was 50% of TEV.
Biodiversity itself also provides substantial non-use value, which may roughly be captured by people’s WTP to preserve endangered species. Bishop (1987) estimated the taxpayers’ WTP for the striped shiner (designated as an endangered species) to be in the range of USD10.2 - USD13.8. Aggregating all of Wisconsin’s taxpayers, the WTP was estimated to be USD29 million, which was almost 20% of the estimated direct use value of all of Wisconsin’s sport and commercial fisheries in the Great Lakes (USD154 million). Because this fish has no identified use value to society, this WTP can be interpreted as the total non-use value. These values give an indication of the magnitude of non-use values associated with Great Lakes resources.
Although, as indicated, it is a significant challenge to capture the benefits of non-use values, almost all the literature noted that even if non-use values might be insignificant at the individual level, aggregated values for an entire economy are significant. For example, Freeman (1979) stated that the total non-use values might fall in the range of 60% - 80% of TEV.
Aggregated Economic Contribution
Based on the methodology adopted in Chapter 3 and the subsequent calculations in Chapter 4, the present study estimates that, in Canada, the value of economic contributions of the activities in and around the Great Lakes is in the amount of $13.8 billion dollars. Table 7 and Matrix 2 show the details on the values adopting the TEV framework discussed in Chapter 3.
Description
Table 7 is titled “Economic Contributions ($Million) of the Great Lakes by Sector and Activity in 2011” and is sourced from a Fisheries and Oceans Canada Staff calculation, Policy and Economics, Central and Arctic Region. The table has seven columns. The first is captioned “Use Values”; the second “Current Uses”; the third “Direct”; the fourth “Sector”; the fifth “Value/Expenditure”; the sixth “Consumer Surplus”; and the seventh “Total.” The table has 21 rows. Row 1 is a main heading row captioned “Extractive” as a sector. The use values, current uses and direct columns are linked to this row by colour-coding. The extractive sector has a value/expenditure value of $1,743 million and a consumer surplus value of $79 million for a total value of $1,822 million. Rows 2 to 10 fall under the extractive sector heading. Row 2 is the industrial water sector with a value/expenditure value of $96 million and a consumer surplus value of NA for a total value of $96 million. Row 3 is the drinking water sector with a value/expenditure value of $532 million and no consumer surplus value for a total value of $532 million. Row 4 is the agricultural water sector with a value/expenditure value of $165 million and no consumer surplus value for a total value of $165 million. Row 5 is the irrigation sub-sector of the agricultural water sector with a value/expenditure value of $99 million and no consumer surplus value for a total value of $99 million. Row 6 is the livestock sub-sector of the agricultural water sector with a value/expenditure value of $66 million and no consumer surplus value for a total value of $66 million. Row 7 is the commercial fishing sector with a value/expenditure value of $226 million and a consumer surplus value of NA for a total value of $226 million. Row 8 is the recreational fishing sector with a value/expenditure value of $498 million and a consumer surplus value of $62 million for a total value of $560 million. Row 9 is the hunting sector with a value/expenditure value of $90 million and a consumer surplus value of $16 million for a total value of $106 million. Row 10 is the oil and gas sector with a value/expenditure value of $137 million and a consumer surplus value of NA for a total value of $137 million. Row 11 is a main heading row captioned “Non-Extractive” as a sector. The use values, current uses and direct columns are linked to this row by colour-coding. The non-extractive sector has a value/expenditure value of $11,620 million and a consumer surplus value of $350 million for a total value of $11,970 million. Rows 12 to 15 fall under the non-extractive sector heading. Row 12 is the recreational boating sector with a value/expenditure value of $6,994 million and a consumer surplus value of $297 million for a total value of $7,291 million. Row 13 is the beaches and lakefront use sector with a value/expenditure value of $248 million and a consumer surplus value of NA for a total value of $248 million. Row 14 is the wildlife viewing sector with a value/expenditure value of $165 million and a consumer surplus value of $53 million for a total value of $218 million. Row 15 is the commercial navigation sector with a value/expenditure value of $4,214 million and no consumer surplus value for a total value of $4,214 million. Row 16 is the grand total with a value/expenditure value of $13,363 million and a consumer surplus value of $429 million for a total value of $13,792 million. Row 17 is juxtaposed with the “Direct” column and is captioned “Indirect”. The sector is ecosystem services and the value/expenditure, consumer surplus and total values are not quantified. Rows 18 and 19 are juxtaposed with the “Current Uses” column and are captioned “Future Uses.” The sectors are option values and research values, and the value/expenditure, consumer surplus and total values are not quantified. Rows 20 and 21 are juxtaposed with the “Use Values” column and are captioned “Non-Use Values.” The sectors are existence values and bequest values, and the value/expenditure, consumer surplus and total values are not quantified.
| Sector | Value/ Expenditure | Consumer Surplus | Total | |||
|---|---|---|---|---|---|---|
| Use Values | Current Uses | Direct | Extractive | $1,743 | $79 | $1,822 |
| Industrial Water | $96 | NA | $96 | |||
| Drinking Water | $532 | -- | $532 | |||
| Agricultural Water | $165 | -- | $165 | |||
| -- Irrigation | $99 | -- | $99 | |||
| -- Livestock | $66 | -- | $66 | |||
| Commercial Fishing | $226 | NA | $226 | |||
| Recreational Fishing | $498 | $62 | $560 | |||
| Hunting | $90 | $16 | $106 | |||
| Oil and Gas | $137 | NA | $137 | |||
| Non-Extractive | $11,620 | $350 | $11,970 | |||
| Recreational Boating | $6,994 | $297 | $7,291 | |||
| Beaches and Lakefront Use | $248 | NA | $248 | |||
| Wildlife Viewing | $165 | $53 | $218 | |||
| Commercial Navigation | $4,214 | -- | $4,214 | |||
| Grand Total | $13,363 | $429 | $13,792 | |||
| Indirect | Ecosystem Services | Not Quantified | Not Quantified | Not Quantified | ||
| Future Uses | Option Values | Not Quantified | Not Quantified | Not Quantified | ||
| Research Values | Not Quantified | Not Quantified | Not Quantified | |||
| Non-Use Values | Existence Values | Not Quantified | Not Quantified | Not Quantified | ||
| Bequest Values | Not Quantified | Not Quantified | Not Quantified | |||
Source: Fisheries and Oceans Canada Staff calculation, Policy and Economics, Central and Arctic Region.
Of the total quantified direct use values of $13.8 billion, non-extractive use and extractive use values accounted for $12.0 billion (86.8%) and $1.8 billion (13.2%), respectively. Moreover, of that $13.8 billion total, expenditures made, as well as imputed values/prices for the activities in and around the Great Lakes, comprised $13.4 billion (96.9%) and the consumer surplus constituted the remaining $0.4 billion (3.1%).
The Great Lakes basin also provides opportunities for research activities that inform and benefit others and provide a better understanding of the ecology. Research is often integrated with education. Although, estimating the economic value of these uses is difficult, their contribution in this area cannot be overlooked. Public outreach programs can improve public awareness, understanding and appreciation of the values of the ecosystems. Such programs also provide an opportunity to educate the public about activities that are carried out and about the negative impacts that human activities sometimes have on these ecosystems.
There are some associated private values held by people who live near or who visit the Great Lakes, usually captured in the literature as “aesthetic and amenity values”. For example, while the carbon storage and nutrient cycling services of wetlands are public goods, there is also a private benefit to homeowners from living near the wetland (Marbek, 2010b). There is a growing economic literature (e.g. Johnston et al., 2001; Earhhart, 2001; Pompe, 2008) pertaining to the implicit prices people are willing to pay to benefit from environmental amenities. This study excludes aesthetic and amenities values from the overall calculation of the economic values in order to avoid double-counting problems, as these values overlap some of the benefits of recreational activities (e.g. recreational fishing and boating).
The estimations of the economic contributions of the Great Lakes discussed in this chapter should be viewed as conservative estimates. The conservative estimates are provided by: (i) adjusting estimation variables where significant variations and uncertainties exist in the literature; and (ii) using reasonable proxies based on literature review and experts’ opinions. For example, if candidate proxies showed significant variations (e.g. proxies used for water use), the study adopted the lower values to avoid overestimation of the economic contributions of the activities/sectors. In addition, there were some underestimations of values in some sectoral activities due to lack of complete information required to provide defensible estimates, an issue further elaborated below.
Limitations/Gaps Identified in the Study
While undertaking an assessment of the economic contributions generated by the Great Lakes basin, the study found the following data gaps/limitations:
Water Use: Pertaining to water consumption from the Great Lakes, there were shortcomings in the study’s analysis due to incomplete information, and that resulted in a failure to capture the full spectrum of the value of the consumed water to the economy. The study particularly suffered from incompleteness stemming from the use of proxies for the valuations of water used for residential, agricultural, and industrial purposes. For example, the study used Statistics Canada’s estimates of operating/ maintenance costs of raw intake water from the Great Lakes basin, assuming that water revenue structures closely reflect the full cost of water production. For industrial water uses, the study used the shadow price of water intake for Canadian business sector industries from Dachraoui and Harchaoui (2004). Similarly, for agricultural water use, the study used the estimated value of water used in irrigation for Southern Ontario as proxy, both for Great Lakes water used for irrigation and for livestock. No Great Lakes specific data on the valuation of water used for those purposes was found. Furthermore, the study excluded consumer surplus values of water use from the assessment due to missing information on subject areas.
Heating and Cooling (including nuclear and thermal plants): The Great Lakes Commission (2010) estimated that Ontario’s annual water withdrawal and consumption were 2,028 and 18 million m3 by the fossil fuel power plants, and 13,990 and 126 million m3 by nuclear power plants, respectively. In Quebec, fossil fuel power plants annually withdrew and consumed 65 and 6 million m3, respectively.Footnote 79 In terms of the economic value of this water in the process of heating and cooling thermal power plants, the Industrial Water Use Survey found that Ontario’s thermal power generating plants spent $9.1 billion on water intake operating and maintenance costs for the intake of 23,228 million m3 of water in 1996. This expenditure results in an average intake cost of 0.39/m3 (Marbek, 2010b).Footnote 80 Unfortunately, an estimate of the full benefits (e.g. avoided electricity production, avoided pollution costs) of this usage was not available and therefore, has been excluded from the baseline calculation of the present study.
Hydropower Production: The Great Lakes provide important low cost and clean electricity generation opportunities through hydropower production. Ontario Power Generation currently operates 65 hydroelectric stations (including a green power portfolio of 29 small hydroelectric plants) and 240 dams on 24 river systems, with the majority stationed throughout the Great Lakes basin. In total, hydroelectric generation produced 32.4 terawatt-hours of power in 2011.Footnote 81
According to the Great Lakes Commission (2010), Ontario’s annual water withdrawal from the Great Lakes basin under this category was approximately 262 billion m3 (190 billion gallon per day). Marbek (2010b) reported that the Sir Adam Beck power plant on the Niagara River used in the range of 9 -11 billion m3 of water each month, and produced $100 - $150 million worth of electricity. However, due to the absence of information on the hydropower generated by other plants (Long Sault and Moses Saunders) and the lack of a detailed cost structure of hydropower production, the present study excluded these benefits generated by the Great Lakes from the baseline values.
Self-Supply of Water for Other Uses: The Great Lakes Commission (2010) category of “self-supply of water used for other purposes” includes water used to maintain levels for navigation, for recreation, for fish and wildlife habitat creation and enhancement (excluding fish hatchery operations), flow augmentation/diversion, sanitation, pollution confinement, temporary or immediate emergency situations (e.g., fighting forest or peat fires), and other water quality purposes and agricultural activities/services other than those directly related to irrigation, such as, field drainage. According to the Great Lakes Commission (2010), Ontario’s annual water withdrawal from the Great Lakes basin under this category was approximately 276 million m3 (200 million gallon per day). Unfortunately, estimates of the values of these usages were not available and, therefore, were excluded from the baseline calculation of the present study.
Commercial Fishing: The economic contributions of commercial fishing were underestimated because of missing information on landings from St. Clair river basin. The estimation may also have differed from actual contributions because market price proxies were used to fill in the gap in market value/price data.
Recreational Hunting, Wildlife Viewing: The recreational hunting and wildlife viewing expenditures were not available for the Great Lake basin. As a result, the study scaled down residents’ expenditures and consumer surplus values from Environment Canada (2000) and further adjusted 1996 survey data for current year. The estimated values therefore were, to some extent, underestimations of the actual contributions, as it excluded the relevant values generated by non-resident Canadians and foreign participants. Recent estimates of expenditure and consumer surplus values specific to the Great Lakes basin would allow for a better assessment of the economic contributions of this sector.
Recreational Boating: The recreational boating expenditures were not available for the Great Lake basin. Therefore, the study scaled down expenditures estimated for Ontario from Genesis Public Opinion Research Inc. (2007) and consumer surplus values from Environment Canada (2000), and made further adjustments for inflation. Moreover, unlike recreational fishing, expenses wholly attributable to recreational boating was not available. Therefore, due to the lack of lake-specific information and expenses wholly attributable to recreational boating, the estimates may have contained inaccuracy to some extent.
Beaches and Lakefront Use: The beaches and lakefront uses data were not available for the Great Lake basin. As a result, the study used inflation-adjusted average value from Krantzberg et al. (2008), which was scaled down from a US estimate done in 2004. Moreover, no information was available on consumer surplus values of these activities in the Great Lakes. Therefore, the assessment made in the study likely underestimated the actual contributions of these activities. More recent Great Lakes-specific estimates of expenditure and consumer surplus values would have allowed for a better assessment of the economic contributions of this sector.
Aquaculture: Commercial cage aquaculture in Ontario mostly occurs in the North Channel of Lake Huron (Manitoulin Island) and in Georgian Bay.Footnote 82 Statistics Canada valued the aquaculture industry in Ontario in 2004 as having a gross output of $22.7 million, consisting of the sales value of products and services. Ontario’s commercial aquaculture industry (Great Lakes and land-based) contributes about $65 million to the province’s economy and produces over 4,500t of fish annually.Footnote 83 These numbers represent aquaculture in Ontario and not just from the Great Lakes, however the majority of aquaculture in Ontario occurs in Lake Huron. The Great Lakes play a vital role as one of the inputs used in the production process of the aquaculture industry. However, due to the absence of information on a detailed cost structure of aquaculture production, the study excluded the contributions of the Great Lakes to the development of the aquaculture industry from the baseline values.
Other Recreational Benefits: The Great Lakes provide additional benefits from a variety of other recreational uses, such as skiing and snowmobiling in the winter, and hiking, camping and golfing. Several studies (e.g. Environment Canada, 2000, Office of the Great Lakes, 2009, and Price Waterhouse Coopers, 2004) documented the benefits of such activities associated with tourism, with no attempts to separate the individual categories. For example, Environment Canada (2000) estimated that Ontario residents spent $2,851 million on “outdoor activities in natural areas” in 1996. Along with activities such as hiking and camping, the list of “outdoor activities in natural areas” also included sightseeing in natural areas, swimming/beach activity and power boating, which have been included in the present study as individual categories. Therefore, as it was not feasible to extract the values of individual activities, some recreational benefits have been excluded from the calculation of economic benefits in the study.
Chapter 5: Social and Cultural Values of the Great Lakes
In addition to economic contributions discussed in Chapter 4, the Great Lakes provide considerable subsistence, social, cultural, and spiritual benefits to regional residents and contribute significantly to the economy as a whole. No comprehensive quantitative information/data was available on such benefits derived from the Great Lakes basin. However, this chapter presents a qualitative discussion of the socio-cultural values of the Great Lakes basin.
Harvesters of Great Lakes freshwater fish species and the communities involved in the harvests have long realized the importance of the resource to their communities, both for preserving traditional values and for subsistence purposes. Freshwater fisheries have contributed substantially to preserving traditional Aboriginal lifestyles in the study region, as fish harvesting is one of a few remaining primary economic activities providing a viable livelihood to support Aboriginal families and people. For many communities, commercial fishing helps maintain and reinforce family ties and traditions, and therefore is important for social and cultural reasons. Because of the inherent compatibility of the fisheries with traditional indigenous livelihoods, participation in this industry allows First Nations harvesters to participate in the modern economy without losing their cultural identity (Romanow, Bear & Associates Ltd., 2006).
Following the State of Michigan hook and line regulations and obtaining a Great Lakes subsistence license from the LTBB Natural Resources Department, tribal members in the State interested in fishing the Ceded waters of the Great Lakes for subsistence can harvest up to 100 lbs of fish per day via gill net, impoundment net, hook and line, or spear. Subsistence harvesters may have seasonal or geographic restrictions depending on the time of year and location of the harvests (Odawa Natural Resource Department, 2009).
LTBB of Odawa Natural Resource Department (2009) reported in its 2008/2009 Annual Harvest Report that, in 2009, eight of its tribal members obtained subsistence fishing licenses, with four reporting harvests. Three gillnet permits were issued in 2009. In 2009, reported species harvested included whitefish, lake trout, salmon, menominee, and herring. The aggregate harvest by subsistence license holders was difficult to quantify due to the difference in reporting between pounds of fish and number of fish harvested. Quantitative information on subsistence harvests from the Great Lakes basin is largely absent in both Canada and the US. However, the significance of subsistence harvests of freshwater species has been documented in a few studies (e.g. Ashcroft, Duffy, Dunn, Johnston, Koob, Merkowshy, Murphy, Scott, and Senik, 2006; Derek Murray Consulting Associates, 2006; Meyers Norris Penny, 1999) conducted in other regions in Canada.Footnote 84
In addition to providing a food source through subsistence harvesting, the harvest of freshwater species provides significant social benefits, particularly to Aboriginal communities, through the distribution of food among communities, providing linkages to traditional lifestyles and ancestors, and socialization. The social impacts of commercial fishing are significant in terms of both employment and cultural significance. These non-economic benefits are not only substantial, but also may even exceed the benefits of subsistence as a food source. Subsistence harvesting also contributes to traditional knowledge (GSGislason & Associates Ltd., 2006).
Socially, Great Lakes beaches and coasts provide a unique source of community pride, as they encourage diversified recreational activities. The beaches and coasts are the basis for the key public perception measure of environmental quality.
Chapter 6: Scenario Based on Biological Risk Assessment
Historically, AIS have caused extensive damage to Great Lakes ecosystems, however it is difficult to precisely measure AIS populations and calculate their impacts with a high degree of certainty (Jude et al., 2004). There are some critical factors for determining the magnitude of AIS threats such as the species’ reproduction rate, the species’ ability to compete with other species, the quantities of biomass the species consumes. Mere arrival of Asian carp does not in itself amount to a major ecological threat, as the species must also demonstrate its ability to establish a self-sustaining population. If Asian carp establishes a healthy population, it has a strong likelihood of harming native plant and animal life, due to its large size and its ability to consume large quantities of native species’ food sources (Lieberman, 1996).
For the AIS already established, the estimates of resulting damages could ideally be made from empirical analyses of key variables before and after the invasion, controlling all other factors that could simultaneously affect the response variables (Hoagland and Jin, 2006). For an invasive species like Asian carp that has yet to be introduced to the Great Lakes basin, such an analysis is not possible. It is therefore necessary to seek an alternative approach to the quantification of potential damages to the economy.
Ecologists are making significant efforts to identify concrete changes to the ecosystem caused by AIS. Assuming that only the current management measures are in place and all other things being equal, CEARA, DFO, evaluated the likelihood of arrival, survival, establishment, and spread of Bigheaded carps (Bighead and Silver carps) in the Great Lakes basin, and the magnitude of the ecological consequences, based on a qualitative scale and corresponding ranking of certainty, for up to 20 years and up to 50 years.Footnote 85
Following Mandrak, Cudmore and Chapman (2011), DFO (2012) divided the risk assessment process into three steps.Footnote 86
Firstly, it estimated the overall probability of an introduction of Asian carp (using estimates of likelihood of arrival, survival, establishment, and spread) as follows:
Probability of Introduction = Min [Max (Arrival, Spread), Survival, Establishment].
According to this formula, the overall probability of introduction was estimated sequentially by determining the highest ranking between ‘Overall Arrival and Spread’, incorporating the ranking to the ranks of ‘Survival and Establishment’, and finally taking the lowest rank of the three.
In the second step, the study determined the magnitude of the ecological consequences of an established population of Asian carp.
Finally, the results from step one and the magnitude of the ecological consequences were combined into a risk matrix to communicate an overall risk. Each lake was assessed at the 20 year and 50 year intervals.
The major findings of the ecological risk assessment of Bigheaded carps in connection to this socio-economic impact assessment study are as follows:
- Once having gained entry into the basin, most likely through the Chicago Area Waterway System (CAWS) into Lake Michigan, overall probability of introduction within the 20-year timeframe was very likely for lakes Michigan, Huron, and Erie, high for Lake Ontario (high certainty), and moderate for Lake Superior (moderate certainty);
- Bigheaded carps would survive and become established due to the availability of suitable food, and thermal and spawning habitats in the Great Lakes basin (particularly, in Lake Erie, including Lake St. Clair), and the high productivity embayments (shoreline indentations larger than a cove, but smaller than a gulf) of lakes Superior, Michigan, Huron and Ontario;
- The consequences of an established bigheaded carp population are expected to include changes in planktonic communities, reduction in planktivore (animals feeding primarily on plankton) biomass, reduced recruitment of fishes with early pelagic life stages, and reduced stocks of piscivores (fish-eating species); and
- A time lag is expected with respect to seeing the consequences of an established population of bigheaded carps in the Great Lakes.Footnote 87 Within 20 years, the magnitude of the ecological consequences was ranked moderate for all lakes, except Lake Superior, which was ranked low. Within 50 years, the magnitude of the consequences was ranked high for all lakes, except Lake Superior, which was ranked moderate. All ranks for consequences for all lakes in both time periods had moderate certainty. These ranks indicate the escalating consequences expected as the invasion and population numbers increase over time.
Chapter 7: Socio-Economic Impact Assessment
For this study, the socio-economic impacts that are direct consequences of the ecological outcomes of an introduction of Asian carp have been considered. These socio-economic impacts are tied to the DFO (2012) ecological risk assessment and form the basis for the socio-economic analysis.
DFO (2012) provided the scenario for the socio-economic impact analysis, both for the estimate of the impact as well as for a comparison of the values with those of the baseline. In order to estimate the socio-economic impact of the presence of Asian carp in the Great Lakes, the study also heavily relied on the overall probability of introduction and the consequence scale developed in the ecological risk assessment.
In order to set the stage (scenario) for impact assessment, following DFO (2012), the study assumed that in the absence of added prevention and protection, Asian carp will arrive, establish population, survive and spread due to the availability of suitable food, thermal and spawning habitats, and high productivity embayments in the Great Lakes basin.
As stated in Chapter 3, in addition to the results extracted from DFO (2012), expert scientific opinion was sought from a group of scientists involved in the DFO (2012) assessment, in order to establish a defensible foundation for the socio-economic impact assessment. The discussion largely focused on: (i) the activities/sectors that might be impacted; (ii) the impact trend over 20 years and 50 years; and (iii) permissible ways to use the quantitative scales of the overall probabilities for the impact analyses.
Based on the results reported in DFO (2012), Cudmore, Mandrak, Dettmers, Chapman, and Kolar (2012), and subsequent discussion with scientists, the study identified that, of the list of activities covered in the calculation of baseline values generated by the Great Lakes basin, Asian carp will cause moderate to high damage to commercial fishing, recreational fishing, recreational boating and the beaches and lakefront use sectors/activities during the period covered. Asian carp will cause either negligible or low impact on water use, recreational hunting, commercial navigation and oil and natural gas extraction sectors/activities. Moreover, it was also found that the extent of damage is lake specific and is directly linked to the ecological damages as well as to the level of activities dependent on the lakes.
The next section of this chapter provides a detailed discussion of the degree of damage caused by Asian carp in the Great Lakes by major activity impacted.
Commercial Fishing
In order to assess the impact on commercial fishing and related activities, it was necessary to project the expected ecological consequences on native species commercially fished in the Great Lakes. Cudmore et al. (2012) found that Asian carp were capable of causing significant changes in plankton (the base of the Great Lakes food web) and in phytoplankton compositions, with substantial repercussions for the aquatic ecosystem. The harmful ecological effects due to the presence of Asian carp are also widely documented in pertinent literature. The most common effects include decline in: (i) planktivorous (feeding primarily on plankton) fish species; (ii) fish diversity; and (iii) populations of several species with pelagic early life stages. Cudmore et al. (2012) concluded that if Asian carp became established in the Great Lakes with ample populations, a similar impact to those documented worldwide would be realized.
Cudmore et al. (2012) found that the diet of Asian carp (5-20% of its average 30-40 lb. body weight each dayFootnote 88) overlaps with that of native fish species. The competition for food resources would result in: (i) reduced abundance of near-shore planktivorous forage/prey/bait fishes (e.g. cisco, bloater, rainbow smelt) and adult piscivores (fish-eating species, such as lake trout), reduced growth rates, and reduced recruitment in Lake Superior; (ii) reduced abundance of near-shore planktivorous forage/prey/bait fishes (e.g. alewife, cisco, bloater, rainbow smelt, yellow perch) and adult piscivores (e.g. chinook salmon, lake trout, walleye, Northern pike), reduced growth rates, and reduced recruitment in Lake Huron; (iii) reduced abundance of planktivorous forage/prey/bait fishes (e.g. emerald shiner, gizzard shad, rainbow smelt, white perch), fishes with pelagic early life stages and adult piscivores (e.g. lake trout, rainbow trout, walleye, yellow perch), reduced growth rates, and reduced recruitment in Lakes Erie and St. Clair; and (iv) depending on dreissenid (family of small freshwater mussels) biomass, reduced alewife biomass by up to 90%, which could damage salmonine populations in Lake Ontario. It was also found that Asian carp show high flexibility in terms of food habits. They are capable of changing food behaviour in accordance with food availability, without any impact on their high survival rate.
Based on the results reported in DFO (2012) and Cudmore et al. (2012), the presence of Asian carp in the Great Lakes could cause damage to commercial fishing and related activities as follows:
Flowchart 1: Impact on Commercial Fishing Resulting from the Presence of Asian Carp
Description
Flowchart 1 is titled “Impact on Commercial Fishing Resulting from the Presence of Asian Carp.” The top element is “Asian Carp” and is shown to have two direct impacts: increasing operational costs (e.g. more clean-up and repair of nets) and increasing competition for food resources. Increasing operational costs has one direct impact, namely, decreasing profit. Decreased profit results in a decrease in harvesters’ revenue and vice versa. Decreased profit also results in decreased landings of native fish species. The increase in competition for food resources has two direct impacts: decreasing plankton and zooplankton and decreasing prey species. Both of these impacts contribute to a decrease in food availability, which in turn results in a decrease in commercially fished native fish species. This decrease also leads to decreased landings of native fish species. Decreased landings of native fish species have five direct impacts: 1) a decrease in harvesters’ revenue; 2) a decrease in the fish processing sector; 3) a decrease in fish exports and an increase in fish imports; 4) a decrease in complementary goods production; and 5) an increase in substitute goods production.

The presence of an Asian carp population would likely cause damage to the commercial fishing industry through both the supply and demand sides of the market.
As shown in the flow chart, the presence of Asian carp would increase costs and decrease revenues for commercial harvesters. It would increase the operational costs of commercial fishing industry (e.g. relocation of sites, frequent repair of nets), which would in turn reduce the fishing activities and profit earned by harvesters. The presence of Asian carp would also damage the commercial fishing industry through the expected impact on fishing revenue. The rationale is that the presence of Asian carp would increase competition for food resources with young and mature native species. Asian carp would reduce the plankton, zooplankton and prey species available for commercially harvested fish species. Prey species would be impacted through direct consumption by Asian carp as well as decreased food availability for themselves. Less food availability would adversely affect commercially targeted fish populations, which would in turn reduce the catches of commercially fished species and harvesters’ revenues/activities. The decrease in revenue would in turn reduce the level of gross profit and thereby create a circular flow of impact. From a demand perspective, the sector would also be adversely affected because of a reduced quality of native fish species, reflected through the smaller size of commercially targeted fish.
An analysis of harvest data for the year 2011 shows that 12,141 tonnes were harvested from the Great Lakes that year, generating a total landed value of $33.6 million (see Annex 4). Of the total harvest, Lake Erie accounted for 81.5% (9,894 tonnes), followed by Lake Huron with 13.9% (1,691 tonnes), Lake Superior with 2.9% (354 tonnes) and Lake OntarioFootnote 89 with 1.7% (203 tonnes). The major species harvested were perch (34.5%), rainbow smelt (22.1%), walleye (17.3%), lake whitefish (13.6%) and white bass (6.8%).
The current current study estimated that in 2018, the total present (market) value of the catches from Lakes Erie, Huron, Ontario, and Superior for the subsequent 20-year time period (2018 to 2038) would be $4.8 billion, based on inflation-adjusted market value. Of that total, Lake Erie accounted for 82.7% ($3.9 billion) followed by Lake Huron with 14.2% ($0.7 billion), Lake Superior with 1.7% ($82.4 million) and Lake Ontario with 1.4% ($65.0 million).
The current study also estimated that in 2018, the total present value of the catches from Lakes Erie, Huron, Ontario, and Superior for the subsequent 50-year time period (2018 to 2068) would be $10.3 billion, based on inflation-adjusted market value. Of that total, Lake Erie accounted for $8.6 billion, followed by Lake Huron with $1.5 billion, Lake Superior with $0.2 billion and Lake Ontario with $0.1 billion.
In terms of commercially harvested native fish species and based on observations of present Asian carp migration rates, it appears that Asian carp would be in direct competition with yellow perch and white bass, and that the same type of competitive interaction would occur to a lesser degree with whitefish, through benthic food (e.g. zooplankton) unavailability. Walleye, which has limited and variable reproduction, would be indirectly affected by the alterations in the food chain. Species of less commercial value, such as white sucker, rainbow smelt and northern pike, would likely be negatively affected by Asian carp through competition for food, and would decline. Degradation of water quality caused by Asian carp would also be a source of damage to populations of native fish species.
In order to estimate the impact of an arrival of Asian carp in the Great Lakes, the study applied the analyses for ecological consequences reported in DFO (2012) to the landings and market values for the time periods covered, and assumed that the ecological impact would similarly be transmuted to the species’ populations and landings. In addition, the study assumed the absence of any additional measures to prevent the presence of Asian carp from the Great Lakes basin. Based on the foregoing, the study anticipated that the commercial fishing industry in Lakes Erie, Huron and Ontario, which accounted for $4.7 billion of the total net present value of $4.8 billion (98.6% of total), would be moderately affected with high to moderate uncertainty in 20 years starting 2018.Footnote 90 Only commercial fishing in Lake Superior, which accounted for $65 million of the total (1.4% of total), is anticipated to have low impact with high to moderate uncertainty.
Description
Table 8 is titled “Estimated Present Values ($000) of Market Values in Commercial Fishing in 20 and 50 Years by Lake” and is sourced from a Fisheries and Oceans Canada staff calculation, Policy and Economics, Central and Arctic Region. The table has five columns. The first is captioned “Variables”; the second “Superior”; the third “Huron”; the fourth “Eerie”; the fifth “Ontario” and the sixth “Total.” There are two rows under “Variables” captioned “20 Years” and “50 Years.” Superior’s 20-year value is $64,998 and its 50-year value is $141,544. Huron’s 20-year value is $672,238 and its 50-year value is $1,463,917. Eerie’s 20-year value is $3,929,996 and its 50-year value is $8,558,253. Ontario’s 20-year value is $82,443 and its 50-year value is $179,535. The total 20-year value is $4,749,676 and the total 50-year value is $10,343,248.
| Variables | Superior | Huron | Erie | Ontario | Total |
|---|---|---|---|---|---|
| 20 Years | $64,998 | $672,238 | $3,929,996 | $82,443 | $4,749,676 |
| 50 Years | $141,544 | $1,463,917 | $8,558,253 | $179,535 | $10,343,248 |
Source: Fisheries and Oceans Canada staff calculation, Policy and Economics, Central and Arctic Region.
Table 8 shows that for the fifty year interval ending in 2068, the impact on the commercial fishing industry in Lakes Erie, Huron and Ontario, (which accounted for $10.2 billion of the total net present value of $10.3 billion (98.6%)), would be high, with moderate to high uncertainty. Only commercial fishing in Lake Superior, which accounted for $142 million of the total (1.4%), would be moderately affected, with moderate to high uncertainty.
The extent of the impact on commercial fishing by Great Lake is also related to the size and the depth of the lake. For example, 30% of the whitefish population spawns in Lake Erie. As it is the shallowest of all the Great Lakes, the impact on native fish species is anticipated to be higher because of more interaction between Asian carp and native fish species.Footnote 91 Moreover, some species (e.g. lake whitefish) have already been declining for some time because of other pernicious forces in place (e.g. zebra mussel). Any further decline exacerbated by Asian carp could render commercial fishing operations unsustainable, abolishing the commercial fishing industry from Lake Erie (which accounted for 81.5% of the catches in 2011), and subsequently from the entire Great Lakes.
As the commercially harvested fish species are impacted by the presence of Asian carp in the Great Lakes Basin, it is anticipated that all sectors associated with commercial fishing through forward and backward linkages would be proportionally impacted (e.g. food processing and export sectors). For example, the detrimental impact on the commercially harvested freshwater species would damage the freshwater fish processing sector (captured in market value), reduce (increase) international exports (imports) of freshwater fish and fish products, increase pressure on the freshwater fish species sourced from other jurisdictions in Canada, and to some extent, hamper the competitive environment in the food sector in the regional economy and in Canada overall.
From an export perspective, the major freshwater species internationally exported from Canada were perch, whitefish, pickerel, trout, pike and smelt in 2011; together these species represented 75.7% of the total freshwater export.Footnote 92 In 2011, Ontario exported 14,682 tonnes of freshwater fish product that yielded a total export value of $89.0 million.Footnote 93 Exports of freshwater species from the Great Lakes, particularly whitefish, pickerel, mullet and pike, face competition from harvests elsewhere in Canada, international competitors and other related products.
The impact of Asian carp in the Great Lakes would possibly trigger some (re)distributional effects in terms of production and employment, which might hamper the competitive environment. This is due to the presence of substitute/complementary products to freshwater species from the Great Lakes, which provide competing protein choices to fish at restaurants and supermarkets. For example, when the commercial fishing industry is impacted in a manner that adversely affects both the quality and price, consumers always have the potential to switch away from freshwater products to favourably priced substitute products (e.g. marine fish, chicken and beef). The higher demand for substitute products will result in higher levels of production, value added and employment in the substitute sectors and lower levels of production, value added and employment in commercial fishing sector.
An increased abundance of Asian carp could create income-generating opportunities, which might partially offset loss due to the reduced abundance of commercially harvested native fish species. So far, however, the commercial value of Asian carp has been quite low and much less than the native fish they would replace.Footnote 94
The impacts discussed above are anticipated to be, by and large, proportional to the ecological consequences reported in DFO (2012) and Cudmore et al. (2012). It is also noteworthy that given the immense size of the Great Lakes and its complex ecosystems and food webs, a proper forecast on the magnitude of Asian carp impact, as well as the timeline for that impact to emerge on native fish abundance, is quite challenging.Footnote 95 For example, if the actual rate of arrival/migration differs from the predicted rate in DFO (2012) and Cudmore et al. (2012), both magnitude and realization of impact time will differ markedly.
Recreational Fishing
In order to estimate the impact of Asian carp presence on recreational fishing in the Great Lakes basin, it was necessary to determine how angler days would be reduced due to a deterioration of angler day quality. Based on the results reported in DFO (2012) and Cudmore et al. (2012), the presence of Asian carp in the Great Lakes Basin would damage recreational fishing activities as follows:
As shown in the flow chart, the rationale is that if catch rates were reduced by decrease in fish populations, demand for trips would likely decrease proportionally, which would in turn lead to a decrease in angling days, and hence a decrease in the recreational fishing activities in the Great Lakes, measured by a decrease in expenditures related to recreational fishing and consumer surplus.
The anglers in the Great Lakes are made up of (i) Canadian residents of Ontario; (ii) Canadians non-resident to Ontario; and (iii) foreign anglers visiting Canada. DFO (2008) found that in 2005, of the total 4.8 million days fished, resident anglers accounted for about 4.2 million days, while non-resident Canadian anglers accounted for 23,412 days fished in the Great Lakes basin. Foreign anglers accounted for the remaining 11.5% of days (554,000).Footnote 96
Flowchart 2: Impact on Recreational Fishing Resulting from the Presence of Asian Carp
Description
Flowchart 2 is titled “Impact on Recreational Fishing Resulting from the Presence of Asian Carp.” Asian Carp is the top element with a direct impact of increasing competition for food resources, which in turn decreases plankton and zooplankton and decreases prey species. Both of these decreases result in decreased food availability, causing a decrease in native fish species. Fewer native fish species mean a decreased catch rate of these species, resulting in a decrease in demand for trips. Less demand results in a decrease in angling days, which in turn causes a decrease in consumer surplus, a decrease in recreational fishing related expenditure and investment, and an increase in substitute activities. When recreational fishing related expenditure and investment drop, so does complementary goods production, and when there is a jump in substitute activities, there is also a jump in the substitute goods producing sector.
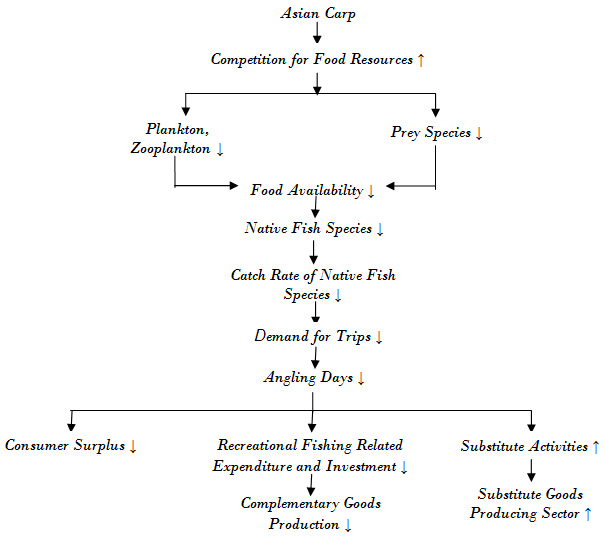
Description
Table 9 is titled “Major Purchases/Investments and Direct Expenditures ($000) by Type of Anglers and Lake, 2005” and is sourced from DFO 2008. The table has seven columns. The first is captioned “Variables”; the second “Lake Ontario”; the third “Lake Eerie”; the fourth “Lake St. Clair”; the fifth “Lake Huron”; the sixth “Lake Superior”; the seventh “St. Lawrence River”; and the eighth “Great Lakes System.” Variables are divided under two main rows “Major Purchases/Investments,” sub-divided by resident angler, non-resident angler and foreign angler”, and “Direct Expenditures,” also sub-divided by resident angler, non-resident angler and foreign angler. The major purchases/investments for Lake Ontario total $47.97 thousand, broken down as follows: $47,430 for resident angler, $123 for non-resident angler and $417 for foreign angler. The direct expenditures for Lake Ontario total $44.93 thousand, broken down as follows: $39,226 for resident angler, $1,396 for non-resident angler and $4,305 for foreign angler. The grand total for Lake Ontario is $93 thousand. The major purchases/investments for Lake Eerie total $50.76 thousand, broken down as follows: $45,924 for resident angler, no value for non-resident angler and $4,840 for foreign angler. The direct expenditures for Lake Eerie total $33.37 thousand, broken down as follows: $29,368 for resident angler, $2 for non-resident angler and $4,001 for foreign angler. The grand total for Lake Eerie is $84 thousand. The major purchases/investments for Lake St. Clair total $14.17 thousand, broken down as follows: $14,125 for resident angler, $20 for non-resident angler and $25 for foreign angler. The direct expenditures for Lake St. Clair total $13.91 thousand, broken down as follows: $8,157 for resident angler, $1 for non-resident angler and $5,751for foreign angler. The grand total for Lake St. Clair is $28 thousand. The major purchases/investments for Lake Huron total $69.19 thousand, broken down as follows: $62,093 for resident angler, $2 for non-resident angler and $7,095 for foreign angler. The direct expenditures for Lake Huron total $92.13 thousand, broken down as follows: $69,685 for resident angler, $357 for non-resident angler and $22,087 for foreign angler. The grand total for Lake Huron is $161 thousand. The major purchases/investments for Lake Superior total $10.29 thousand, broken down as follows: $7,521 for resident angler, no value for non-resident angler and $2,772 for foreign angler. The direct expenditures for Lake Superior total $17.06 thousand, broken down as follows: $9,108 for resident angler, $42 for non-resident angler and $7,912 for foreign angler. The grand total for Lake Huron is $27 thousand. The major purchases/investments for the St. Lawrence River total $36.01 thousand, broken down as follows: $35,752 for resident angler, $2 for non-resident angler and $252 for foreign angler. The direct expenditures for the St. Lawrence River total $13.21 thousand, broken down as follows: $7,707 for resident angler, $276 for non-resident angler and $5,225 for foreign angler. The grand total for the St. Lawrence River is $49 thousand. The major purchases/investments for the Great Lakes System total $228,394, broken down as follows: $212,846 for resident angler, $147 for non-resident angler and $15,401 for foreign angler. The direct expenditures for the Great Lakes System total $214,607, broken down as follows: $163,251 for resident angler, $2,075 for non-resident angler and $49,281 for foreign angler. The grand total for the Great Lakes System is $443,000.
| Variables | Lake Ontario | Lake Erie | Lake St. Clair | Lake Huron | Lake Superior | St. Lawrence River | Great Lakes System |
|---|---|---|---|---|---|---|---|
| Major Purchases/Investments | $47.97 | $50.76 | $14.17 | $69.19 | $10.29 | $36.01 | $228,394 |
| Resident Angler | $47,430 | $45,924 | $14,125 | $62,093 | $7,521 | $35,752 | $212,846 |
| Non-Resident Angler | $123 | - | $20 | $2 | - | $2 | $147 |
| Foreign Angler | $417 | $4,840 | $25 | $7,095 | $2,772 | $252 | $15,401 |
| Direct Expenditures | $44.93 | $33.37 | $13.91 | $92.13 | $17.06 | $13.21 | $214,607 |
| Resident Angler | $39,226 | $29,368 | $8,157 | $69,685 | $9,108 | $7,707 | $163,251 |
| Non-Resident Angler | $1,396 | $2 | $1 | $357 | $42 | $276 | $2,075 |
| Foreign Angler | $4,305 | $4,001 | $5,751 | $22,087 | $7,912 | $5,225 | $49,281 |
| Grand Total | $93 | $84 | $28 | $161 | $27 | $49 | $443,000 |
Source: DFO (2008).
For Canadian economy, if recreational fishing on the Great Lakes is impacted, there is an impact on resident and non-resident Canadian anglers’ expenditures and consumer surplus, and foreign expenditure that is associated with Great Lakes recreational fishing. As stated before, the argument here is that the non-resident, non-Canadian (foreign) consumer surplus is not a benefit to Canada, but the foreign expenditure is. The foreign expenditure would be lost if those visitors chose to spend their money in their own country instead of in the Canadian Great Lakes region.Footnote 97
The study estimated that in 2018, based on inflation-adjusted values for the subsequent 20-year time period, the total present value of the recreational expenditures and consumer surplus (excluding foreign consumer surplus) at Lakes Erie, Huron, Ontario, Superior, St. Clair and St. Lawrence would be approximately $11.8 billion (see Table 10). Of the total, Lake Huron accounted for $4.4 billion (37%), followed by Lake Erie (including St. Clair) with $3.0 billion (25%), Lake Ontario with $2.5 billion (21.0%), St. Lawrence with $1.3 billion (10.7%), and Lake Superior with $0.7 billion (6.0%).
Description
Table 10 is titled “Estimated Present Values ($Mil.) of Recreational Fishing Expenditures and Consumer Surplus in 20 and 50 Years by Lake” and is sourced from a Fisheries and Oceans Canada staff calculation, Policy and Economics, Central and Arctic Region. The table has seven rows. The first is captioned “Variables”; the second “Superior”; the third “Huron”; the fourth “Eerie & St. Clair”; the fifth “Ontario”; the sixth “St. Lawrence”; and the seventh “Total.” There are two main rows under “Variables” captioned “20 Years” and “50 Years.” Each has three sub-rows captioned “Domestic Con. Surplus,” “Domestic Expenditure” and “Foreign Expenditure.” The 20-year total, domestic con. surplus, domestic expenditure and foreign expenditure values for Superior are $702 million, $57 million, $393 million and $252 million, respectively. The 50-year total, domestic con. surplus, domestic expenditure and foreign expenditure values for Superior are $1,528 million, $124 million, $856 million and $548 million, respectively. The 20-year total, domestic con. surplus, domestic expenditure and foreign expenditure values for Huron are $4,345 million, $543 million, $3,114 million and $688 million, respectively. The 50-year total, domestic con. surplus, domestic expenditure and foreign expenditure values for Huron are $9,462 million, $1,183 million, $6,781 million and $1,498 million, respectively. The 20-year total, domestic con. surplus, domestic expenditure and foreign expenditure values for Erie & St. Clair are $2,949 million, $305 million, $2,300 million and $344 million, respectively. The 50-year total, domestic con. surplus, domestic expenditure and foreign expenditure values for Eerie & St. Clair are $6,422 million, $663 million, $5,009 million and $750 million, respectively. The 20-year total, domestic con. surplus, domestic expenditure and foreign expenditure values for Ontario are $2,493 million, $304 million, $2,078 million and $111 million, respectively. The 50-year total, domestic con surplus, domestic expenditure and foreign expenditure values for Ontario are $5,429 million, $661 million, $4,525 million and $242 million, respectively. The 20-year total, domestic con. surplus, domestic expenditure and foreign expenditure values for the St. Lawrence are $1,262 million, $102 million, $1,031 million and $129 million, respectively. The 50-year total, domestic con. surplus, domestic expenditure and foreign expenditure values for the St. Lawrence are $2,749 million, $223 million, $2,245 million and $281 million, respectively. The 20-year total, domestic con. surplus, domestic expenditure and foreign expenditure values for the Total column are $11,751 million, $1,311 million, $8,916 million and $1,524 million, respectively. The 50-year total, domestic con. surplus, domestic expenditure and foreign expenditure values for the Total column are $25,590 million, $2,854 million, $19,416 million and $3,320 million, respectively.
| Variables | Superior | Huron | Erie & St. Clair | Ontario | St. Lawrence | Total |
|---|---|---|---|---|---|---|
| 20 Years | $702 | $4,345 | $2,949 | $2,493 | $1,262 | $11,751 |
| Domestic Con. Surplus | $57 | $543 | $305 | $304 | $102 | $1,311 |
| Domestic Expenditure | $393 | $3,114 | $2,300 | $2,078 | $1,031 | $8,916 |
| Foreign Expenditure | $252 | $688 | $344 | $111 | $129 | $1,524 |
| 50 Years | $1,528 | $9,462 | $6,422 | $5,429 | $2,749 | $25,590 |
| Domestic Con. Surplus | $124 | $1,183 | $663 | $661 | $223 | $2,854 |
| Domestic Expenditure | $856 | $6,781 | $5,009 | $4,525 | $2,245 | $19,416 |
| Foreign Expenditure | $548 | $1,498 | $750 | $242 | $281 | $3,320 |
Source: Fisheries and Oceans Canada staff calculation, Policy and Economics, Central and Arctic Region.
As shown in Table 10, the study calculated that in 2018, based on inflation-adjusted market value for the subsequent 50-year time period, the total present value of the recreational expenditures and consumer surplus (excluding foreign consumer surplus) would be $25.6 billion. Of that total, Lake Huron accounted for $9.5 billion, followed by Lake Erie (including St. Clair) ($6.4 billion), Lake Ontario ($5.4 billion), St. Lawrence ($2.8 billion) and Lake Superior ($1.5 billion).
In terms of species caught in recreational fishing, DFO (2008) found that in 2005, the major species caught by anglers were perch (31.9%), bassFootnote 98 (23.2%), whitefish (8.1%), pike (5.0%), and troutFootnote 99 (9.0%)Footnote 100 (see Annex 5).
In the absence of additional measures to prevent the presence of Asian carp to minimize the damages to the recreational fishing activities in the Great Lakes basin, the study anticipated that in 20 years starting in 2018, resident and non-resident Canadian anglers’ expenditure and consumer surplus, and foreign expenditure associated with recreational fishing in Lakes Erie, Huron and Ontario would be moderately affected, with moderate to high uncertainty.Footnote 101 For Lake Superior the impact would be low, with moderate to high uncertainty.
Employing a 50 year horizon starting in 2018, the impact on resident and non-resident Canadian angler consumer surplus and foreign expenditure associated with recreational fishing in Lakes Erie, Huron and Ontario would be high, with moderate to high uncertainty. Lake Superior would be moderately affected, with moderate to high uncertainty.
As stated earlier, it is expected that damage to recreationally harvested fish species caused by the presence of Asian carp in the Great Lakes basin would be followed by some relocation of expenditures of resident and non-resident Canadians to other sectors in the economy.Footnote 102 With moderate to high uncertainty, the study estimated that over 20 years and 50 years starting 2018, the present value of the relocation of expenses by Canadians from Lakes Erie, Huron, Ontario and Superior would be in the amount of $7.9 billion and $17.2 billion, respectively.Footnote 103
In addition to damage from ecological consequences found in DFO (2012) and Cudmore et al. (2012), the presence of Asian carp might discourage recreational fishing through direct harm to people. Silver carp is reported to startle easily at the sound of a boat motor, leading them to leap out of the water and land in boats, and thereby damage property and injure boaters. They are reported to break fishing rods, windshields and other equipment in a boat. Furthermore, once they land in the boat, they leave slime, blood and excrement.
The jumping behavior of Asian carp might not only discourage people from fishing, but also result in a transfer of wealth from boat owners to service providers operating in the Great Lakes region. While Asian carp might raise the operational and maintenance costs of boat owners (e.g. installing protective equipment), the study recognizes that the additional costs borne on boat owners would be a mere transfer of resources from boat owners to those service providers.Footnote 104
Apart from recreational fishing, anglers also seek opportunities to enjoy other supplementary outdoor activities while on trips. The Canadian Tourism Commission (2006) found that relative to the average Canadian pleasure traveler, anglers were also more likely to go boating, swimming and wildlife viewing while on trips. Anglers were especially more likely to have attended sporting events (e.g., professional sporting events, amateur tournaments) and attractions with an agricultural or western theme (e.g., agro-tourism, equestrian and western events). Reduced recreational fishing and related activities will have economic impact to those whose livelihood depends on the development of this sector. The impacts on such subsidiary activities are anticipated to be notable, but are not quantified due to insufficient information.
Recreational Boating
Great Lakes boaters, water-skiers, and others who go out on the water for pleasure will be adversely affected by the presence of Asian carp through the hazards the fish present to boaters (e.g. injury to boaters), as described earlier in this study in the recreational fishing section, and by reduced opportunities for water sports, pleasure boating and sailing. Moreover, like recreational fishing, recreational boating in the Great Lakes will be impacted through higher operational and maintenance costs associated with boating in waters where Asian carp have become established.
Description
Table 11 is titled “Projected Present Values ($000) of Recreational Boating Expenditures and Consumer Surplus in 20 and 50 Years” and is sourced from a Fisheries and Oceans Canada Staff calculation, Policy and Economics, Central and Arctic Region. The table has five columns. The first is “Variables”; the second is “Boating Expenses”; the third is “Tourism”; the fourth is “Consumer Surplus”; the fifth is “Total”. There are two rows under the Variables column captioned “20 Years” and “50 Years”. The 20-year and 50-year values for boating expenses are $108,982,348 and $237,328,071, respectively. The 20-year and 50-year values for tourism are $37,696,090 and $82,089,811, respectively. The 20-year and 50-year values for consumer surplus are $6,234,075 and $13,575,786, respectively. The 20-year and 50-year values for the total column are $152,912,513 and $332,993,668, respectively.
| Variables | Boating Expenses | Tourism | Consumer Surplus | Total |
|---|---|---|---|---|
| 20 Years | $108,982,348 | $37,696,090 | $6,234,075 | $152,912,513 |
| 50 Years | $237,328,071 | $82,089,811 | $13,575,786 | $332,993,668 |
Source: Fisheries and Oceans Canada Staff calculation, Policy and Economics, Central and Arctic Region.
The study estimated that the present value of boaters’ consumer surplus and foreign expenditure associated with recreational boating in the Great Lakes basin was in the amounts of $43.9 billion and $95.7 billion, in 20 years and 50 years, respectively, starting in 2018 (see Table 11). In the absence of additional measures to prevent the presence of Asian carp to minimize the damages to the recreational boating activities in the Great Lakes basin, boaters’ consumer surplus and foreign expenditure associated with recreational boating in the Great Lakes would be jeopardized to an extent relative to the scope of the jumping behavior of silver carp.Footnote 105
Similar to recreational fishing, it is anticipated that there would be some relocation of expenses by resident/non-resident Canadians to other sectors due to the expected damage to recreationally boating and related activities.Footnote 106 The study estimated that the present value of the expenses for boating by Canadians in the Great Lakes was $109.0 billion and $237.3 billion, in 20 years and 50 years respectively, starting in 2018, and that this value would be relocated to some extent relative to the scope of the jumping behavior of silver carp.
Wildlife Viewing
Since Asian carp consume cladophora,Footnote 107 they may cause Cladophora mats in the Great Lakes basin to expand, particularly around the near-shore areas.Footnote 108 Decomposing Cladophora provides a breeding ground for enteric bacteria, including some pathogens which can produce dangerous toxins. Using traditional microbiological and DNA-based techniques, studies found that cladophora provided suitable habitat for indicator bacteria, and potentially for pathogens, to persist and grow. This may in turn impact beach water quality (GLSC Fact Sheet 2009).
Despite the Great Lakes clean-ups in the 1970s, there has been a resurgence of cladophorain the Great Lakes in recent years for a variety of reasons (e.g. zebra and quagga mussels, agricultural operations, sewage). Mass cladophora accumulations along shorelines have been documented to affect recreational activities (e.g. wildlife viewing), potentially influencing water quality, and causing significant health and economic concerns (GLSC Fact Sheet 2009). The presence of Asian carp will enhance cladophora build-up capacity in the Great Lakes, increase cladophora-related problems, pose increased health risk to Great Lakes users, and contribute to a decreased level of wildlife viewing activities around the Great Lakes basin.
The study estimated that the present values of resident wildlife viewers’ consumer surplus associated with wildlife viewing in the Great Lakes basin are in the amounts of $1.1 billion and $2.4 billion in 20 years and 50 years, respectively, starting in 2018 (see Table 12).
Description
Table 12 is titled “Estimated Present Values ($000) of Wildlife Viewing Expenditures and Consumer Surplus in 20 and 50 Years” and is sourced from a Fisheries and Oceans Canada staff calculation, Policy and Economics, Central and Arctic Region. The table has five columns. The first is “Variables”; the second is “Viewing Expenses”; the third is “Tourism”; the fourth is “Consumer Surplus”; the fifth is “Total”. There are two rows under the Variables column captioned “20 Years” and “50 Years”. The 20-year and 50-year values for viewing expenses are $3,453,391 and $7,520,362, respectively. The 20-year and 50-year values for tourism are not available. The 20-year and 50-year values for consumer surplus are $1,108,425 and $2,413,789, respectively. The 20-year and 50-year values for the total column are $4,561,816 and $9,934,151, respectively.
| Variables | Viewing Expenses | Tourism | Consumer Surplus | Total |
|---|---|---|---|---|
| 20 Years | $3,453,391 | NA | $1,108,425 | $4,561,816 |
| 50 Years | $7,520,362 | NA | $2,413,789 | $9,934,151 |
Source: Fisheries and Oceans Canada staff calculation, Policy and Economics, Central and Arctic Region.
Note: NA – Not available.
In the absence of additional measures to prevent the presence of Asian carp from the Great Lakes basin, viewers’ consumer surplus associated with these activities would be to some degree jeopardized, relative to the extent of deterioration of water quality and cladophora-related problems caused by the presence of Asian carp.
Similar to recreational fishing/boating, it is anticipated that there would be some relocation of expenditures by resident Canadians to other sectors in the economy due to the expected damage to wildlife viewing activities.Footnote 109 The study estimated that the present values of the expenses for viewing by resident Canadians in the Great Lakes were $3.5 billion and $7.5 billion in 20 years and 50 years, respectively, starting in 2018, and that these values would be relocated relative to the extent of the problems caused by the presence of Asian carp.Footnote 110
Beaches and Lakefront Use
The impact the presence of Asian carp would present to beach and lakefront use can be linked to the increased accumulation of cladophora mats.Footnote 111
Similar to recreational fishing, boating and wildlife viewing, it is likely that there would be some relocation of expenditures by beach users to other sectors in the economy due to the expected damage to beaches and lakefront use activities that the presence of Asian carp would cause.Footnote 112 The study estimated that the present values of the expenses for beach use in the Great Lakes were $5.2 billion and $11.3 billion in 20 years and 50 years, respectively, starting in 2018, and that these values would be relocated relative to the extent of the problems caused by the presence of Asian carp.Footnote 113
Other Sectors
As stated above, based on DFO (2012), Cudmore et al. (2012) and subsequent discussions with scientists, the study found that Asian carp would likely have either negligible or no impact on recreational hunting,Footnote 114 water use, commercial navigation, and oil and natural gas extraction activities.
Ecosystem Services
The variability in ecosystem services might increase upon the presence of Asian carp. As firms/households generally prefer to avoid risk or to be compensated for the changes which might be seen as an additional impact of the presence of Asian carp.Footnote 115
Social and Cultural Impact
Over time, the presence of Asian carp to the Great Lakes basin could change lake ecosystems from ones dominated by native fish species to ecosystems dominated by carp, and has the potential to damage the public image of these lakes regionally, nationally and internationally. It would also harm the well-being of residents living close to such a unique natural resource.
Despite that Asian carp may present an opportunity for subsistence harvests and harvesters are adaptive to changing environment, Asian carp species may significantly damage subsistence harvests of native species from the Great Lakes and reduce the social, cultural and spiritual values of the lakes and of lake-related activities. Subsistence harvests may be impacted due to (i) change in ecosystem which may result in less native species as well as poor food quality for subsistence harvesters with negative impacts on subsistence harvesters and communities; and (ii) gaining access to subsistence fishing may be impaired and/or may require travelling greater distances which will increase costs of harvesting. This will weaken/obsolete traditional knowledge and observations, and inter-generational transfer of knowledge and culture and change ways of life. Finally, the presence of Asian carp may also encourage the increased level of (i) competition among subsistence harvesters/communities for fewer native fish species; and (ii) conflict and competition with recreational and commercial harvesters if changes causes fewer species availability. Quantitative assessments of these impacts are not feasible due to a lack of pertinent information.
Chapter 8: Conclusion
The goal of this study was to provide a detailed socio-economic impact assessment of the potential impacts that would stem from the presence of Asian carp in the Great Lakes basin. The study, and in particular, the predicted impacts that are provided, is intended to complement the ecological risk assessment in attempting to quantify the socio-economic impact of a potential Asian carp establishment in the Great Lakes.
While additional secondary source information was used, the report heavily relied on the bi-national (Canada -US) ecological risk assessment to describe the Asian carp threat to the Great Lakes led by CEARA, DFO. The ecological risk assessment report, including the supplementary reports, provided a solid and defensible foundation for assessing the socio-economic impacts that would result from the presence of Asian carp in the Great Lakes basin.
The study estimated that the value of economic contributions of activities in and around the Great Lakes basin that are closely linked to the lakes themselves to the Canadian economy is in the amount of $13.8 billion dollars. Of that total, expenditures made as well as imputed values/prices for the activities in and around the Great Lakes comprised $13.4 billion (96.9%), while consumer surplus constituted the remaining $0.4 billion (3.1%).
The study recognized that the Great Lakes basin provides invaluable services to society through maintaining ecosystem health and biodiversity. The intrinsic values of ecosystem health and biodiversity are, however, hard to define, because they are much more intangible than other benefits, such as commercial fish harvesting (Krantzberg et al., 2008, 2006). The study found a similar challenge in quantitatively capturing the benefits of option and non-use values based on the existing set of information. However, it has been stated that the total non-use values might fall in the range of 60% - 80% of the total economic value (Freeman, 1979).
The Great Lakes provide considerable subsistence, social, cultural, and spiritual benefits to the people residing in the region and to the economy as a whole. Freshwater fisheries have contributed substantially to preserving traditional aboriginal lifestyles in the study region. Socially, the Great Lakes beaches and shorelines provide a “sense of place” and a unique source of community pride and are the key public perception measures of environmental quality. The Great Lakes also provide opportunities for research and educational activities that result in a better understanding of the ecology.
The study estimated that, starting in 2018, the total present (economic) values of the activities (commercial fishing, recreational fishing, recreational boating, wildlife viewing, and the beaches and lakefront use) in 20 years and 50 years were $179 billion and $390 billion, respectively, which may be affected due to the presence of Asian carp in the Great Lakes basin (see Table 13 and Annex 6 for Heat-Maps on risk and uncertaintiesFootnote 116).
Description
Table 13 is titled “Estimated Present Values (billion) of Affected Activities in the Great Lakes in 20 and 50 Years by Activity” and is sourced from a Fisheries and Oceans Canada staff calculation, Policy and Economics, Central and Arctic Region. The table has four columns. The first is “List of Activities”; the second “Base Year (Mil.); the third “20 Years (Bil.)”; and fourth “50 Years (Bil.)”. There are six rows. Row 1 is Commercial Fishing with base year, 20-year and 50-year values of $227 million, $5 billion and $10 billion, respectively. Row 2 is Recreational Fishing with base year, 20-year and 50-year values of $560 million, $12 billion and $26 billion, respectively. Row 3 is Recreational Boating with base year, 20-year and 50-year values of $7,291 million, $153 billion and $333 billion, respectively. Row 4 is Wildlife Viewing with base year, 20-year and 50-year values of $218 million, $5 billion and $10 billion, respectively. Row 5 is Beaches and Lakefront Use with base year, 20-year and 50-year values of $248 million, $5 billion and $11 billion, respectively. Row 6 is the Total with base year, 20-year and 50-year values of $8,544 million, $179 billion and $390 billion, respectively.
| List of Activities | Base Year (Mil.) | 20 Years (Bil.) | 50 Years (Bil.) |
|---|---|---|---|
| Commercial Fishing | $227 | $5 | $10 |
| Recreational Fishing | $560 | $12 | $26 |
| Recreational Boating | $7,291 | $153 | $333 |
| Wildlife Viewing | $218 | $5 | $10 |
| Beaches and Lakefront Use | $248 | $5 | $11 |
| Total | $8,544 | $179 | $390 |
Source: Fisheries and Oceans Canada staff calculation, Policy and Economics, Central and Arctic Region.
Moreover, the study found that Asian carp would likely have either negligible or no impact on recreational hunting, water use, commercial navigation, and oil and natural gas extraction activities.
Finally, the study recognized that during the period considered, there could be factors in the economy at work that might create counteracting forces on the impacts of Asian carp on communities, businesses, and individuals. Therefore, the net economic impacts might be counterbalanced at the regional and national levels, while remaining significant for the stakeholders (e.g. communities, harvesters, users), when taking into account the (re)distribution of income and employment as a consequence of change in the scale of activities in and around the Great Lakes basin.
As discussed in Chapter 4, the estimations of the economic contributions of the Great Lakes discussed in this report should be viewed as conservative estimates. The study attempted to ensure this by adjusting estimation variables where significant variations and uncertainties existed, and by using reasonable proxies based on literature review and experts’ opinions.
It was also noted that the baseline values generated by activities in and around the Great Lakes basin should not be directly compared with those provided in the extant literature, because of differences in methodology followed by different studies. Methodologies varied in terms of scope, estimation procedures, time periods considered, and industries covered. Variances in estimations have also arisen due to considerations of whether to include both Canada and the US, and secondary multiplier effects (indirect and induced) in appraising the baseline values as well as the impacts.
The study suffered from some limitations due to a lack of information, which focuses the areas for further research. While collecting and analyzing information for the purpose of this study, the most notable obstacles/limitations identified are:
- Lack of Great Lakes specific information by activity;
- The values by activity predicted in 20 and 50 years are based on the values by activity for the most recent year assuming that the values will prevail for the time period covered if everything else is remaining the same. In reality economic conditions or values (e.g. commercial fishing, recreational fishing) may change rapidly over time. Moreover, the presence of overlaps in some activities (e.g. recreational fishing and recreational boating) and/or complementarity and substitutability of goods/activities, predictions based on such specific (equilibrium) conditions may inflict upward and/or downward biases.
- Lack of a more explicit linkage between the ecological consequences proposed in DFO (2012) and the socio-economic factors proposed in the current document. The study assumed linearity between ecological and socio-economic impact and uncertainty and drew conclusions based on the present values of the activities and cited the verbal ranking of the results from DFO (2012). A revision of the study based on a quantitative scale of ecological consequence that could be linked to socio-economic consequences would provide a more accurate socio-economic impact assessment in a quantitative manner.
- Lack of adequate information to provide an incremental/marginal analysis showing a quantitative estimate or a range of estimates of the socio-economic impact of the presence of Asian carp.
These limitations have been mitigated to some extent through the adoption of assumptions and application of proxies from the extant literature, with appropriate adjustments as and when needed, within the existing time constraints. However, the appropriate remedy for these limitations would be further research. For example, in order to have a proper assessment of baseline value(s), a possible next step might be to undertake a comprehensive survey in the study area to obtain values (including willingness to pay and subsistence harvests) being generated by activity and by lake. Similarly, for forecasting, estimation methodologies such as Computable General Equilibrium model, which try to identify parameters important to a decision or set of decisions in part to reflect welfare changes from complementarity and substitutability of key goods, may mitigate biases associated with forecasting.
Bibliography
Ashcroft, P., Duffy, M., Dunn, C., Johnston, T., Koob, M., Merkowshy, J., Murphy, K., Scott, K., and Senik, B. (2006). The Saskatchewan Fishery – History and Current Status. Saskatchewan Environment. Technical Report No. 2006-2.
Austin, J. C., Anderson, S., Courant, P. N., and Litan, R. E. (2007a) America’s North Coast: A Benefit-Cost Analysis of a Program to Protect and Restore the Great Lakes. Washington: Brookings Institution.
_________ (2007b) Healthy Waters, Strong Economy: The Benefits of Restoring the Great Lakes Ecosystem. Metropolitan Policy Program. Washington: Brookings Institution.
Bailey, S. A. Deneau, M. G., Jean, J., Wiley, C. J., Leung, B., and MacIsaac, H. J. (2011). Evaluating Efficacy of an Environmental Policy to Prevent Biological Invasions. Environmental Science & Technology, 45(7), 2554-2561.
Barnhart, Gerald A. (2005). The Threat Posed To The Great Lakes Basin By Asian Carp. Statement of Gerald A. Barnhart to House Subcommittee on Fisheries and Oceans. Michigan: Great Lakes Fisheries Commission, November.
Braden, J. B., Won, D., Taylor, L. O., Mays, N., Cangelosi, A., and Patunru, A. A. (2008). Economic Benefits of Remediating the Sheboygan River, Wisconsin Area of Concern. Journal of Great Lakes Research 34, 649–660.
Brox, J.A., Kumar, R.C., and Stollery, K.R. (2003). Estimating Willingness to Pay for Improved Water Quality in the Presence of Item Nonresponse Bias.American Journal of Agricultural Economics, 2003, 85(2), 414-428.
Bruneau, J. (2007). Economic Value of Water in the South Saskatchewan River Basin. In Martz, L., Bruneau, J., and Rolfe, J. T. (eds.), Climate Change and Water (pp. 111-192). South Saskatchewan River Basin Final Technical Report 2007.
Canada. Department of Fisheries and Oceans. (2012). Binational ecological risk assessment of the bigheaded carps (Hypophthalmichthys spp.) for the Great Lakes basin. DFO Can. Sci. Advis. Sec. Sci. Advis. Rep. 2011/071.
Canada. Department of Fisheries and Oceans. (2008). Survey of Recreational Fishing in Canada 2005. Selected Results for the Great Lakes Fishery. Ottawa: Department of Fisheries and Oceans.
Canada. Treasury Board of Canada Secretariat. (2007). Canadian Cost-Benefit Analysis Guide - Regulatory Proposals (PDF 250,79 KB). Catalogue No. BT58-5/2007. Ottawa: Treasury Board of Canada Secretariat.
Canada. Department of Fisheries and Oceans. (2004). A Canadian Action Plan to Address the Threat of Aquatic Invasive Species. Canadian Council of Fisheries and Aquaculture Ministers Aquatic Invasive Species Task Group, September.
Canada. Environment Canada (2011, April 14). The Canada-Ontario Agreement Respecting the Great Lakes Basin Ecosystem (COA) has been extended to March 2011. Retrieved April 14, 2011.
Canada. Environment Canada (2010, April 20). Great Lakes Quickfacts. Retrieved April 14, 2011.
Canada. Environment Canada. (2010). Lake Superior Aquatic Invasive Species Complete Prevention Plan. Lake Superior Lakewide Management Plan Committee.
Canada. Environment Canada. (2004). An Invasive Alien Species Strategy for Canada. September.
Canada. Environment Canada. (1990). Great Lakes – St. Lawrence River Regulation. Water Planning and Management Branch. Ontario: Environment Canada.
Canada. Statistics Canada. (2005). Industrial Water Use. Retrieved on December 13, 2011.
Canada. Statistics Canada. (2008). Shipping in Canada 2008. Catalogue no. 54-205-X.
Canadian Shipowners Association. (2006). An Industry on the Move. Report 2006. Retrieve on February 1, 2012.
Connelly, N. A., Brown, T. L., & Brown, J. W. (2007). Measuring the Net Economic Value of Recreational Boating as Water Levels Fluctuate. Journal of the American Water Resources Association (JAWRA) 43(4), 1016-1023.
Costanza, R., d'Arge, R., de Groot,R., Farber, s., Grasso, M., Hannon, B., Limburg, K., Naeem, S., O'Neill, R.V., Paruelo, J., Raskin, R.G., Sutton, P. and van den Belt, M. (1997). The Value of the World's Ecosystem Services and Natural Capital. Nature, 387, 253-260.
Crutchfield, S.R, Cooper, J., and Hellerstein, D. (1997). Benefits of Safer Drinking Water: The Value of Nitrate Reduction.U.S. Dept. Agr.. Econ. Res. Serv., AER-752.
Cudmore, B., Mandrak, N.E., Dettmers, J., Chapman, D.C., and Kolar, C.S. (2012).
Binational Ecological Risk Assessment of Bigheaded Carps (Hypophthalmichthys spp.) for the Great Lakes Basin. DFO Can. Sci. Advis. Sec. Res. Doc. 2011/114.
Dachraoui, K., and Harchaoui, T.M., (2004). Water Use, Shadow Prices and the Canadian Business Sector Productivity Performance. Micro-economic Analysis Division. Statistics Canada. Economic Analysis (EA) Research Paper Series. Catalogue no. 11F0027MIE — No. 026.
David Suzuki Foundation. (2008). Ontario’s Wealth, Canada’s Future: Appreciating the Value of the Greenbelt’s Eco-Services. Canada: Vancouver.
Derek Murray Consulting Associates. (2006). Economic Evaluation of Saskatchewan's Commercial and Non-Outfitted Sport Fishing. Prepared for Saskatchewan Environment.
Dibble, E.D. and Kovalenko, K. (2009). Ecological Impact of Grass Carp: A Review of the Available Data. Journal of Aquatic Plant Management 47: 1-15
Drake, John M. and David M. Lodge (2007), "Hull Fouling is A Risk Factor for Intercontinental Species Exchange in Aquatic Ecosystems," Aquatic Invasions, Vol. 2, No. 2, 121-131.
Dupont, D. P. (2003). CVM Embedding Effects When There Are Active, Potentially Active and Passive Users of Environmental Goods. Environmental & Resource Economics, 25(3), 319-341.
Dupont, D.P. (2001). Gender and Willingness-to-pay for Recreational Benefits from Water Quality Improvements. Unpublished Manuscript. Department of Economics, Brock University.
Dutta, N. (1984). The Value of Recreational Boating and Fishing in the Central Basin of Ohio’s Portion of Lake Erie. Technical Bulletin. The Ohio State University Sea Grant.
Environment Canada (2011, April 14). Great Lakes Areas of Concern. Retrieved April 14, 2011.
Environment Canada and United States Environmental Protection Agency. (2009). State of the Great Lakes 2009.
EnviroEconomics. (2011). Literature Review and General Analytical Framework for Benefits Relating to Marine Protected Areas. Prepared For Fisheries and Oceans Canada.
Felts, Johnson, Lalor, Williams, and Winn-Ritzenberg. (2010). Great Lakes Aquatic Invasive Species and Their Impacts on Milwaukee - A Policy Framework. Robert M. La Follette School of Public Affairs. University of Wisconsin–Madison. Prepared for the City of Milwaukee, Department of Administration, Budget and Management Division
Finnoff, D., & Lodge, D. (2008). Invasive Species in the Great Lakes: Costing Us Our Future. (PDF 154 KB) Preliminary Results. Retrieved January 15, 2011.
Freeman, A.M. III. (1979). The Benefits of Environmental Improvement: Theory and Practice. The Johns Hopkins University Press, Md., for Resources for the Future. 1979
Gan, C. & Luzar, E. J. (1993). A Conjoint Analysis of Waterfowl Hunting in Louisiana. Journal of Agricultural and Applied Economics. Vol. 25, No. 2, 36–45.
General Accounting Office. (2002). Invasive Species: Clearer Focus and Greater Commitment Needed to Effectively Manage the Problem, GAG-03-1, 1-101.
GSGislason & Associates Ltd., & Outcrop Ltd. (2003). “The Marine-Related Economy of NWT and Nunavut”. Prepared for - Manitoba: Fisheries and Oceans Canada.
Hansen, Michael J. (2010, February). The Asian carp threat to the Great Lakes. Statement of Gerald A. Barnhart to Michael J. Hansen to House Committee on Transportation and Infrastructure. Michigan: Great Lakes Fisheries Commission. Retrieved April 18, 2010, from http://www.glfc.org/fishmgmt/Hansen_testimony_aisancarp.pdf.
Hushak, L. J. (1999). Recreational Boating in Ohio: An Economic Impact Study. Technical Bulletin. The Ohio State University Sea Grant.
Hvenegaard, G.T., Butler, J.R. & Krystofiak, D.K. (1989). Economic Values of Bird Watching at Point Pelee National Park, Canada. Wildlife Society Bulletin, Vol. 17, No. 4, (2): 24-35.
IJC. (2011). 15th Biennial Report on Great Lakes Water Quality. Prepared pursuant to the Great Lakes Water Quality Agreement of 1978 for submission to the Governments of the United states and Canada and the State and Provincial Governments of the Great Lakes Basin.
IJC Study Board. 2006. Valuating Wetland Benefits compared with Economic Benefits and Losses. International Lake Ontario – St. Lawrence River Study.
Kazmierczak, R.F. (2001). Economic Linkages Between Coastal Wetlands and Habitat/Species Protection: A Review of Value Estimates Reported in the Published Literature. Natural Resource and Environment Committee. Agricultural Economics and Agribusiness Staff Paper 2001-04.
Kelly, D. W., Lamberti, G. A., and MacIsaac, H. J. (2009). The Laurentian Great Lakes as a Case Study of Biological Invasion. In Keller, R.P., Lodge, D.M., Lewis, M.A., & Shogren, J.F. (Eds.), Bioeconomics of Invasive Species: Integrating Ecology, Economics, Policy, and Management (pp. 205-225). New York: Oxford University Press.
Kerlinger, P. (Unspecified). Birding Economics and Birder Demographics Studies Conservation Tools. Funded by New Jersey Audubon Society and Cape May Bird Observatory.
Krantzberg, G., and de Boer, C. (2006). A Valuation of Ecological Services in the Great Lakes Basin Ecosystem to Sustain Healthy Communities and a Dynamic Economy. Dafasco Centre for Engineering and Public Policy. McMaster University. Prepared for the Ontario Ministry of Natural Resources. Hamilton: Ontario.
Krantzberg, G., and de Boer, C. (2008). A Valuation of Ecological Services in the Laurentian Great Lakes Basin with an Emphasis in Canada. Climate Change/Environmental Issue. Journal AWWA 100:6.
Kreutzwiser, R.D. (1981). The economic significance of the Long Point marsh, Lake Erie, as a recreational resource. Journal of Great Lakes Research 7(2), 105-110.
Lodge, D. and Finnoff, D. C. (2008). Invasive Species in the Great Lakes: Costing Us Our Future. (PDF 154 KB) Retrieved April 27, 2011.
Leahy, S. (2003). An Erie Decline: Thanks to Invasive Species. the Shallowest Great Lake Is In Big Trouble. Maclean, Vol. 116, Is. 22, June 2, p. 36.
LECG. (2004). Marine Industry Benefits Study – Economic Impact of the Canadian Marine Transportation Industry. LECG Ltd.
Leigh, P. (1998). Benefits and Costs of the Ruffe Control Program for the Great Lakes Fishery. Journal of Great Lakes Research. Volume 24, Issue 2, 351-360.
Lovell, S. J. and Stone, S.F. (2005). The Economic Impacts of Aquatic Invasive Species: A Review of the Literature. U.S. Environmental Protection Agency. National Center for Environmental Economics, Working Paper No. 05-02, 1-61.
Mandrak, N.E., & Cudmore, B. (2004). Risk Assessment for Asian Carp. Canadian Science Advisory Secretariat. Research Document: 2004/103. Burlington: Fisheries and Oceans Canada.
Meyers Norris Penny. (1999). Island Lake Pilot Project Evaluation. Prepared For Fisheries and Oceans Canada.
Millennium Ecosystem Assessment, (2005). Ecosystems and Human Well-being: Synthesis. Island Press, Washington, DC.
Marbek. (2010a). Assessing the Economic Value of Protecting the Great Lakes – Invasive Species Prevention and Mitigation. Prepared for Ontario Ministry of the Environment.
Marbek. (2010b). Assessing the Economic Value of Protecting the Great Lakes – Literature Review Report. Prepared for Ontario Ministry of the Environment.
Martin Associates. (2011). The Economic Impact of the Great Lakes – St. Lawrence Seaway System. Marine Delivers, October.
Odawa Natural Resource Department. (2009). 2008/2009, Annual Harvest Report, Little Traverse Bay Bands of Odawa Indians, Odawa Natural Resource Department.
Ontario Ministry of Natural Resources. (2010, March 05). Connected to Our Economy and Our Way of Life. Retrieved April 14, 2011.
Ontario Ministry of Natural Resources. (2011, March 19). Learn About Ontario: The Great Lakes. Retrieved April 14, 2011.
Organization for Economic Co-Operation and Development. (2006). Policy Brief. (PDF 178,7 KB)
Renzetti, S., Dupont, D. P., and Wood, C. (2011). Running Through our Fingers: How Canada fails to capture the full value of its top asset. Blue Water Initiative.
Rixon, Corinne A.M., Duggan Ian C., Bergeron, Nathalie M.N., Ricciardi, A., And Macisaac, Hugh J.. (2005). Invasion risks posed by the aquarium trade and live fish markets on the Laurentian Great Lakes. Biodiversity and Conservation Vol. 14, pp. 1365–1381.
Romanow, Bear & Associates Ltd. (2006). Profile of the Socio-Economic Importance of Inland Fisheries to Manitoba First Nations. Prepared for Indian and Northern Affairs Canada, Manitoba Region.
Rosenberger, R. S. & Loomis, J. B. (2001). Benefit Transfer of Outdoor Recreation Use Values. A Technical Document Supporting the Forest Service Strategic Plan (2000 Revision).Forest Service, Rocky Mountain Research Station. U.S. Department of Agriculture, April.
Rothlisberger, J. D., Finnoff, D. C., Cooke, R. M., and Lodge, D. (2012). Ship-borne Nonindigenous Species Diminish Great Lakes Ecosystem Services. Ecosystems 15, 462 – 476.
Schwieterman, J.P. (2010). An Analysis of the Economic Effects of Terminating Operations at the Chicago River Controlling Works and O’Brien Locks on the Chicago Area Waterway System. Retrieve April 27, 2011.
Samarawickrema, A. and Kulshreshtha, S. (2008). Value of Irrigation Water for Crop Production in the South Saskatchewan River Basin. Canadian Water Resources Journal, 33(3): 257-272.
Taylor, J.C. and Roach, J. L. (2010). “Chicago Waterway System Ecological Separation: The Logistics and Transportation Related Cost Impact of Waterway Barriers” (PDF 1,85 MB). Retrieved January 10, 2011.
Talhelm, D. R. (1988). The International Great Lakes sport fishery of 1980. Great Lakes Fisheries Commission. Special Publication 88-4. MI: Ann Arbor.
Talhelm, D. R.., & Richard C.B. (1980). Benefits and costs of sea lamprey (Petromyzon marinus) control in the Great Lakes: some preliminary results. Canadian Journal of Fisheries Aquatic Science, 37(11), 2169-2174.
Talhelm, D. R., Richard C.B., Kenneth W.C., Norman, W.S., Donald, N.S., & Archi, L. W. T. (1979). Current estimates of Great Lakes fisheries values: 1979 status report. Great Lakes Fisheries Commission. Mimeo. Report. MI: Ann Arbor.
Thomas, C. M. (2010). A Cost-Benefit Analysis of Preventative Management for Zebra and Quagga Mussels in the Colorado-Big Thompson System. Master of Science Thesis. Department of Agricultural and Resource Economics. Colorado State University. Fort Collins: Colorado.
USA. U.S. Fish and Wildlife Service. (2003). Birding in the United States: A Demographic and Economic Analysis; Addendum to the 2001National Survey of Fishing, Hunting and Wildlife-Associated Recreation. Division of Federal Aid. U.S. Fish and Wildlife Service Washington, D.C., August.
USA. Great Lakes Fisheries Commission. (2011). Asian Carp-Control Strategy Framework, 2011. Michigan: Great Lakes Fisheries Commission, December.
USA. Great Lakes Fisheries Commission. (2010a). Asian Carp-Control Strategy Framework, 2010. Michigan: Great Lakes Fisheries Commission, May.
USA. Great Lakes Fisheries Commission. (2010b). Stopping the Spread of Asian Carp: An Action Agenda for Congress. Legislative Priority Fact Sheet. Michigan: Great Lakes Fisheries Commission, February.
USA. Great Lakes Fisheries Commission. (2010c). Great Lakes Annual Water Use Report 2008. Issue No. 17, December.
U.S.Office of Technology Assessment. (1993). Harmful Non-Indigenous Species in the United States. OTA-F-565.
U.S.Geological Survey. (2009). GLSC Fact Sheet 2009-1. Great Lakes Science Center. U.S. Department of the Interior: MI
Walsh, R. G., Loomis, J.B. & Gillman, R.A. (1984). Valuing Option, Existence, and Bequest Demands for Wilderness. Land Economics, Volume 60, No. 1, 14-29.
Wilson, S. J. (2008). Lake Simcoe Basin’s Natural Capital: The Value of the Watershed’s Ecosystem Services. David Suzuki Foundation. Friends of the Greenbelt Foundation Occasional Paper Series, June.
Woodward, R.T. and Wui, Y-S. (2001). The economic value of wetland services: a meta-analysis. Ecological Economics, Volume 37, 257–270
Yap, D., Reid, N., de Brou, G., and Bloxam, R. (2005). Trans-boundary Air Pollution in Ontario (PDF 6,45 MB). Ontario Ministry of Environment.
Zhang, C., & Boyle, K.J. (2010). The effect of an aquatic invasive species (Eurasian watermilfoil) on lakefront property values. Ecological Economics, Volume 70, Issue 2, 394-404.
Matrix 1: Total Economic Valuation Flowchart
Description
Matrix 1 is titled “Total Economic Valuation Flowchart”. The first element is “Total Economic Value,” which is directly divided into “Use Value” and “Non-Use Value.” Under Use Value fall “Current Use” and “Future Use.” From Current Use flow “Direct Use” and “Indirect Use”. Under “Direct Use” is Ecosystem Services, which are broken down into “Extractive Use” and “Non-Extractive Use”. Under “Indirect Use” is also Ecosystem Services. From Future Use flow “Option Value” and “Research Value.” Under Non-Use Value fall “Existence Value” and “Bequest Value.”
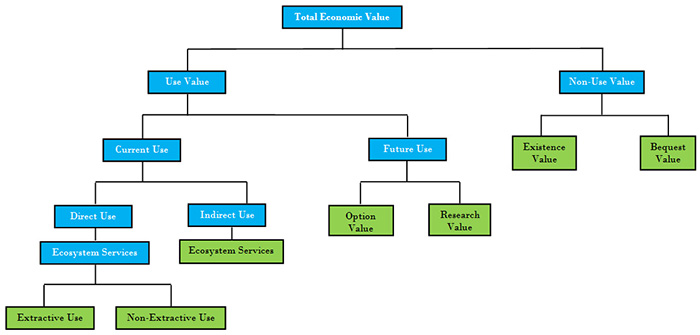
Definitions
Use Value: The value people derive from using a good.
Current Use Value:
Direct use: Directly consumable goods and services through ecosystem services.
Ecosystem services: Include provisioning services such as food, water (Millennium Ecosystem Services Assessment, 2005).
Extractives use: Extractive uses result in water level and/or commodities provided by the Great Lakes (e.g. commercial fishing).
Non-extractives use: Non-extractives uses do not cause water level and/or commodities provided by the Great Lakes (e.g. wildlife watching).
Indirect use: Indirectly consumable goods and services through ecosystem services.
Ecosystem services: Include provisioning services such as include regulating services (e.g. climate, floods, disease, water quality) and supporting services (e.g. soil formation, nutrient cycling) (Millennium Ecosystem Services Assessment, 2005).
Future Use Value:
Option value: The amount someone is willing to pay to keep open the option of future use of the resources (e.g. possibility of commercial/recreational fishing in the future). Footnote 117
Research Value: Scientific research potential that may result in new discoveries/knowledge and/or new developments that have broader application in future. Some of the potential beneficial effects include new understanding of the biology and ecology of the area, new understanding of inter-specific interactions and competition, new chemicals/medicines with broader applicability.
Non-Use Value: The value people derive from a good/resource independent of any use people might make of that good/resource.
Bequest value: Conservation for future generations (e.g. future biodiversity). Bequest value takes into account people’s WTP for future total use by their children and future generations.
Existence value: Existence value arises because people intrinsically value the existence of the Great Lakes regardless of its use. Existence value includes the benefits from knowing that the Great Lakes are being used by others as well as cultural values for an economy.Footnote 118
Matrix 2: The Great Lakes - Total Economic Valuation Flowchart
Description
Matrix 2 is titled “The Great Lakes - Total Economic Valuation Flowchart”. The first element is “Total Economic Value of the Great Lakes: $13,800 Mil. +++”. All other elements point upwards toward it. The total economic value is broken down into “Use Value: $13,800 Mil. +++” and “Non-Use Value: Not Quantified.” Use value is divided into “Current Use: $13,800 Mil. +” and “Future Use: Not Quantified”. Future use is divided into “Option” and “Research Value”, both of which have a “Not Quantified” upward contributing element. Current use has two upward contributing elements: “Direct use: $13,800 Mil.” and “Indirect Use: Not Quantified.” Indirect Use has one upward contributing element: Ecosystem Services: Not Quantified. Direct use has two upward contributing elements,: “Extractive Use: $1,822 Mil.” and “Non-Extractive Use: $11,970 Mil.” Extractive use is broken down as follows: Drinking Water: $532 Mil.; Agricultural Water: $165 Mil.; Industrial Water: $96 Mil.; Commercial Fishing: $227 Mil.; Recreational Fishing; $568 Mil.; Hunting: $106 Mil; and Oil and Gas: $137 Mil. Non-extractive use is broken down as follows: Rec. Boating: $7,291 Mil.; Beach Use: $248 Mil.; Wildlife Viewing: $218 Mil.; Com. Navigation: $4,214 Mil.; Aquaculture; Not Quantified; Heating and Cooling; Not Quantified; Hydropower Production: Not Quantified; and Other Recreational Benefits: Not Quantified. Non-use value is broken down into “Existence Value” and “Bequest Value” both of which have a “Not Quantified” upward contributing element.

Matrix 3: Summary of Empirical Studies Used for Valuation of Economic Activities in the Great Lakes basin
Description
Matrix 3 is titled “Summary of Empirical Studies Used for Valuation of Economic Activities in the Great Lakes basin.” It is presented in a table with five columns. The columns are captioned from left to right as follows: “Name of the Author”; “Time Period and Area Covered”; “Method of Analysis”; “Conclusion/Information Used”; and “Limitations noted and/or Adjustment Made for the current Study.” The table has 12 main rows, which have one to two sub-rows each. Main row 1 is “Raw water use”, under which there are two sub-rows. Sub-row 1.1 Name of the author: The Great Lakes Commission (2010); Time period and area covered: 2008 the US by State and Canada by Province and Lake; Method of analysis: Water use database; Conclusion/information used: Ontario’s annual water consumption was 180 million m3. In Quebec, total consumptive use was 161.7 million m3.; Limitations noted and/or adjustment made for the current study: 2000 data was used for Ontario and 1993 data was used for Quebec due to data unavailability and assumed that water use estimates for 2006 are not anticipated to be greatly different than those reported assuming a similar data collection and assessment approach. Sub-row 1.2 Name of the author: Statistics Canada (2009) cited in Marbek (2010); Time period and area covered: 2007 - Great Lakes basin; Method of analysis: Survey; Conclusion/information used: Ontario - The operating and maintenance costs of treating 180.5 million cubic metres of raw intake water from the Great Lakes basin was approximately $260 million.; Limitations noted and/or adjustment made for the current study: Underestimation of economic valuation as it excludes consumer surplus. Adjustment has been made for inflation. Main row 2 is “Industrial Water”, under which there are two sub-rows. Sub-row 2.1 Name of the author: The Great Lakes Commission (2010); Time period and area covered: 2008 the US by State and Canada by Province and Lake; Method of analysis: Water use database; Conclusion/information used: Ontario’s industrial users consumed 80.4 million m3 of water from the Great Lakes each year. In Quebec, total consumptive use was 17.3 million m3.; Limitations noted and/or adjustment made for the current study: See notes for The Great Lakes Commission (2010). Sub-row 2.2 Name of the author: Dachraoui and Harchaoui (2004); Time period and area covered: 1981-1996 – Canadian business sector industries; Method of analysis: Seemingly unrelated regression techniques on data from EKLEMS database maintained by Statistics Canada; Conclusion/information used: The shadow price of water intake - $0.73/m3. The introduction of water recirculation reduces the shadow price estimate to $0.55 cubic metre.; Limitations noted and/or adjustment made for the current study: Adjustment has been made for inflation. Main row 3 is “Agricultural water use,” under which there are two sub-rows. Sub-row 3.1 is Name of the author: The Great Lakes Commission (2010)); Time period and area covered: 2008 the US by State and Canada by jurisdiction; Method of Analysis: Water use database; Conclusion/information used: Ontario’s annual water consumption was 120 million m3. In Quebec, total consumptive use was 33 million m3.; Limitations noted and/or adjustment made for the current study: See notes for The Great Lakes Commission (2010). Sub-row 3.2 is Name of the author: To (2006) cited in Marbek (2010); Time period and area covered: 2000-2004; Method of analysis: Average market crop price; Conclusion/information esed: The loss in profitability in the short-term due to a decrease in water, assuming fixed costs, ranged from $3.79/m3 for ginseng, to 0.22/m3 for sweet corn.; Limitations noted and/or adjustment made for the current study: Stated many challenges with this simple method of calculating the value of water and various data gaps and therefore, should be seen as a first approximation. Main row 4 is “Commercial Fishing,” under which there is one sub-row. Sub-row 4.1 is Name of the author: Ontario Ministry of Natural Resources website (2010); Time period and area covered: 2008 – Great Lakes Basin; Method of analysis: No information; Conclusion/information esed: Value of commercial fishing after processing was in 2008 was in the range of $180 - $215 million.; Limitations noted and/or adjustment made for the current study: Underestimation of economic valuation as it excludes consumer surplus. Main row 5 is “Recreational Fishing,” under which there is one sub-row. Sub-row 5.1 is Name of the author: DFO (2008); Time period and area covered: 2005 – Great Lakes Basin; Method of analysis: Recreational Fishing Survey on 16,000 households within Canada and in other countries; Conclusion/information used: The total direct expenditures and major purchases/investment of $443.0 million in recreational fishing in the Great Lakes based on travel costs and expenditures for fishing trips.; Limitations noted and/or adjustment made for the current study: Adjustment has been made by scaling down as well as adjusting for inflation. Main row 6 is “Recreational Hunting,” under which there is one sub-row. Sub-row 6.1 is Name of the author: EC (2000); Time period and area covered: 1996 – Canada by jurisdiction; Method of analysis: Survey among a sample of approximately 87,000 Canadians; Conclusion/information used: Residents of Ontario spent $200.6 million and residents of Quebec spent $285.6 million; Limitations noted and/or adjustment made for the current study: As no specific estimate was provided for the Great Lakes basin, adjustment has been made by scaling down as well as adjusting for inflation. Main row 7 is “Recreational Boating,” under which there is one sub-row. Sub-row 7.1 is Name of the author: Genesis Public Opinion Research Inc. (2007)); Time period and area covered: 2006 – Canada by jurisdiction; Method of analysis: Online surveys and publicly available data from Industry Canada; Conclusion/information used: The total expenditures (direct and indirect) in Ontario was $7.3 billion.; Limitations noted and/or adjustment made for the current study: As no specific estimate was provided for the Great Lakes basin, adjustment has been made by scaling down as well as adjusting for inflation. Main row 8 is “Beaches and Lakefront Use,” under which there is one sub-row. Sub-row 8.1 is Name of the author: Krantzberg and de Boer (2006); Time period and area covered: 2004 – Canadian portion of the Great Lakes; Method of Analysis: Derived by proportionally scaling the value derived by Shaikh (2004) for the US; Conclusion/information used: The estimated Willingness to Pay value for Canadian Great Lakes beachgoers was in the range of $200 - $250 million; Limitations noted and/or adjustment made for the current study: Adjustment has been made for inflation. Main row 9 is “Wildlife Viewing,” under which there is one sub-row. Sub-row 9.1 is Name of the author: EC (2000); Time period and area covered: 1996 – Canada by jurisdiction; Method of analysis: Survey among a sample of approximately 87,000 Canadians; Conclusion/information used: Ontario residents spent $410.9 million and Quebec residents spent $281.0 million.; Limitations noted and/or adjustment made for the current study: As no specific estimate was provided for the Great Lakes basin, adjustment has been made by scaling down as well as adjusting for inflation. Main row 10 is “Commercial Navigation,” under which there is one sub-row. Sub-row 10.1 is Name of the author: The Canadian Shipowners Association website (2011); Time period and area covered: The Great Lakes, St. Lawrence Waterway; Method of analysis: No information; Conclusion/information used: The estimated annual economic contribution of $4 billion (direct and indirect impact) from cargo handling, vessel services, and inland transportation services on this integrated waterway system in Canada.; Limitations noted and/or adjustment made for the current study: No information. Main row 11 is “Oil and Gas,” under which there is one sub-row. Sub-row 11.1 is Name of the author: Ontario Ministry of Natural Resources website (2012); Time period and area covered: 2009 – the Great Lakes; Method of analysis: No information; Conclusion/information used: 88,000 cubic meters of crude oil with a wellhead value of $50 million and 240 million cubic meters of natural gas with retail value of $80 million was produced; Limitations noted and/or adjustment made for the current study: Adjustment has been made by scaling down as well as adjusting for inflation. Main row 12 is “General – Consumer Surplus,” under which there is one sub-row. Sub-row 12.1 is Name of the author: EC (2000); Time period and area covered: 1996 – Canada by jurisdiction; Method of analysis: Survey among a sample of approximately 87,000 Canadians; Conclusion/Information Used: No information; Limitations noted and/or adjustment made for the current study: As no specific estimate was provided for the Great Lakes basin, adjustment has been made by scaling down as well as adjusting for inflation.
| Name of the Author | Time Period and Area Covered | Method of Analysis | Conclusion/Information Used | Limitations noted and/or Adjustment Made for the current Study |
|---|---|---|---|---|
| Raw water use | ||||
| The Great Lakes Commission (2010) | 2008 the US by State and Canada by Province and Lake | Water use database | Ontario’s annual water consumption was 180 million m3. In Quebec, total consumptive use was 161.7 million m3. | 2000 data was used for Ontario and 1993 data was used for Quebec due to data unavailability and assumed that water use estimates for 2006 are not anticipated to be greatly different than those reported assuming a similar data collection and assessment approach. |
| Statistics Canada (2009) cited in Marbek (2010) | 2007 - Great Lakes basin | Survey | Ontario - The operating and maintenance costs of treating 180.5 million cubic metres of raw intake water from the Great Lakes basin was approximately $260 million. | Underestimation of economic valuation as it excludes consumer surplus. Adjustment has been made for inflation. |
| Industrial Water | ||||
| The Great Lakes Commission (2010) | 2008 the US by State and Canada by Province | Water use database | Ontario’s industrial users consumed 80.4 million m3 of water from the Great Lakes each year. In Quebec, total consumptive use was 17.3 million m3. | See notes for The Great Lakes Commission (2010) |
| Dachraoui and Harchaoui (2004) | 1981-1996 – Canadian business sector industries | Seemingly unrelated regression techniques on data from EKLEMS database maintained by Statistics Canada | The shadow price of water intake - $0.73/m3. The introduction of water recirculation reduces the shadow price estimate to $0.55 cubic metre. | Adjustment has been made for inflation. |
| Agricultural water use | ||||
| The Great Lakes Commission (2010) | 2008 the US by State and Canada by jurisdiction | Water use database | Ontario’s annual water consumption was 120 million m3. In Quebec, total consumptive use was 33 million m3. | See notes for The Great Lakes Commission (2010) |
| To (2006) cited in Marbek (2010) | 2000-2004 | Average market crop price | The loss in profitability in the short-term due to a decrease in water, assuming fixed costs, ranged from $3.79/m3 for ginseng, to 0.22/m3 for sweet corn. | Stated many challenges with this simple method of calculating the value of water and various data gaps and therefore, should be seen as a first approximation. |
| Commercial Fishing | ||||
| Ontario Ministry of Natural Resources website (2010) | 2008 - Great Lakes Basin | Value of commercial fishing after processing was in 2008 was in the range of $180 - $215 million. | Underestimation of economic valuation as it excludes consumer surplus. | |
| Recreational Fishing | ||||
| DFO (2008) | 2005 – Great Lakes Basin | Recreational Fishing Survey on 16,000 households within
Canada and in other countries |
The total direct expenditures and major purchases/investment of $443.0 million in recreational fishing in the Great Lakes based on travel costs and expenditures for fishing trips. | Adjustment has been made by scaling down as well as adjusting for inflation. |
| Recreational Hunting | ||||
| EC (2000) | 1996 – Canada by jurisdiction | Survey among a sample of approximately 87,000 Canadians | Residents of Ontario spent $200.6 million and residents of Quebec spent $285.6 million | As no specific estimate was provided for the Great Lakes basin, adjustment has been made by scaling down as well as adjusting for inflation. |
| Recreational Boating | ||||
| Genesis Public Opinion Research Inc. (2007) | 2006 – Canada by jurisdiction | Online surveys and publicly available data from Industry Canada | The total expenditures (direct and indirect) in Ontario was $7.3 billion. | As no specific estimate was provided for the Great Lakes basin, adjustment has been made by scaling down as well as adjusting for inflation. |
| Beaches and Lakefront Use | ||||
| Krantzberg and de Boer (2006) | 2004 – Canadian portion of the Great Lakes | Derived by proportionally scaling the value derived by Shaikh (2004) for the US | The estimated Willingness to Pay value for Canadian Great Lakes beachgoers was in the range of $200 - $250 million | Adjustment has been made for inflation. |
| Wildlife Viewing | ||||
| EC (2000) | 1996 – Canada by jurisdiction | Survey among a sample of approximately 87,000 Canadians | Ontario residents spent $410.9 million and Quebec residents spent $281.0 million | As no specific estimate was provided for the Great Lakes basin, adjustment has been made by scaling down as well as adjusting for inflation. |
| Commercial Navigation | ||||
| The Canadian Shipowners Association website (2011) | The Great Lakes, St. Lawrence Waterway | The estimated annual economic contribution of $4 billion (direct and indirect impact) from cargo handling, vessel services, and inland transportation services on this integrated waterway system in Canada. | ||
| Oil and Gas | ||||
| Ontario Ministry of Natural Resources website (2012) | 2009 – the Great Lakes | 88,000 cubic meters of crude oil with a wellhead value of $50 million and 240 million cubic meters of natural gas with retail value of $80 million was produced. | Adjustment has been made by scaling down as well as adjusting for inflation. | |
| General – Consumer Surplus | ||||
| EC (2000) | 1996 – Canada by jurisdiction | Survey among a sample of approximately 87,000 Canadians | As no specific estimate was provided for the Great Lakes basin, adjustment has been made by scaling down as well as adjusting for inflation. | |
Annex 1: Selected Socio-Economic Indicators for Ontario
Description
Annex 1 is a table titled “Selected Socio-Economic Indicators for Ontario” and is sourced from “Statistics Canada. 2007. 2006 Community Profiles. 2006 Census.” The table has three columns captioned from left to right “Characteristics,” “Ontario” and “Canada.” The table has 32 rows, with 10 main rows and 22 sub-rows. Main row 1 is Total Population with values of 12,160,285 for Ontario and 31,612,895 for Canada. Sub-row 1.1 under Total Population is Male with values of 5,877,875 for Ontario and 15,326,265 for Canada. Sub-row 1.2 under Total Population is Female with values of 6,151,020 for Ontario and 15,914,765 for Canada. Main row 2 is “Population density per square kilometre” with values of 13.40 for Ontario and 3.51 for Canada. Main row 3 is “Land area (square km)” with values of 907,574 for Ontario and 9,017,699 for Canada. Main row 4 is “Median age of the population” with values 39 for Ontario and 40 for Canada. Main row 5 is “% of the population aged 15 and over” with a value of 82 for both Ontario and Canada. Main row 6 is “Aboriginal identity population” with values of 242,490 for Ontario and 1,172,785 for Canada. Sub-row 6.1 under Aboriginal identity population is Male with values of 117,585 for Ontario and 572,095 for Canada. Sub-row 6.2 under Aboriginal identity population is Female with values of 124,900 for Ontario and 600,695 for Canada. Main row 7 is “Total population 15 years and over” with values of 9,819,420 for Ontario and 25,664,220 for Canada. Sub-row 7.1 under Total population 15 years and over is No certificate; diploma or degree with values of 2,183,625 for Ontario and for 6,098,325 Canada. Sub-row 7.2 under Total population 15 years and over is High school certificate or equivalent with values of 2,628,575 for Ontario and 6,553,425 for Canada. Sub-row 7.3 under Total population 15 years and over is University certificate or diploma below the bachelor level with values of 405,270 for Ontario and 1,136,145 for Canada. Sub-row 7.4 under Total population 15 years and over is University certificate; diploma or degree with values of 2,012,060 for Ontario and 4,655,770 for Canada. Main row 8 is “In the labour force” with values of 6,587,580 for Ontario and 17,146,135 for Canada. Sub-row 8.1 under In the labour force is Employed with values of 6,164,245 for Ontario and 16,021,180 for Canada. Sub-row 8.2 under In the labour force is Unemployed with values of 423,335 for Ontario and 1,124,955 for Canada. Sub-row 8.3 under In the labour force is Employment rate with values of 94% for Ontario and 93% for Canada. Sub-row 8.4 under In the labour force is Unemployment rate with values of 6% for Ontario and 7% for Canada. Main row 9 is “Total experienced labour force 15 years and over” with values of 6,473,730 for Ontario and 16,861,180 for Canada. Sub-row 9.1 under Total experienced labour force 15 years and over is Agriculture and other resource-based industries with values of 190,000 for Ontario and 895,415 for Canada. Sub-row 9.2 under Total experienced labour force 15 years and over is Construction with values of 384,775 for Ontario and 1,069,095 for Canada. Sub-row 9.3 under Total experienced labour force 15 years and over is Manufacturing with values of 899,670 for Ontario and 2,005,980 for Canada. Sub-row 9.4 under Total experienced labour force 15 years and over is Retail trade with values of 720,235 for Ontario and 1,917,170 for Canada. Sub-row 9.5 under Total experienced labour force 15 years and over is Finance and real estate with values of 442,610 for Ontario and 992,720 for Canada. Sub-row 9.6 under Total experienced labour force 15 years and over is Business services with values of 1,274,345 for Ontario and 3,103,195 for Canada. Sub-row 9.7 under Total experienced labour force 15 years and over is Other services with values of 1,209,390 for Ontario and 3,271,505 for Canada. Main row 10 is Persons 15 years and over with earnings (counts) with values of 6,991,670 for Ontario and 18,201,265 for Canada. Sub-row 10.1 under Persons 15 years and over with earnings (counts) is Median earnings - Persons 15 years and over ($) with values of 29,335 for Ontario and 26,850 for Canada. Sub-row 10.2 under Persons 15 years and over with earnings (counts) is Median earnings - Persons 15 years and over who worked full year; full time ($) with values of $44,748 for Ontario and $41,401 for Canada.
| Characteristics | Ontario | Canada |
|---|---|---|
| Total population | 12,160,285 | 31,612,895 |
| Male | 5,877,875 | 15,326,265 |
| Female | 6,151,020 | 15,914,765 |
| Population density per square kilometre | 13.40 | 3.51 |
| Land area (square km) | 907,574 | 9,017,699 |
| Median age of the population | 39 | 40 |
| % of the population aged 15 and over | 82 | 82 |
| Aboriginal identity population | 242,490 | 1,172,785 |
| Male | 117,585 | 572,095 |
| Female | 124,900 | 600,695 |
| Total population 15 years and over | 9,819,420 | 25,664,220 |
| No certificate; diploma or degree | 2,183,625 | 6,098,325 |
| High school certificate or equivalent | 2,628,575 | 6,553,425 |
| University certificate or diploma below the bachelor level | 405,270 | 1,136,145 |
| University certificate; diploma or degree | 2,012,060 | 4,655,770 |
| In the labour force | 6,587,580 | 17,146,135 |
| Employed | 6,164,245 | 16,021,180 |
| Unemployed | 423,335 | 1,124,955 |
| Employment rate | 94% | 93% |
| Unemployment rate | 6% | 7% |
| Total experienced labour force 15 years and over | 6,473,730 | 16,861,180 |
| Agriculture and other resource-based industries | 190,000 | 895,415 |
| Construction | 384,775 | 1,069,095 |
| Manufacturing | 899,670 | 2,005,980 |
| Retail trade | 720,235 | 1,917,170 |
| Finance and real estate | 442,610 | 992,720 |
| Business services | 1,274,345 | 3,103,195 |
| Other services | 1,209,390 | 3,271,505 |
| Persons 15 years and over with earnings (counts) | 6,991,670 | 18,201,265 |
| Median earnings - Persons 15 years and over ($) | 29,335 | 26,850 |
| Median earnings - Persons 15 years and over who worked full year; full time ($) | $44,748 | $41,401 |
| Source: Statistics Canada. 2007. 2006 Community Profiles. 2006 Census. | ||
Annex 2: Aboriginal identity population by Sexes, Age Groups, Median Age for Ontario and Canada
Description
Annex 2 is a table titled “Aboriginal identity population by Sexes, Age Groups, Median Age for Ontario and Canada” and is sourced from Statistics Canada; Censuses of Population; 2006. The table has seven columns. The first is captioned “Provinces/Territories”; the second “Total population”; the third “Aboriginal Population” with the note that the total Aboriginal identity population includes the Aboriginal groups (North American Indian, Métis and Inuit); the fourth “North American Indian”; the fifth “ Métis”; the sixth “Inuit”; and the seventh “Non-aboriginal identity population.” The table has 5 main rows with two sub-rows each. Row 1 is Population by Ethnicity with sub-rows Ontario and Canada. The Ontario values are total population 12,028,895; Aboriginal population 242,495; North American Indian 158,395; Métis 73,605; Inuit 2,035; and Non-aboriginal identity population 11,786,405. The Canada values are total population 31,241,030; Aboriginal population 1,172,785; North American Indian 698,025; Métis 389,780; Inuit 50,480; and Non-aboriginal identity population 30,068,240. Row 2 is Male by Ethnicity with sub-rows Ontario and Canada. The Ontario values are total population 5,877,875; Aboriginal population 117,585; North American Indian 75,955; Métis 37,025; Inuit 940; and Non-aboriginal identity population 5,760,285. The Canada values are total population 15,326,270; Aboriginal population 572,095; North American Indian 338,050; Métis 193,500; Inuit 25,025; and Non-aboriginal identity population 14,754,175. Row 3 is Female by Ethnicity with sub-rows Ontario and Canada. The Ontario values are total population 6,151,020; Aboriginal population 124,900; North American Indian 82,440; Métis 36,580; Inuit 1,095; and Non-aboriginal identity population 6,026,115. The Canada values are total population 15,914,760; Aboriginal population 600,695; North American Indian 359,975; Métis 196,285; Inuit 25,460; and Non-aboriginal identity population 15,314,065. Row 4 is Median Age by Ethnicity with sub-rows Ontario and Canada. The Ontario values are total population 38.7; Aboriginal population 29.7; North American Indian 27.9; Métis 32.8; Inuit 21.2; and Non-aboriginal identity population 38.9. The Canada values are total population 39.2; Aboriginal population 26.5; North American Indian 24.9; Métis 29.5; Inuit 21.5; and Non-aboriginal identity population 39.7. Row 5 is Total population 15 years and over with sub-rows Ontario and Canada. The Ontario values are total population 9,819,420; Aboriginal population 178,170; North American Indian 111,925; Métis 58,180; Inuit 1,345; and Non-aboriginal identity population 9,641,255. The Canada values are total population 25,664,225; Aboriginal population 823,885; North American Indian 473,235; Métis 291,330; Inuit 32,775; and Non-aboriginal identity population 24,840,335.
| Provinces/Territories | Total population | Aboriginal Population* | North American Indian | Métis | Inuit | Non-aboriginal identity population |
|---|---|---|---|---|---|---|
| Population by Ethnicity | ||||||
| Ontario | 12,028,895 | 242,495 | 158,395 | 73,605 | 2,035 | 11,786,405 |
| Canada | 31,241,030 | 1,172,785 | 698,025 | 389,780 | 50,480 | 30,068,240 |
| Male by Ethnicity | ||||||
| Ontario | 5,877,875 | 117,585 | 75,955 | 37,025 | 940 | 5,760,285 |
| Canada | 15,326,270 | 572,095 | 338,050 | 193,500 | 25,025 | 14,754,175 |
| Female Age by Ethnicity | ||||||
| Ontario | 6,151,020 | 124,900 | 82,440 | 36,580 | 1,095 | 6,026,115 |
| Canada | 15,914,760 | 600,695 | 359,975 | 196,285 | 25,460 | 15,314,065 |
| Median Age by Ethnicity | ||||||
| Ontario | 38.7 | 29.7 | 27.9 | 32.8 | 21.2 | 38.9 |
| Canada | 39.2 | 26.5 | 24.9 | 29.5 | 21.5 | 39.7 |
| Total population 15 years and over | ||||||
| Ontario | 9,819,420 | 178,170 | 111,925 | 58,180 | 1,345 | 9,641,255 |
| Canada | 25,664,225 | 823,885 | 473,235 | 291,330 | 32,775 | 24,840,335 |
Sources: Statistics Canada; Censuses of Population; 2006.
Note: * The total Aboriginal identity population includes the Aboriginal groups (North American Indian, Métis and Inuit).
Annex 3: Estimated Water Consumption and Values by Sector, Lake and Province for the Year 2008
Description
Annex 3 is a table titled “Estimated Water Consumption and Values by Sector, Lake and Province for the Year 2008” and is sourced from the Great Lakes Commission (2011). The table has five columns. The first is captioned “Name of the Lake”; the second is “Raw Water Use” with the sub-columns “Public Sector”, “Self-Supply Domestic” and “Total”; the third is “Agricultural Sector” with the sub-columns “Livestock”, “Irrigation” and “Total”; the fourth is “Industry” and the fifth is “Total.” The table has four main rows: the first is captioned “Quantity (Mil. M3/Year)”; the second “Grand Total”; the third “Value (Mil.); and the fourth “Grand Total.” Under the Quantity and Value rows are sub-rows for Ontario and Quebec and their respective lakes. Row 1 is the Quantity (Mil. M3/Year) main row. Row 2 is the Quantity (Mil. M3/Year) values for Ontario as follows: raw water use: public sector 158.1, self-supply domestic 22.4 and total 180.5; agricultural sector: livestock 40.7, irrigation 78.9 and total 119.6; industry 80.36; and total 380.45. Row 3 is the Quantity (Mil. M3/Year) values for the St. Lawrence under Ontario as follows: raw water use: public sector 15.1, self-supply domestic 2.4 and total 17.5; agricultural sector: livestock 6.5, irrigation 2.5 and total 9.1; industry 14.00; and total 40.58. Row 4 is the Quantity (Mil. M3/Year) values for Lake Ontario under Ontario as follows: raw water use: public sector 96.6, self-supply domestic 13.3 and total 109.9; agricultural sector: livestock 6.0, irrigation 19.1 and total 25.1; industry 19.99; and total 154.94. Row 5 is the Quantity (Mil. M3/Year) values for Lake Eerie under Ontario as follows: raw water use: public sector 19.5, self-supply domestic 4.1 and total 23.6; agricultural sector: livestock 14.6, irrigation 34.3 and total 48.9; industry 15.71; and total 88.23. Row 6 is the Quantity (Mil. M3/Year) values for Lake Huron under Ontario as follows: raw water use: public sector 17.5, self-supply domestic 2.2 and total 19.7; agricultural sector: livestock 13.4, irrigation 22.5 and total 36.0; industry 16.55; and total 72.18. Row 7 is the Quantity (Mil. M3/Year) values for Lake Superior under Ontario as follows: raw water use: public sector 9.5, self-supply domestic 0.4 and total 9.9; agricultural sector: livestock 0.2, irrigation 0.4 and total 0.6; industry 14.11; and total 24.51. Row 8 is the Quantity (Mil. M3/Year) values for Quebec as follows: raw water use: public sector 151.8, self-supply domestic 9.9 and total 161.7; agricultural sector: livestock 21.1, irrigation 11.5 and total 32.6; industry 17.34; and total 211.62. Row 9 is the Quantity (Mil. M3/Year) values for the St. Lawrence under Quebec as follows: raw water use: public sector 151.8, self-supply domestic 9.9 and total 161.7; agricultural sector: livestock 21.1, irrigation 11.5 and total 32.6; industry 17.34; and total 211.62. Row 10 is the Quantity (Mil. M3/Year) grand total values as follows: raw water use: public sector 310.0, self-supply domestic 32.2 and total 342.2; agricultural sector: livestock 61.8, irrigation 90.4 and total 152.2; industry 97.70; and total 592.06. Row 11 is the Value (Mil.) main row. Row 12 is the Value (Mil.) values for Ontario as follows: raw water use: public sector $245.7, self-supply domestic $34.8 and total $280.4; agricultural sector: livestock $44.9, irrigation $87.0 and total $131.9; industry $79.3; and total $491.6. Row 13 is the Value (Mil.) values for the St. Lawrence under Ontario as follows: raw water use: public sector $23.5, self-supply domestic $3.7 and total $27.2; agricultural sector: livestock $7.2, irrigation $2.8 and total $10.0; industry $13.8; and total $51.0. Row 14 is the Value (Mil.) values for Lake Ontario under Ontario as follows: raw water use: public sector $150.0, self-supply domestic $20.7 and total $170.7; agricultural sector: livestock $6.6, irrigation $21.1 and total $27.7; industry $19.7; and total $218.1. Row 15 is the Value (Mil.) values for Lake Eerie under Ontario as follows: raw water use: public sector $30.2, self-supply domestic $6.4 and total $36.6; agricultural sector: livestock $16.1, irrigation $37.9 and total $54.0; industry $15.5; and total $106.1. Row 16 is the Value (Mil.) values for Lake Huron under Ontario as follows: raw water use: public sector $27.2, self-supply domestic $3.4 and total $30.6; agricultural sector: livestock $14.8, irrigation $24.9 and total $39.7; industry $16.3; and total $86.6. Row 17 is the Value (Mil.) values for Lake Superior under Ontario as follows: raw water use: public sector $14.7, self-supply domestic $0.6 and total $15.3; agricultural sector: livestock $0.2, irrigation $0.4 and total $0.6; industry $13.9; and total $29.8. Row 18 is the Value (Mil.) values for Quebec as follows: raw water use: public sector $235.9, self-supply domestic $15.3 and total $251.2; agricultural sector: livestock $21.3, irrigation $11.5 and total $32.8; industry $17.1; and total $301.1. Row 19 is the Value (Mil.) values for the St. Lawrence under Quebec as follows: raw water use: public sector $235.9, self-supply domestic $15.3 and total $251.2; agricultural sector: livestock $21.3, irrigation $11.5 and total $32.8; industry $17.1; and total $301.1. Row 18 is the Value (Mil.) grand total values as follows: raw water use: public sector $481.6, self-supply domestic $50.1 and total $531.7; agricultural sector: livestock $66.1, irrigation $98.6 and total $164.7; industry $96.4; and total $792.8.
| Name of the Lake | Raw Water Use | Agricultural Sector | Industry | Total | ||||
|---|---|---|---|---|---|---|---|---|
| Public Sector | Self-Supply Domestic | Total | Livestock | Irrigation | Total | |||
| Quantity (Mil. m3/Year) | ||||||||
| Ontario | 158.1 | 22.4 | 180.5 | 40.7 | 78.9 | 119.6 | 80.36 | 380.45 |
| St. Lawrence | 15.1 | 2.4 | 17.5 | 6.5 | 2.5 | 9.1 | 14.00 | 40.58 |
| Lake Ontario | 96.6 | 13.3 | 109.9 | 6.0 | 19.1 | 25.1 | 19.99 | 154.94 |
| Lake Erie | 19.5 | 4.1 | 23.6 | 14.6 | 34.3 | 48.9 | 15.71 | 88.23 |
| Lake Huron | 17.5 | 2.2 | 19.7 | 13.4 | 22.5 | 36.0 | 16.55 | 72.18 |
| Lake Superior | 9.5 | 0.4 | 9.9 | 0.2 | 0.4 | 0.6 | 14.11 | 24.51 |
| Quebec | 151.8 | 9.9 | 161.7 | 21.1 | 11.5 | 32.6 | 17.34 | 211.62 |
| St. Lawrence | 151.8 | 9.9 | 161.7 | 21.1 | 11.5 | 32.6 | 17.34 | 211.62 |
| Grand Total | 310.0 | 32.2 | 342.2 | 61.8 | 90.4 | 152.2 | 97.70 | 592.06 |
| Value (Mil.) | ||||||||
| Ontario | $245.7 | $34.8 | $280.4 | $44.9 | $87.0 | $131.9 | $79.3 | $491.6 |
| St. Lawrence | $23.5 | $3.7 | $27.2 | $7.2 | $2.8 | $10.0 | $13.8 | $51.0 |
| Lake Ontario | $150.0 | $20.7 | $170.7 | $6.6 | $21.1 | $27.7 | $19.7 | $218.1 |
| Lake Erie | $30.2 | $6.4 | $36.6 | $16.1 | $37.9 | $54.0 | $15.5 | $106.1 |
| Lake Huron | $27.2 | $3.4 | $30.6 | $14.8 | $24.9 | $39.7 | $16.3 | $86.6 |
| Lake Superior | $14.7 | $0.6 | $15.3 | $0.2 | $0.4 | $0.6 | $13.9 | $29.8 |
| Quebec | $235.9 | $15.3 | $251.2 | $21.3 | $11.5 | $32.8 | $17.1 | $301.1 |
| St. Lawrence | $235.9 | $15.3 | $251.2 | $21.3 | $11.5 | $32.8 | $17.1 | $301.1 |
| Grand Total | $481.6 | $50.1 | $531.7 | $66.1 | $98.6 | $164.7 | $96.4 | $792.8 |
Source: Great Lakes Commission (2011)
Annex 4: Landings and Landed Values of Commercial fisheries in the Great Lakes by Species and Lake in 2011
Description
Annex 4 is a table titled “Landings and Landed Values of Commercial fisheries in the Great Lakes by Species and Lake in 2011” and is sourced from the Ontario Ministry of Natural Resources. The table has six columns. The first is captioned “Species”; the second “Eerie”; the third “Huron”; the fourth “Ontario”; the fifth “Superior”; and the sixth “Grand Total”. There are four main rows under the “Species” column: “Landings (lbs.); “Total”; “Landed Values”; and “Total.” The landings (lbs.) for Yellow and White Perch by lake are as follows: 8,639,438 for Eerie; 400,888 for Huron; 153,276 for Ontario; and 1,600 for Superior for a grand total of 9,195,202. The landings (lbs.) for Rainbow Smelt by lake are as follows: 5,909,710 for Eerie; 261 for Huron; no data for Ontario; and 1 for Superior for a grand total of 5,909,972. The landings (lbs.) for Walleye by lake are as follows: 4,417,966 for Eerie; 176,516 for Huron; 24,230 for Ontario; and 811 for Superior for a grand total of 4,619,523. The landings (lbs.) for Lake Whitefish by lake are as follows: 530,013 for Eerie; 2,774,792 for Huron; 78,208 for Ontario; and 255,714 for Superior for a grand total of 3,638,727. The landings (lbs.) for White Bass by lake are as follows: 1,823,374 for Eerie; 1,243 for Huron; 155 for Ontario; and no data for Superior for a grand total of 1,824,772. The landings (lbs.) for Others, which includes American Eel, Bigmouth Buffalo, Black Crappie, Bowfin, Brown Bullhead, Burbot, Channel Catfish, Chinook Salmon, Cisco, Common Carp, Freshwater Drum, Gizzard Shad, Lake Trout, Lepomis, Moxostoma, Mudpuppy, Northern Pike, Oncorhynchus, Pink Salmon, Pomoxis, Quillback, Rainbow Trout, Rock Bass, Round Whitefish, Sea Lamprey, Suckers, and White Sucker, by lake are as follows: 445,358 for Eerie; 365,797 for Huron; 189,944 for Ontario; and 519,934 for Superior for a grand total of 1,521,033. The total landings (lbs.) per lake are as follows: 21,765,859 for Eerie; 3,719,497 for Huron; 445,812 for Ontario; and 778,061 for Superior for a grand total of 26,709,229. The landed values for Yellow and White Perch by lake are as follows: $15,188,370 for Eerie; $887,012 for Huron; $285,436 for Ontario; and $2,416 for Superior for a grand total of $16,363,235. The landed values for Rainbow Smelt by lake are as follows: $1,359,120 for Eerie; $73 for Huron; $0 for Ontario; and $0 for Superior for a grand total of $1,359,193. The landed values for Walleye by lake are as follows: $9,039,586 for Eerie; $444,159 for Huron; $57,113 for Ontario; and $1,217 for Superior for a grand total of $9,542,074. The landed values for Lake Whitefish by lake are as follows: $717,572 for Eerie; $3,223,094 for Huron; $72,497 for Ontario; and $246,538 for Superior for a grand total of $4,259,701. The landed values for White Bass by lake are as follows: $1,432,657 for Eerie; $909 for Huron; $89 for Ontario; and $0 for Superior for a grand total of $1,433,655. The landed values for Others, which includes American Eel, Bigmouth Buffalo, Black Crappie, Bowfin, Brown Bullhead, Burbot, Channel Catfish, Chinook Salmon, Cisco, Common Carp, Freshwater Drum, Gizzard Shad, Lake Trout, Lepomis, Moxostoma, Mudpuppy, Northern Pike, Oncorhynchus, Pink Salmon, Pomoxis, Quillback, Rainbow Trout, Rock Bass, Round Whitefish, Sea Lamprey, Suckers, and White Sucker, by lake are as follows: $36,961 for Eerie; $195,631 for Huron; $167,512 for Ontario; and $209,183 for Superior for a grand total of $609,287. The total landed values per lake are as follows: $27,774,266 for Eerie; $4,750,877 for Huron; $582,648 for Ontario; and $459,354 for Superior for a grand total of $33,567,145.
| Species | Erie | Huron | Ontario | Superior | Grand Total |
|---|---|---|---|---|---|
| Landings (lbs.) | |||||
| Yellow and White Perch | 8,639,438 | 400,888 | 153,276 | 1,600 | 9,195,202 |
| Rainbow Smelt | 5,909,710 | 261 | - | 1 | 5,909,972 |
| Walleye | 4,417,966 | 176,516 | 24,230 | 811 | 4,619,523 |
| Lake Whitefish | 530,013 | 2,774,792 | 78,208 | 255,714 | 3,638,727 |
| White Bass | 1,823,374 | 1,243 | 155 | - | 1,824,772 |
| Others* | 445,358 | 365,797 | 189,944 | 519,934 | 1,521,033 |
| Total | 21,765,859 | 3,719,497 | 445,812 | 778,061 | 26,709,229 |
| Landed Values | |||||
| Yellow and White Perch | $15,188,370 | $887,012 | $285,436 | $2,416 | $16,363,235 |
| Rainbow Smelt | $1,359,120 | $73 | $0 | $0 | $1,359,193 |
| Walleye | $9,039,586 | $444,159 | $57,113 | $1,217 | $9,542,074 |
| Lake Whitefish | $717,572 | $3,223,094 | $72,497 | $246,538 | $4,259,701 |
| White Bass | $1,432,657 | $909 | $89 | $0 | $1,433,655 |
| Others* | $36,961 | $195,631 | $167,512 | $209,183 | $609,287 |
| Total | $27,774,266 | $4,750,877 | $582,648 | $459,354 | $33,567,145 |
Source: Ontario Ministry of Natural Resources
Note: * Includes American Eel, Bigmouth Buffalo, Black Crappie, Bowfin, Brown Bullhead, Burbot, Channel Catfish, Chinook Salmon, Cisco, Common Carp, Freshwater Drum, Gizzard Shad, Lake Trout, Lepomis, Moxostoma, Mudpuppy, Northern Pike, Oncorhynchus, Pink Salmon, Pomoxis, Quillback, Rainbow Trout, Rock Bass, Round Whitefish, Sea Lamprey, Suckers, White Sucker.
Annex 5: Number of Fish Harvested All Anglers Who Fished on the Great Lakes, by Species and Lake, 2005
Description
Annex 5 is a table titled “Number of Fish Harvested All Anglers Who Fished on the Great Lakes, by Species and Lake, 2005” and is sourced from DFO (2008). The table has 9 columns. The first is captioned “Name of the Species”; the second “Lake Ontario”; the third “Lake Eerie”; the fourth “Lake St. Clair”; the fifth “Lake Huron”; the sixth “Lake Superior”; the seventh “St. Lawrence River”; the eighth “Great Lakes Basin”; and the ninth “Species %.” Row 1 is Walleye with values as follows: 287,888 for Lake Ontario; 303,442 for Lake Eerie; 338,751 for Lake St. Clair; 336,457 for Lake Huron; 530,328 for Lake Superior; 125,542 for the St. Lawrence River; 1,922,410 for the Great Lakes Basin; and 8.1% for species %. Row 2 is Pike with values as follows: 124,297 for Lake Ontario; 178,935 for Lake Eerie; 29,411 for Lake St. Clair; 471,927 for Lake Huron; 196,863 for Lake Superior; 181,229 for the St. Lawrence River; 1,182,661 for the Great Lakes Basin; and 5.0% for species %. Row 3 is Perch with values as follows: 872,121 for Lake Ontario; 3,567,973 for Lake Eerie; 1,608,046 for Lake St. Clair; 754,588 for Lake Huron; 48,852 for Lake Superior; 699,235 for the St. Lawrence River; 7,550,815 for the Great Lakes Basin; and 31.9% for species %. Row 4 is Muskellunge with values as follows: 1,293 for Lake Ontario; 567 for Lake Eerie; 102,457 for Lake St. Clair; 12,314 for Lake Huron; 671 for Lake Superior; 4,894 for the St. Lawrence River; 122,196 for the Great Lakes Basin; and 0.5% for species %. Row 5 is Whitefish with values as follows: 16,996 for Lake Ontario; 9,219 for Lake Eerie; 17,042 for Lake St. Clair; 28,787 for Lake Huron; 8,887 for Lake Superior; no data for the St. Lawrence River; 80,931 for the Great Lakes Basin; and 0.3% for species %. Row 6 is Smallmouth bass with values as follows: 236,764 for Lake Ontario; 639,584 for Lake Eerie; 325,163 for Lake St. Clair; 1,319,003 for Lake Huron; 70,153 for Lake Superior; 243,330 for the St. Lawrence River; 2,833,998 for the Great Lakes Basin; and 12.0% for species %. Row 7 is Largemouth bass with values as follows: 162,112 for Lake Ontario; 161,795 for Lake Eerie; 111,008 for Lake St. Clair; 349,287 for Lake Huron; 7,900 for Lake Superior; 134,513 for the St. Lawrence River; 926,614 for the Great Lakes Basin; and 3.9% for species %. Row 8 is Rainbow Trout with values as follows: 286,366 for Lake Ontario; 60,744 for Lake Eerie; 2,703 for Lake St. Clair; 331,965 for Lake Huron; 15,764 for Lake Superior; 13,728 for the St. Lawrence River; 711,269 for the Great Lakes Basin; and 3.0% for species %. Row 9 is Brown Trout with values as follows: 58,373 for Lake Ontario; 6,726 for Lake Eerie; 809 for Lake St. Clair; 13,091 for Lake Huron; 223 for Lake Superior; no data for the St. Lawrence River; 79,223 for the Great Lakes Basin; and 0.3% for species %. Row 10 is Lake Trout with values as follows: 65,417 for Lake Ontario; 40,065 for Lake Eerie; 659 for Lake St. Clair; 175,956 for Lake Huron; 47,809 for Lake Superior; 4,832 for the St. Lawrence River; 334,736 for the Great Lakes Basin; and 1.4% for species %. Row 11 is Brook Trout with values as follows: 11,830 for Lake Ontario; 1,015 for Lake Eerie; 330 for Lake St. Clair; 27,660 for Lake Huron; 964,391 for Lake Superior; no data for the St. Lawrence River; 1,005,225 for the Great Lakes Basin; and 4.3% for species %. Row 12 is Splake with values as follows: 7,524 for Lake Ontario; no data for Lake Eerie; no data for Lake St. Clair; 8,757 for Lake Huron; 231 for Lake Superior; 9,508 for the St. Lawrence River; 26,020 for the Great Lakes Basin; and 0.1% for species %. Row 13 is Chinook with values as follows: 184,122 for Lake Ontario; 6,833 for Lake Eerie; no data for Lake St. Clair; 217,182 for Lake Huron; 18,754 for Lake Superior; no data for the St. Lawrence River; 426,890 for the Great Lakes Basin; and 1.8% for species %. Row 14 is Coho with values as follows: 57,478 for Lake Ontario; 2,703 for Lake Eerie; 272 for Lake St. Clair; 41,800 for Lake Huron; 7,131 for Lake Superior; no data for the St. Lawrence River; 109,384 for the Great Lakes Basin; and 0.5% for species %. Row 15 is Sturgeon with values as follows: no data for Lake Ontario; 338 for Lake Eerie; 482 for Lake St. Clair; no data for Lake Huron; no data for Lake Superior; no data for the St. Lawrence River; 820 for the Great Lakes Basin; and 0.0% for species %. Row 16 is Catfish with values as follows: 192,557 for Lake Ontario; 118,420 for Lake Eerie; 139,306 for Lake St. Clair; 55,158 for Lake Huron; 1,986 for Lake Superior; 122,691 for the St. Lawrence River; 630,119 for the Great Lakes Basin; and 2.7% for species %. Row 17 is Crappie with values as follows: 468,881 for Lake Ontario; 185,900 for Lake Eerie; 173,418 for Lake St. Clair; 133,100 for Lake Huron; no data for Lake Superior; 17,042 for the St. Lawrence River; 978,342 for the Great Lakes Basin; and 4.1% for species %. Row 18 is Rock Bass with values as follows: 242,585 for Lake Ontario; 291,598 for Lake Eerie; 234,938 for Lake St. Clair; 797,926 for Lake Huron; 3,424 for Lake Superior; 148,308 for the St. Lawrence River; 1,718,779 for the Great Lakes Basin; and 7.3% for species %. Row 19 is Sunfish with values as follows: 428,603 for Lake Ontario; 729,846 for Lake Eerie; 295,439 for Lake St. Clair; 509,590 for Lake Huron; no data for Lake Superior; 201,358 for the St. Lawrence River; 2,164,836 for the Great Lakes Basin; and 9.2% for species %. Row 20 is Smelt with values as follows: 43,253 for Lake Ontario; 945 for Lake Eerie; no data for Lake St. Clair; 39,814 for Lake Huron; 93,537 for Lake Superior; no data for the St. Lawrence River; 177,550 for the Great Lakes Basin; and 0.8% for species %. Row 21 is Other fish with values as follows: 140,743 for Lake Ontario; 188,050 for Lake Eerie; 155,642 for Lake St. Clair; 128,407 for Lake Huron; 5,524 for Lake Superior; 35,638 for the St. Lawrence River; 654,006 for the Great Lakes Basin; and 2.8% for species %. Row 22 is the Total with values as follows: 3,889,202 for Lake Ontario; 6,494,699 for Lake Eerie; 3,535,878 for Lake St. Clair; 5,752,768 for Lake Huron; 2,022,429 for Lake Superior; 1,941,848 for the St. Lawrence River; 23,636,825 for the Great Lakes Basin; and 100.0% for species %.
| Name of the Species | Lake Ontario | Lake Erie | Lake St. Clair | Lake Huron | Lake Superior | St. Lawrence River | Great Lakes Basin | Species % |
|---|---|---|---|---|---|---|---|---|
| Walleye | 287,888 | 303,442 | 338,751 | 336,457 | 530,328 | 125,542 | 1,922,410 | 8.1% |
| Pike | 124,297 | 178,935 | 29,411 | 471,927 | 196,863 | 181,229 | 1,182,661 | 5.0% |
| Perch | 872,121 | 3,567,973 | 1,608,046 | 754,588 | 48,852 | 699,235 | 7,550,815 | 31.9% |
| Muskellunge | 1,293 | 567 | 102,457 | 12,314 | 671 | 4,894 | 122,196 | 0.5% |
| Whitefish | 16,996 | 9,219 | 17,042 | 28,787 | 8,887 | - | 80,931 | 0.3% |
| Smallmouth bass | 236,764 | 639,584 | 325,163 | 1,319,003 | 70,153 | 243,330 | 2,833,998 | 12.0% |
| Largemouth bass | 162,112 | 161,795 | 111,008 | 349,287 | 7,900 | 134,513 | 926,614 | 3.9% |
| Rainbow Trout | 286,366 | 60,744 | 2,703 | 331,965 | 15,764 | 13,728 | 711,269 | 3.0% |
| Brown Trout | 58,373 | 6,726 | 809 | 13,091 | 223 | - | 79,223 | 0.3% |
| Lake Trout | 65,417 | 40,065 | 659 | 175,956 | 47,809 | 4,832 | 334,736 | 1.4% |
| Brook Trout | 11,830 | 1,015 | 330 | 27,660 | 964,391 | - | 1,005,225 | 4.3% |
| Splake | 7,524 | - | - | 8,757 | 231 | 9,508 | 26,020 | 0.1% |
| Chinook | 184,122 | 6,833 | - | 217,182 | 18,754 | - | 426,890 | 1.8% |
| Coho | 57,478 | 2,703 | 272 | 41,800 | 7,131 | - | 109,384 | 0.5% |
| Sturgeon | - | 338 | 482 | - | - | - | 820 | 0.0% |
| Catfish | 192,557 | 118,420 | 139,306 | 55,158 | 1,986 | 122,691 | 630,119 | 2.7% |
| Crappie | 468,881 | 185,900 | 173,418 | 133,100 | - | 17,042 | 978,342 | 4.1% |
| Rock Bass | 242,585 | 291,598 | 234,938 | 797,926 | 3,424 | 148,308 | 1,718,779 | 7.3% |
| Sunfish | 428,603 | 729,846 | 295,439 | 509,590 | - | 201,358 | 2,164,836 | 9.2% |
| Smelt | 43,253 | 945 | - | 39,814 | 93,537 | - | 177,550 | 0.8% |
| Other fish | 140,743 | 188,050 | 155,642 | 128,407 | 5,524 | 35,638 | 654,006 | 2.8% |
| Total | 3,889,202 | 6,494,699 | 3,535,878 | 5,752,768 | 2,022,429 | 1,941,848 | 23,636,825 | 100.0% |
Source: DFO (2008)
Annex 6: Heat-Map - Commercial and Recreational Fishing for 20 and 50 Years
A: Commercial and Recreational Fishing by Lake for 20 Years
Description
Graph A is captioned “Commercial and Recreational Fishing by Lake for 20 Years.” The vertical variable is “Uncertainty” with the sub-variables “Low,” “Moderate,” and “High,” and the horizontal variable is “Risk” with the sub-variables “Low,” “Moderate,” and “High.” Lake Superior falls in the moderate to high category of uncertainty with a low risk. Lakes Eerie, Huron and and Ontario fall in the moderate to high category with a moderate risk.

B: Commercial and Recreational Fishing by Lake for 50 Years
Description
Graph B is captioned “Commercial and Recreational Fishing by Lake for 50 Years.” The vertical variable is “Uncertainty” with the sub-variables “Low,” “Moderate,” and “High,” and the horizontal variable is “Risk” with the sub-variables “Low,” “Moderate,” and “High.” Lake Superior falls in the moderate to high category of uncertainty with a moderate risk. Lakes Eerie, Huron and and Ontario fall in the moderate to high category of uncertainty with a high risk.

- Date modified: