
Center of Expertise in Marine Mammalogy: Scientific Research Report 2006-2008
Table of Contents
- Acknowlegements
- Message from the Director of CEMAM
- 1.0 Overview
- 2.0 Population Dynamics
- 2.1 Abundance
- 2.1.1 SPLASH: International Study on Humpback Whales of the North Pacific (John Ford)
- 2.1.2 Abundance of Western Hudson Bay Beluga (Pierre Richard)
- 2.1.3 Abundance of St. Lawrence Estuary Beluga (Jean-François Gosselin)
- 2.1.4 Age Structure, Growth, Mortality, and Density of Beluga in the Canadian Arctic (Steve Ferguson)
- 2.1.5 Continued Reduction in Population Growth of Grey Seals at Sable Island (Don Bowen and Mike Hammill)
- 2.1.6 Timing of Pupping and Abundance of Northwest Atlantic Hooded Seals (Garry Stenson and Mike Hammill)
- 2.1.7 Abundance of Stellar Sea Lions in British Columbia (Peter Olesiuk)
- 2.1.8 Abundance of Eastern Arctic Bowhead Whales (Larry Dueck)
- 2.2 Identifying Population Structure Using Molecular Genetics
- 2.2.1 Distinguishing East Hudson Bay vs. West Hudson Bay Belugas Using Molecular Markers (Lianne Postma)
- 2.2.2 Molecular Genetics for the Identification of Stocks of Narwhal in Nunavut (Lianne Postma)
- 2.2.3 Patterns of Genetic Differentiation in Bowhead Whales from the Eastern Canadian Arctic and Western Greenland (Lianne Postma)
- 2.3 Reproduction and Mortality
- 2.3.1 Condition-Dependent Male Mating Tactics in the Grey Seal: The Importance of Body Size (Don Bowen)
- 2.3.2 An Evaluation of Steller Sea Lion Pup Counts from 35mm Oblique Images (Peter Olesiuk)
- 2.3.3 Life History and Population Dynamics of Northern Resident Killer Whales in British Columbia (Peter Olesiuk, Graeme Ellis and John Ford)
- 2.4 Role of Disease in Marine Mammal Populations
- 2.1 Abundance
- 3.0 How Marine Mammals Fit Into the Ecosystem
- 3.1 Distribution
- 3.2 Habits
- 3.2.1 Diving Characteristics and Sightability Estimates of Eastern Arctic Bowhead Whales Based on Satellite-Linked Telemetry (Larry Dueck)
- 3.2.2 Ringed Seal Ecology (Steve Ferguson)
- 3.2.3 Development of PAM Methodology to Non-Intrusively Monitor Whales in their Environment with Examples from the St. Lawrence Seaway and Arctic (Yvan Simard)
- 3.3 Foraging Ecology and Diet
- 3.4 Predator-Prey Interactions
- 3.5 Marine Mammal Habitat
- 4.0 Human Impacts on Marine Mammals
- 5.0 Publications 2006-2008
Acknowlegements
This publication was made possible by the many DFO marine mammal scientists from across Canada providing input and guidance. We acknowledge support staff, reviewers and all those who made valuable contributions toward the production of this publication. In addition, we thank Christine Abraham, Estelle Couture and Kerri Swail for their hard work in compiling the report.
Specifically, we would like to thank the contributors who provided the text for this publication:
- Don Bowen - Research Scientist, Halifax, NS
- Larry Dueck - Biologist, Winnipeg, MB
- Steve Ferguson - Research Scientist, Winnipeg, MB
- John Ford - Research Scientist, Nanaimo, BC
- Jean-François Gosselin - Research Scientist, Mont-Joli, QC
- Mike Hammill - Research Scientist, Mont-Joli, QC
- Lois Harwood - Biologist, Yellowknife, NWT
- Jeff Higdon - Biologist, Winnipeg, MB
- Jack Lawson - Research Scientist, St. John's, NL
- Véronique Lesage - Research Scientist, Mont-Joli, QC
- Lena Measures - Research Scientist, Mont-Joli, QC
- Linda Nichol - Biologist, Nanaimo, BC
- Peter Olesiuk - Biologist, Nanaimo, BC
- Lianne Postma - Biologist, Winnipeg, MB
- Pierre Richard - Research Scientist, Winnipeg, MB
- Peter Ross - Research Scientist, Sidney, BC
- Yvan Simard - Research Scientist, Mont-Joli, QC
- Becky Sjare - Research Scientist, St. John's, NL
- Kent Smedbol - Research Scientist, St. Andrews, NB
- Garry Stenson - Research Scientist, St. John's, NL
- Heath Stone - Biologist, St. Andrews, NB
- Edward Trippel - Research Scientist, St. Andrews, NB
Message from the Director of CEMAM

Mike Hammill, the director of CEMAM
Photo: Garry Stenson
The Centre of Expertise in Marine Mammalogy (CEMAM) of Fisheries and Oceans Canada (DFO) is a virtual centre that is based on the hard work and dedication of some forty professionals and support staff in seven laboratories across the country. Our mandate is to advise the Federal government on issues relating to marine mammals in Canada. When I first started with the Department, many years ago, the majority of questions we addressed focussed on stock assessment and providing advice on allowable catch levels. Over the years, our research, while continuing to assess populations, has expanded substantially to address such issues as evaluating impacts of industrial development (Fisheries Act), providing advice for critical habitat, recovery potential and recovery plans (Species at Risk Act), and providing advice on marine mammals in Marine Protected Areas and Large Ocean Management Areas (Oceans Act).
The strength of CEMAM depends on the mix of skills within the Centre and how these skills are deployed within the organization across the country. Like many groups within the Department, our workforce is ageing and we must look seriously at how we can renew over the next few years. This renewal will require maintaining our quantitative expertise in assessing populations, as well as hiring people with different skill sets and providing learning opportunities to address the diversity in requests for advice that we receive. Some new challenges can be expected as well. These include trying to define critical habitat in the marine environment, which has historically been viewed from a regional scale within the Department, but must be regarded within the context of the ocean basin to account for the large spatial scales over which many of these large mammals range. Other new challenges include evaluating the impacts of increasing noise levels in the ocean on marine mammal foraging and communication, as well as changing environmental conditions associated with global climate change.
While providing advice is the major component in our mandate, CEMAM scientists are also involved in fundamental, leading edge science. This research includes such activities as our participation in the international Trans-North Atlantic Sighting Surveys, of which the Canadian component provided the first estimates of abundance and distribution of many cetaceans, turtles and basking sharks along the Canada Atlantic coast. Also, we have been active in the development of a new framework for the management of seals, deployments of cameras on seals to study foraging behaviour; studying habitat use of blue whales and beluga using time-depth recorders and developing new data analyses approaches; documenting the increase in observations of killer whales in the Arctic, looking at movements of satellite equipped seals, and reactions of bowhead whales to seismic activity; studying killer whale predation on other cetaceans, completing the first ever Pacific-wide estimate of humpback whale abundance, or the ongoing changes in killer whale survival and its tight link to Chinook salmon stocks.
Since 2006, CEMAM scientists have trained over 60 highly qualified personnel. These MSc, PhD and Post-doc graduates are making significant contributions to our understanding of marine mammals and their role in marine ecosystems. At the same time, their research programs often lead them to work alongside stakeholders with very diverse backgrounds. These opportunities provide them with first hand experience to see how their research impacts on Canadians. These new scientists are the future of marine mammal research in Canada and internationally.
In our first report, we highlighted the different approaches used to address questions such as looking at diet composition or assessing abundance. In this, our second report, we have focussed more on some of the diverse research results achieved over the last three years.
1.0 Overview
The Centre of Expertise in Marine Mammology (CEMAM) has been charged with identifying marine mammal research priorities and increasing the visibility of its marine mammal program. Marine mammal scientists, and CEMAM, have many reasons for performing research activities. This research involves national and international collaborations with industry, universities, non-government organizations (NGOs), and other government agencies. For example, many of the marine mammals in the Arctic are co-managed with the Nunavut Wildlife Management Board.
There are many commitments to the Species at Risk Act (SARA), as many marine mammals in Canada are threatened or endangered, and thus advice needs to be provided relating to recovery potential. Research is also required under the Oceans Act, under which Marine Protected Areas are created, and the Fisheries Act, which has a section specifically for marine mammals, to ensure protection. Several species of marine mammal are hunted in Canada, both commercially and for subsistence. The Marine Mammal Regulations of the Fisheries Act aims to regulate and monitor these hunts. It is the responsibility of CEMAM to conduct surveys and assessments in order to provide abundance estimates and total allowable catch (TAC) levels for these hunts.
Within CEMAM there are several research priorities, which include fish population and community productivity, habitat and population linkages, climate change and variability, and aquatic animal health. These are linked to the strategic outcomes that include understanding and describing the state of aquatic ecosystems and assessing and mitigating the impacts of human activities.
There are three main research themes, which form the pillars of this report. These three themes explore research to cover the four objectives of CEMAM: population research, marine mammal role in the ecosystem, impacts of development, and aquatic animal health.
Population dynamics is the study of population size and factors that affect abundance, such as age-specific reproductive rates, mortality rates, and levels of immigration/emigration. Energy intake and disease are also important factors when determining population dynamics.
The role of marine mammals in marine ecosystems is the second theme, and is a complex issue. Many pieces of information are required, including overall consumption. To assess the impacts, prey abundance is required, as well as prey locality, nutritional needs, and energy expenditure. Some marine mammals are top level predators while others are lower in the food chain as they feed on benthic and pelagic invertebrates.
Human impact on marine mammals is the third, and final, theme. The most obvious impact is harvesting for both commercial and subsistence purposes. Other impacts include, but are not limited to, marine mammal watching, petroleum exploration, commercial shipping, and coastal development. These may have short-term impacts or longer-term impacts on survival.
This publication covers the last three years of research done by the scientists within CEMAM, divided by the three pillars. The aim of this publication is to provide an overview of the diversity of this research that is being done on marine mammals within DFO.
2.0 Population Dynamics
2.1 Abundance
2.1.1 SPLASH: International Study on Humpback Whales of the North Pacific
John Ford

Figure 1. Locations of sightings of over 6,000 humpback whales off the coast of British Columbia, 1982-2007.
Like many of the world's populations of great whales, humpback whales in the North Pacific were severely depleted by whaling in the early to mid 20th century. About 28,000 humpback whales were killed in the eastern North Pacific alone, and by the end of commercial whaling in 1965 an estimated 2,000 or fewer whales remained. In recent years, the humpback has been showing some signs of recovery, but no good estimates of population abundance or trends have been available for the North Pacific. The species is still considered Threatened under Canada's Species at Risk Act.
In the early 2000s, a group of whale researchers from several Pacific Rim countries, including Canada, proposed an ambitious study to determine the status of humpback whales throughout the North Pacific. Called SPLASH (Structure of Populations, Levels of Abundance and Status of Humpbacks), this initiative ultimately became the largest whale study ever attempted. It involved a three-year field effort with over 400 researchers in ten countries: Canada, the US, Russia, Japan, Mexico, Philippines, Guatemala, Nicaragua, El Salvador and Costa Rica. The field study was based primarily on two approaches: photo-identification of individual whales using natural markings on the tail flukes, to determine population abundance and migratory linkages between breeding and feeding areas, and DNA analysis of skin biopsy samples to determine population genetic structure.
The SPLASH study has been a tremendous success. More than 8,000 individual humpbacks were catalogued, and mark-recapture analyses of this dataset yielded an abundance estimate of about 18,000 whales in the North Pacific. Skin samples were obtained from more than 6,000 whales and these have revealed a complex genetic structure among the various regions of the North Pacific.

Humpback flukes and Canadian Coast Guard Service vessel
Photo: John Ford
Scientists from DFO played a major role in SPLASH, from the early planning stages through completion of intensive field research off the B.C. coast (e.g. Fig. 1), to analysis of thousands of identification photos. As with other areas of the North Pacific, the humpback whale population that feeds off Canada's Pacific coast is growing rapidly at an estimated annual rate of about four percent per year due to recruitment and a high survival rate approaching 98 percent per year. The best estimate of abundance for humpback whales in B.C. waters is about 2,000 whales.
Humpback whale photo-IDs collected in British Columbia waters during summer and fall were matched to IDs collected on subtropical breeding grounds, where these whales congregate in winter. This revealed that humpbacks in B.C. migrate primarily to two different destinations: those found off Vancouver Island tend to migrate to waters off Mexico's west coast, while those found off B.C.'s north coast migrate mostly to Hawaii.
SPLASH has shed much new light on the status of humpback whales across the North Pacific as well as in Canadian waters. It has been particularly timely, as DFO is currently developing a Recovery Strategy for humpback whales in Canadian Pacific waters. Humpback whales appear to be recovering well, though they are not yet out of danger. Current threats to survival and recovery of this humpback whale population include vessel strikes, entanglement in fishing gear, increasing underwater noise, and prey limitation. However, none of these threats appears to be currently affecting the population's strong growth rate.
2.1.2 Abundance of Western Hudson Bay Beluga
Pierre Richard

Beluga whale pod
Photo: Véronique Lesage
The Western Hudson Bay beluga population summers in the coastal waters of Manitoba; the largest aggregations occur in the estuaries of the Seal, Churchill, and Nelson rivers. Two surface population estimates of 23,000 and 25,100 were obtained based on visual and aerial photographic surveys in 1987.
Aerial surveys were flown in western and southern Hudson Bay in 2004. A combination of aerial visual line-transect surveys and photographic surveys were used to estimate the numbers of beluga, with a correction for availability bias (animals missed by observers because they were diving out of sight). The new estimate was 57,300 (95 percent C.L.: 37,700-87,100). Past survey estimates, once adjusted for availability bias, yield similar numbers, suggesting that the population has not experienced a detectable change in numbers since 1987.
2.1.3 Abundance of St. Lawrence Estuary Beluga
Jean-François Gosselin

Beluga whale survey photograph
Photo: Jack Orr
Surveys to evaluate St. Lawrence beluga abundance have used a variety of methods, including boats, helicopters, airplanes, visual, and photographic surveys. The 1995 St. Lawrence beluga recovery plan recommended that a standard method be adopted to estimate abundance and improve the monitoring of the population. Since 1988, seven surveys of belugas in the St. Lawrence estuary have followed a systematic aerial photographic survey method. The latest of these surveys was conducted in 2003 and correcting for animals that were diving while the planes passed overhead provided an abundance index of 1,300 (rounded to nearest 100). Using the photographic estimates since 1988, a population model suggests that, in spite of 30 years of protection from hunting, the St. Lawrence estuary beluga shows no sign of recovery with a current population of approximately 1,100 (rounded to nearest 100).
Considerable variability has been observed between abundance indices since 1988, which is thought to result from challenges in trying to survey a small population with a clumped distribution. In 2005, 19 visual line transect surveys conducted to evaluate the effect of altitude on abundance estimates using this method, along with five visual line transect surveys conducted in 2003 were used to capture some of the variability associated with the clumping distribution of belugas in the St. Lawrence and to compare estimates from the two survey methods. The abundance index of the 2003 photographic survey was lower, representing 68% of the combined estimate of the five visual line transect surveys of that same year, but was not different than the combined estimates of the 2005 visual surveys. Although abundance indices from the two methods were not different, additional comparisons should be completed to ensure calibration of these two techniques.
2.1.4 Age Structure, Growth, Mortality, and Density of Beluga in the Canadian Arctic
Steve Ferguson

Beluga whale and calf
Photo: W. Klenner
Polar and sub-polar marine ecosystems display the world's largest seasonal variations and extremes in physical characteristics of the environment. Where the environment is such a strong force, life history strategies are often viewed as adaptations to different degrees of seasonality and/or predictability of resources, typically food. Environmental constraints are expected to increase with seasonality in resources such as food and appropriate breeding habitat.
Comparisons of age structure and growth among beluga populations have been limited in geographical scope to test predictions about the influence of environmental factors and density. A comprehensive comparison is needed, considering that two Canadian stocks are classified as endangered, two as threatened, and two as special concern under SARA.
In this study, age structure, body length distribution, mortality, and population density were compared between four beluga populations of the Canadian Arctic: Baffin Bay, Cumberland Sound, Western Hudson Bay, and Eastern Hudson Bay. Growth, but not mortality, showed a significant positive relationship with latitude. Age distributions differed in shape between populations, with animals at the highest latitude (Eastern Beaufort Sea) being the oldest and attaining the longest adult body lengths. Although differences in hunting selectivity and pressure may have played a role in the observed responses, the variation in adult body size suggests that environmental seasonality may impose stronger constraints on life history traits of beluga with increasing latitude.
2.1.5 Continued Reduction in Population Growth of Grey Seals
Don Bowen and Mike Hammill

North beach of the Sable Island grey seal colony
Photo: Don Bowen
One of the longest series of estimates of seal pup production comes from a study which began in 1962 at Sable Island, Nova Scotia. The number of grey seal pups born at Sable Island has increased exponentially over the past four decades. Within its Canadian range, the grey seal forages widely throughout the Scotian Shelf and the Gulf of St. Lawrence during the non-breeding season. Major grey seal breeding colonies are located on the sea ice in the southern Gulf of St. Lawrence and on Sable Island.
A digital-photographic aerial survey was conducted on Sable Island in January 2007 to estimate grey seal pup production. A total of 48,036 pups were counted on the digital imagery. Corrections were made for the proportion of pups that died prior to the survey and for those born after the survey was completed; the new estimate was 54,500. For the non-Sable Island component of the population, visual strip transect surveys were flown over the whelping patches on the ice in the Gulf of St. Lawrence, and counts were completed at islands in the Gulf and along the Nova Scotia Eastern Shore. Aerial searches were also conducted along the south and southwest coast of Newfoundland and Anticosti Island. Counts were corrected for the proportion of pupping that took place after the survey was completed.
Where possible, counts were corrected for the proportion of pupping completed when the survey was completed. Changes in age-specific pelage-stage durations resulted in a 17 percent change in pup production estimates. Total non Sable Island pup production, rounded to the nearest thousand, is estimated to be 13,000 animals. The proportion of pups born on Sable Island has increased from less than five percent in the mid-1980s to about 70 percent in 2007.
The 2007 estimate indicates that pup production on Sable Island has continued to increase, but the rate of increase has declined over the past two surveys. The proportion of females giving birth at ages four to seven years, from the 1998-2002 cohorts, were significantly lower than those in the mid- to late- 1980s. The new estimate of pup production and new data on age of primiparity provide further indication of changes in vital rates of this population. Pup production of the non-Sable Island component has not shown the same increase as on Sable Island. This may be due to higher and more variable pup mortality rates for animals born on the ice in the Gulf of St. Lawrence.
The survey data were incorporated into a population model along with data on reproductive rates as well as information on reported catches. The total estimated population size at the end of the 2007 breeding season (i.e., including pups) was 304,000.
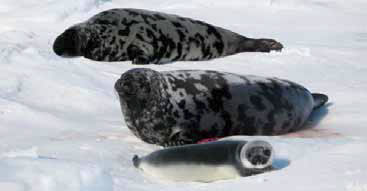
2.1.6 Timing of Pupping and Abundance of Northwest Atlantic Hooded Seals
Garry Stenson and Mike Hammill

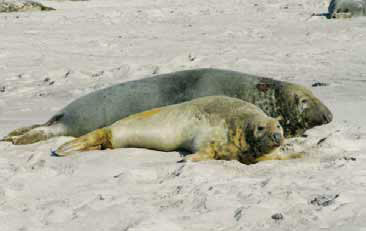
Male hooded seal
Photo: Mike Hammill

Figure 2. Reported catches of Northwest Atlantic hooded seals, 1946-2006.

Figure 3. Estimated abundance of Northwest Atlantic hooded seals, 1865-2006.
Whelping of hooded seals occurs on pack ice around Jan Mayen Island, in the Davis Strait, off the northeast coast of Newfoundland (called the Front), and in the Gulf of St. Lawrence. The relationships between the different breeding groups are poorly understood; some analyses using DNA techniques support the hypothesis of a single population.
Surveys have been flown during the breeding season to look at the timing of births during the spring. At the Front, the mean date by which pupping had finished was 28 March, with a range of 18 March to 4 April. In the Gulf, pupping in most years had finished by the start of April, with the exception of 1994, when the model predicted that pupping continued until May. Excluding this data, births would have finished by 28 March, with a range of 25 March to 31 March.
Nursing hooded seals are first observed early in March. This indicates that hooded seal births are spread over a longer time period than seen among harp seals that pup in the same area. Taking into consideration the possibility of late births, particularly in heavy ice years, nursing should be complete by 8-10 April.
Using sequential population analyses or survival indices, researchers estimated hooded seal pup production at the Front to be approximately 30,000 in the early 1980s. However, independent aerial survey estimates of pup production in mid 1980s indicated that pup production was approximately 62,000 during the 1980s and 83,000 in 1990. Unfortunately, there is less known about the historical abundance of animals in Davis Strait and in the Gulf. A survey flown in 1984 estimated pup production in Davis Strait to be approximately 18,600. Relatively few pups are born in the Gulf of St Lawrence, with estimates from aerial surveys being 2,000 and 4,000 animals in 1990 and 1994, respectively.
The most recent estimates of pup production were obtained from surveys of the Front in 2004 and from all three whelping areas in 2005. In 2004, pup production at the Front was estimated to be 123,862. In 2005, pup production at the Front was estimated to be 107,013, while 6,620 pups were estimated to have been born in the Gulf. Pup production in the Davis Strait whelping concentration was estimated to be 3,346. Combining these areas resulted in an estimated pup production in the three northwest Atlantic whelping areas of 116,900. Comparison with previous estimates suggests that pup production may have increased since the mid 1980s.
A population model incorporating hooded seal pup production estimates since the 1980s, reproductive rates and human induced mortality (reported catches and struck and lost) were used to estimate total abundance for the period 1965 – 2005 (Fig. 2).
Fitting to pup production estimates from all herds and making assumptions about numbers of hooded seals in the Davis Strait herd for years when this area was not included in the survey program, resulted in an estimated total population of 593,500 in 2006 (Fig. 3). However, there is considerable uncertainty associated with these estimates owing to our lack of understanding of the relationship between the Davis Strait, Front and Gulf pupping areas, few surveys of all three areas, limited reproductive data and uncertain harvest statistics.
2.1.7 Abundance of Stellar Sea Lions in British Columbia
Peter Olesiuk

Sea lions are the only Otariid (the family containing fur seals and sea lions) that reside year-round and breed on the B.C. coast
Photo: UBC-DFO Research Cruise
Steller sea lions breed along the North Pacific Rim. Two distinct populations are recognized: a western population that breeds in Russia, the Aleutian Islands and Gulf of Alaska, and an eastern population that breeds in Southeast Alaska, British Columbia, Oregon and north-central California. DFO has conducted aerial surveys every two to five years since the early 1970s to monitor populations in B.C. Since 1994, the DFO surveys have been coordinated with agencies in Alaska, Washington, Oregon, California and Russia to obtain range-wide abundance estimates.
Surveys are flown in late June – early July to coincide with the end of the pupping season. Most pups have been born by this time, but they are still too young to have left the rookeries, so the surveys provide an estimate of total annual pup production. Haul-out sites used by non-breeding animals are also surveyed. Although some non-pups are at sea and missed during surveys, the surveys provide information on the relative distribution of animals and importance of haul-out sites.
The B.C. surveys indicate an increasing trend in both pup production and non-pup counts since the early 1970s, with most of the increases taking place since the 1980s. Abundance of Steller sea lions has also increased in SE Alaska, Washington and Oregon. Because the largest rookeries are situated near the B.C. – SE Alaska border, its difficult to separate populations in these two regions, but both show increasing trends. Indeed, the combined abundance of Steller sea lions in B.C. and SE Alaska has increased about four-fold since the species was protected in the early 1970s.
Although province-wide surveys in B.C. were not initiated until the early 1970s, there are counts for breeding rookeries dating back to the early 1900s. Recent surveys indicate that a fairly constant proportion of the total population occurs on rookeries, so the historic rookery counts probably provide a fairly good index of overall population trends. The historic counts indicate that abundance of sea lions in B.C. in the early 1970s had been reduced to about 25-33 percent of the number present when the first surveys were conducted in 1913. The declines can be attributed to predator control programs and experimental harvests. Approximately 55,000 Steller sea lions were killed in B.C. during 1912-1968. These kills eradicated a rookery on the Sea Otter Group off the central B.C. coast, and reduced numbers on the remaining three rookeries.
The recent increases in B.C. and neighbouring waters represent the recovery of populations that had been depleted prior to being protected in the early 1970s. The species has resumed breeding on the Sea Otter Group, and by 2006 sufficient numbers of pups were born to re-classify it as a rookery. In recent years, Steller sea lion populations in B.C. and SE Alaska appear to exceeded peak historic levels, and the reason for continued increase is unknown. In 2002, the total eastern Steller sea lion population was estimated to number 46,000-58,000, 34 percent of which breed on the B.C. coast.
2.1.8 Abundance of Eastern Arctic Bowhead Whales
Larry Dueck

Bowhead whale at the surface
Photo: Larry Dueck
The abundance of bowhead whales is notoriously difficult to assess. Not only do they have a widespread distribution, they occur in relatively low densities, tend to spend a majority of their time out of sight beneath the surface of the water, and are often difficult to detect due to their dark colouration. Surveys need to be conducted in as short a timeframe as possible and can be further complicated by weather and visibility conditions, such that significant portions of the survey area are ultimately missed.
Previous surveys of bowhead whales in the eastern Arctic covered only small fractions of their known range due to the costly nature of aerial surveys and tended to differ significantly, likely due to factors of differing coverage and survey conditions. Earlier surveys also underestimated the numbers of whales, since they typically did not correct for submerged animals. Information on bowhead behaviour, specifically time spent below the surface, was not yet known at the time.
A major effort to survey was possible in 2002-2004, with the help of funding from the Species at Risk program. To obtain the best possible information, aerial surveys were conducted from Twin Otter aircraft with two observers on each side of the aircraft. This “double-observer” approach allows a more complete estimate of the number of animals as it allows researchers to document which whales were seen by the front observer and missed by the rear observer, and vice versa. Knowing the rate at which observers miss animals provides the ability to estimate the overall proportion of animals missed (because they were below the surface) is also essential to the calculation of the abundance of whales.
The analysis of this data, including correction for missed animals and animals below the surface, indicates that the abundance of bowhead whales for the eastern Arctic lies somewhere between 4,800 and 43,000 whales, with a mean estimate of 14,400 whales. Although we cannot know precisely where within this range the actual number lies, the estimate indicates that the numbers are larger than previously thought and provides quantitative support for the claims of Inuit in many communities that numbers have increased in recent decades.
Footnote: A recent review by an IWC Scientific Sub-committee suggested that the above estimate may be biased upwards. A review is underway to address those concerns.
2.2 Identifying Population Structure Using Molecular Genetics
2.2.1 Distinguishing East Hudson Bay vs. West Hudson Bay Belugas Using Molecular Markers
Lianne Postma
The definition of beluga stocks in Hudson Bay and elsewhere in Canadian waters has relied heavily on genetic information. This information has been used to discriminate among summer aggregations of beluga that share maternal lineages. Early analyses of this data supported the identification of at least two stocks of beluga in Hudson Bay, generally referred to as the East Hudson Bay and West Hudson Bay stocks. These stocks are thought to interbreed on wintering grounds in eastern Hudson Strait/Baffin Bay.

Examining DNA profiles in the lab
Photo: Denise Tenkula, Melissa Lindsay and Robert Bajno
The definition of beluga stocks in Hudson Bay and elsewhere in Canadian waters has relied heavily on genetic information. This information has been used to discriminate among summer aggregations of beluga that share maternal lineages. Early analyses of this data supported the identification of at least two stocks of beluga in Hudson Bay, generally referred to as the East Hudson Bay and West Hudson Bay stocks. These stocks are thought to interbreed on wintering grounds in eastern Hudson Strait/Baffin Bay.
The samples were collected from local harvests and are a mixture of migrating animals and summering animals. The first step is to identify the number of stocks in the population by isolating the summer samples. The next step is to look at the samples from migrating animals and perform a mixed stock analysis to quantify the proportions of animals from the summer stocks that make up the harvest.
Preliminary results from these analyses indicate that there are more than two stocks of beluga in Hudson Bay. There is also strong evidence that samples taken from James Bay represent a separate population of beluga that are not interbreeding with beluga harvested at other locations in Hudson Bay and Hudson Strait.
2.2.2 Molecular Genetics for the Identification of Stocks of Narwhal in Nunavut
Lianne Postma

Small group of narwhal in open water
Photo: Larry Dueck
Results of narwhal genetics analyses for samples collected in the eastern Canadian Arctic between 1982 and 2001 revealed that there was weak differentiation of narwhal stocks in the High Arctic. It was also concluded that the choice of markers should have been sufficient to reveal stock differences.
Recent work with beluga and walrus has focussed on increasing the amount of genetic information used to examine stock differences and migration patterns. This has been increasing the power of statistical analyses and has been very informative for these species.
Over the last few years, analytical approaches have changed drastically. Recently developed, more powerful methods are able to more rigorously identify population structure, quantify gene flow, provide information on the importance of current migration relative to historical associations among populations, as well as demographic information on population history, growth and variability. These types of information are critical for the development of management plans and recovery plans for endangered stocks.
These methods come with limitations, including a large amount of computational power and the need for large data sets. In this project the number of relevant samples analyzed was expanded to 20 micro-satellite markers to increase the amount of genetic information available. The focus is on analyzing 50 samples from each of the four locations – Repulse Bay, Pond Inlet, Grise Fiord and Kikitarjuaq. Results are pending for this study.
2.2.3 Patterns of Genetic Differentiation in Bowhead Whales from the Eastern Canadian Arctic and Western Greenland
Lianne Postma

DFO researchers tagging bowhead whale from a boat
Photo: DFO
Biopsy samples from bowhead whales were collected from animals in Nunavut, Canada and western Greenland and were analyzed for 34 nuclear DNA micro-satellite loci. Individual sample sizes were eight for Pelly Bay, 143 for Igloolik, 16 for Repulse Bay, 82 for Pangnirtung and 80 for Disko Bay.
Results may indicate stock structure but it could also be the result of a number of factors such as inbreeding, non-random mating, natural selection, bottleneck effects from severe population decline due to commercial whaling, or data-scoring errors. An Analysis of Molecular Variance (AMOVA) revealed significant differences in allele frequencies among samples from different years at each location. These results are most likely influenced by sample sizes and the variation in the sample sexes and ages in the collection from year to year.
The molecular genetic evidence from micro-satellite analyses of bowhead samples from Baffin Bay-Davis Strait and Hudson Bay-Foxe Basin areas does not provide strong support for two distinct populations. This conclusion is supported by the results of satellite tracking studies showing extensive movements of bowheads between these two areas. However, the genetic differences that were detected and limited information on sex and age class segregation among the sampling locations indicate that there is some structuring of bowheads throughout their range that may have management implications for this population.
2.3 Reproduction and Mortality
2.3.1 Condition-Dependent Male Mating Tactics in the Grey Seal: The Importance of Body Size
Don Bowen

Male grey seal fight stalemate
Photo: Don Bowen
Grey seals are size dimorphic, with males being 1.5 times larger than females. In dimorphic species, larger males are often thought to have an advantage in obtaining mates. This study examined the importance of body size and body composition as determinants of mating tactics exhibited in males. Behavioral observations, along with measures of energy expenditure and reproductive success, were obtained from 42 known-age individuals during the breeding seasons of 1997–2001 at Sable Island, Canada.
Males with a large body mass arrived at the breeding grounds with more body fat and body energy and spent less body protein than smaller males. Males with a smaller percentage of body fat had higher rates of food intake. The amount of body energy on arrival was positively correlated with the duration of the breeding period. Males that exhibited the primary mating tactic of defending females were heavier, had absolutely more body fat and body energy, and sustained breeding longer than those males that did not exhibit the primary tactic. Amongst all males, intermediate-sized males mated with the most females and achieved the highest success. Intermediate body size may be optimal during breeding due to greater agility in male combat.
2.3.2 An Evaluation of Steller Sea Lion Pup Counts from 35mm Oblique Images
Peter Olesiuk

Steller sea rookeries are photographed while circling at steep angles and the small, dark pups counted from high-resolution 35mm images
Photo: Peter Olesiuk
For many pinnipeds, including Steller sea lions, counts of pups provide the best method for tracking population trends and estimating abundance. Other age-classes tend to be widely distributed, and an unknown proportion is at sea and missed during surveys. In contrast, pups are born at traditional rookeries, and confined to land for the first month of life. Censuses of breeding sites can thus provide estimates of total pup production, and population models used to extrapolate total population size.
Steller sea lion pups are difficult to count from boats or aircraft. They are dark and small, tend to blend in with the substrate, and can be hidden behind rocks, other animals or in crevices. Traditionally, pup counts have been made by landing people on rookeries at the peak of the breeding season, driving non-pups into the water, and walking through the rookery and tallying the number of pups present. These drive-counts are highly disruptive, displacing bulls from their breeding territories, and separating young pups from their mothers or chasing them into the ocean. In one study that monitored changes in the rookery before and after drive-counts, a third fewer females maintained contact with pups following the disturbance.
In British Columbia, aerial surveys have been used to monitor Steller sea lion trends since the 1970s. Pups have been counted from oblique 35mm photographs taken as aircraft circled the rookery. While aerial surveys avoid the disturbance associated with ground drive-counts, there has been some concern over the accuracy of counts made from the air. In the 1990s, DFO researchers teamed-up with scientists from Alaska Department of Fish and Game (ADF&G), National Marine Mammal Laboratory and Southwest Fisheries Science Center to compare and calibrate counting techniques for Steller sea lion pups. During 1994-1998, DFO flew surveys at Forrester Island in SE Alaska – where more pups are born than anywhere else – a day or two before ADF&G conducted drive-counts on the ground. The comparison indicated that while the aerial and ground counts were highly correlated, about 20 percent of the pups were consistently missed in the oblique 35mm photographs.
In subsequent study, it was found that vertical medium-format images taken from belly-mounted cameras provided counts that were statistically indistinguishable from ground drive-counts. In 1998 and 2002, rookeries in B.C. were surveyed using both vertical medium-format and oblique 35mm photography. Counts using each method were highly correlated, but a small number (four percent) of the pups were missed in the oblique photographs. Its believed that a smaller proportion of pups were hidden and missed in the oblique photographs on the B.C. rookeries than on Forrester Island because the B.C. breeding sites tend to be smaller or spread along beaches, such that they can be flown and photographed at more acute angles. Based on these studies, a small correction (1.05) is now applied to the oblique 35mm pup counts in B.C. to adjust for hidden animals. All agencies in North America have now adopted aerial photography to census Steller sea lion pups, greatly reducing the level of disturbance caused by researchers.
2.3.3 Life History and Population Dynamics of Northern Resident Killer Whales in British Columbia
Peter Olesiuk, Graeme Ellis and John Ford

Resident killer whales remain in natal groups for life and travel as a cohesive unit
Photo: John Ford
Killer whale population studies and photo-identification techniques were pioneered in the early 1970s by the late Dr. Michael A. Bigg. Despite the early skeptics, Mike quickly learned that each whale could be recognized from unique natural markings, and recognized that photo-identification was a powerful tool for long-term population studies. Before his premature death in 1990, he left us with two seminal papers that would chart the course for the next generation of whale researchers. The first paper on social organization and genealogy showed that resident killer whales of both sexes remain in their natal groups for life, and described the genealogical relationships among individuals within each of the matrilineal groups of resident whales on the B.C. coast.
This paved the way for a second paper on life history and population biology of resident killer whales. Using sophisticated numerical techniques, much like an actuary would use to calculate insurance risks; age-specific life history parameters were derived from the long-term sighting records, and incorporated into life tables and matrix projection models. The models indicated that killer whales were much longer-lived and slower-reproducing than previously believed. Females typically mature at 14 years of age, produce an average of five calves over a 25 year reproductive lifespan, but may live to about 80 years of age. Males reach sexual maturity at 13 years of age, but aren't physically mature until 18 years of age, and may live as long as 60-70 years.
The photo-identification surveys have been continued annually, and the records of births and deaths in the resident killer whale populations now extends over three decades. This long-term study has provided a rare opportunity to assess how the killer whales have faired through both favorable periods of population growth and less favorable periods of population decline. Interestingly, it's been found that population status is driven mainly by changes in survival rates, with reproductive rates remaining fairly stable. The stability of reproductive parameters may be due to the very limited reproductive potential of females, who only produce an average of five calves over their lifespan. Even more interesting, animals of both sexes and all ages exhibited elevated mortality rates during less favorable periods when populations declined. In most other species the young and inexperienced animals, or the old and feeble animals, are most vulnerable during less favorable periods. The pattern in killer whales may be explained by the fact that, unlike other species, animals of both sexes and all ages travel as a cohesive unit in their natal pods, and experience the same conditions and suffer the same prey shortages.
2.4 Role of Disease in Marine Mammal Populations
2.4.1 Diseases of Importance to Wild Marine Mammal Populations
Lena Measures

Ferret PDV histology slide
Photo: Lena Measures
The most significant pathogens causing massive mortalities in marine mammal populations worldwide are morbilliviruses such as phocine distemper virus (PDV) infecting pinnipeds, and cetacean morbillivirus (CMV) infecting cetaceans. PDV is responsible for mortalities estimated at 20,000 harbour seals and several hundred grey seals in Europe in 1987-1988 and in 2002. CMV has killed dolphins in Europe and in the eastern USA but mortalities appear to be more limited in number. PDV is prevalent in Canadian pinnipeds including harp and grey seals, which are believed to be reservoirs for the virus. The absence of large scale mortalities in Canadian pinniped populations from PDV is believed to be due to natural herd immunity.
A few mortalities due to PDV have been reported in harbour seals in the New England area, the most recent being in 2006-2007. Only one harp seal in Canadian waters has been reported dead of PDV. Antibodies against PDV have been detected in Canadian pinnipeds as early as 1972 but the virus has not been isolated from Canadian pinnipeds despite recent efforts, nor have studies on its pathogenicity and pathogenesis in harp or grey seals been conducted. Recent studies by Ole Nielsen and Lena Measures of DFO, and collaborators at the National Center for Foreign Animal Disease, Canadian Food Inspection Agency, and the University of Montréal, examined a new method to isolate and characterize an isolate of PDV from the 1988 seal epizootic in Europe using experimentally infected ferrets. A stable transfected Vero cell line (Vero.DogSLAMtag) expressing canine “signalling lymphocyte activation molecules” (SLAM) or CD150 receptors offered faster viral replication resulting in primary viral isolation in a shorter period of time, with higher yield of virus compared to traditional cell culture methodologies (Vero and primary seal kidney cells).
A reverse transcriptase polymerase chain reaction (RT-PCR) test was developed to detect a portion of the nucleocapsid gene found only in PDV. This RT-PCR methodology was used to confirm the identity of the virus that was subsequently isolated from the ferrets. Viral isolates from the infected ferrets as well as cultures of virus originally isolated from a dolphin and a porpoise and maintained in Vero cells also replicated faster and produced higher titres of virus when propagated in Vero.DogSLAMtag cells.
2.4.2 Zoonotic Diseases of Marine Mammals
Lena Measures

GiardiaTrophozoites
Photo: L. Measures and A. Applebee
Giardia and Cryptosporidium are protozoan parasites known to cause enteric disease in terrestrial wildlife species and are also zoonotic - able to infect humans. Recent studies have reported cysts of Giardia in the faeces of Canadian pinnipeds from the western Arctic and the east coast of Canada. The objective of this new study conducted at the Maurice Lamontagne Institute with Lena Measures by Amber Applebee as part of her doctoral research at Murdoch University, Perth, Australia was to determine the prevalence and genotype of Giardia and Cryptosporidium in two species of pinnipeds, harp seal (Phoca groenlandica) and hooded seal (Cystophora cristata), from the Gulf of St. Lawrence.
Faecal samples were collected from pup and adult seals and examined for the presence of cysts of Giardia and oocysts of Cryptosporidium using microscopy and immunofluorescent staining. Tissues from the small intestine of adult seals were also collected and examined for infections using the polymerase chain reaction (PCR) technique. Giardia cysts were found in faeces of 42 percent (16/38) of adult harp seals, but in none of the harp seal pups (0/20). Although Giardia cysts were not detected in faeces of adult hooded seals (0/10) using microscopy, 80 percent of their intestinal tissues were infected with Giardia using the PCR technique.
Both harp and hooded seals harbored infections with the zoonotic strain, Giardia duodenalis Assemblage A, as determined using a two-step nested PCR technique to amplify a small subunit ribosomal (SSU-rRNA) gene of Giardia. Cryptosporidium was not detected using microscopy nor the PCR technique on intestinal tissues from any of the 68 seals examined. Trophozoites of Giardia were observed on histological sections of intestinal tissues from harp and hooded seals confirming that Giardia was excysting and developing in seals.
2.4.3 Marine Mammal Strandings and Mortality Events – Monitoring and Investigations
Lena Measures

Live stranded pilot whale
Photo: Lena Measures

Beluga whale necropsy
Photo: Lena Measures
A monitoring and necropsy program on the threatened St. Lawrence Estuary (SLE) beluga population has been conducted since 1982. An average of 15 mortalities are reported annually with 3 to 12 carcasses transported to the University of Montreal, Faculty of Veterinary Medicine for a complete necropsy to determine cause of death and collect tissues for a variety of research projects investigating the health, diet, and chemical contaminants in stranded animals from this population. In 2006 and 2007, 11 and 17 mortalities were documented with three and ten necropsies performed, respectively.
Recent work with Michel Lebeuf at DFO has shown that some contaminants in tissues of SLE beluga are declining while new ones are being detected. For the period 1983 to 2007, 365 mortalities have been documented. Of 148 carcasses (all sexes and ages combined) sufficiently fresh for necropsies from 1983 to 2002, infectious etiology (bacterial and parasitic infections) caused 38 percent of deaths, terminal neoplasia or cancer 15 percent with almost 30 percent dead of unknown causes. In stratifying the age groups, 58 percent of calves (<1 yr) died perinatally, 81 percent of juveniles (one to ten or 14 yr based on sex) died of infectious etiology (56 percent due to verminous pneumonia) and 32 percent of adults (>10 or 14 yr based on sex) died of infectious etiology. Terminal neoplasia was only seen in 22 adults (18 percent) with a mean age of 33 yr (range 22 – 59) (GLG/1 yr).
An overview of the SLE beluga population entitled “What's killing the white whales of the St. Lawrence” is available as part of the DFO Science Feature Articles at www.dfo-mpo.gc.ca/science/Story/feature_e.htm. Despite the implementation of various protective management measures, an apparent absence of predators such as killer whales, and enforcement of environmental regulations on toxic chemicals, the population has failed to rebuild. This article discusses the importance of disease in this population, particularly chronic diseases such as cancer affecting animals that can live to be over 80 years old.
3.0 How Marine Mammals Fit Into the Ecosystem
3.1 Distribution
3.1.1 Arctic Killer Whale Information from Traditional Ecological Knowledge and Sighting Networks
Steve Ferguson
Male killer whale
Photo: John Ford
Killer whale sightings in the eastern Canadian Arctic have increased in recent years, especially in Western Hudson Bay, and have shown a recent advance in distribution with climate change. However, little else is known about their distribution and ecology.
The Orcas of the Canadian Arctic (OCA) project was initiated in 2005 as a collaboration with universities, provincial, territorial and federal government, industry, consulting companies and Inuit organizations. A study on killer whales in the Canadian Arctic was initiated in 2006, and has continued through 2007 and 2008, to monitor killer whales in this region.
Inuit traditional knowledge of killer whales has been collected since August 2007; initial efforts focused on the Hudson Bay region. To date, interviews have been conducted in five communities: Repulse Bay, Igloolik, Hall Beach, Rankin Inlet, and Arviat. Additional interviews are planned for 2008 through 2010. Interviews thus far have provided a wealth of local knowledge on Arctic killer whales, including distribution, migration and movement patterns, seasonality, and predation impacts on other marine mammal species.
At the same time, a sightings database has been created and has been evaluated for general sighting reliability, with a combined focus on species identification, observer type, and spatial and temporal accuracy. A photographic database is also in development, which will allow for the identification of individual killer whales.
3.1.2 Traditional Ecological Knowledge and Western Science
Mike Hammill
Traditional Ecological Knowledge (TEK) can be defined as the knowledge claims of persons who have a lifetime of observation and experience, but are untutored in the conventional science paradigm. The use of TEK and its integration with science is prompted by many because it reflects the resource use and long observational experience of local people, and because it can provide a longer historical record than scientific data in remote areas. In contrast, western science relies on an experimental approach and hypothesis testing to obtain information on natural processes.
Tagged beluga whale
Photo: Véronique Lesage
TEK and science differ in the ecological information they provide, both in observational intensity and geographic coverage. These differences may lead to separate conclusions about the seasonal distribution and aggregation of beluga populations and thus influence management decisions. To date, few studies have been attempted to analytically compare and contrast the two data sets. The collation of TEK into a structured format for review to understand the strengths and weaknesses remains a challenge for both scientists and the holders of TEK alike.
In this study, information on movements and aggregation of beluga whales were obtained from TEK interviews with 427 hunters resulting in 3,253 records maintained in a database by Makivik Corporation, Kuujjuaq, QC. Satellite transmitters were deployed on 30 beluga whales in eastern Hudson Bay, Canada. Seasonal distribution and movements were compared using GIS approaches that allowed common formatting of the datasets.
Estuarine centres of aggregation in the summer were evident in both datasets (Fig. 4). The telemetry data showed that beluga made extensive use of offshore waters where 76 percent of the locations were greater than 15 km from mainland Quebec. However, these offshore movements were not evident in the TEK data, where 83 percent of the records indicated that beluga were limited to inshore regions. The telemetry data also showed that beluga whales remained within the Hudson Bay arc region throughout the summer, but left this area to overwinter off the coast of Labrador. The TEK data reported the presence of beluga all around the coast of Nunavik throughout the summer and also the presence of beluga whales in the Hudson Bay arc region during winter.
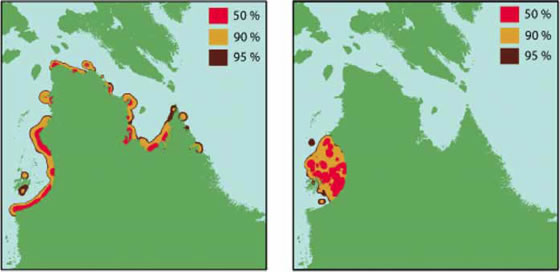
Figure 4. Home ranges in summer. Home range calculations of 50 percent, 90 percent, and 95 percent probability for TEK data, telemetry data using locations from 30 whales. a) summer TEK; b) summer telemetry.
Results from the two approaches underline the importance in understanding how the data are collected. Both approaches represent different sampling methods that have both strengths and weaknesses. The satellite telemetry provides independent information on whale movements, particularly of whales of known origin; in this case of whales from the eastern Hudson Bay (EHB) population. However, the deployments are relatively few (n=30) and on average, the transmitters are lost from the animals after about three-four months. The TEK observations cover a longer period of time and a larger area, but observations are largely coastal because it is dangerous to hunt offshore in small boats. The TEK data also failed to detect the overwintering off the Labrador coast because of the difficulties in winter travel, the short days, and the large area that beluga whales moved through.
However, TEK detected that some whales overwintered in the EHB area. Where do these whales come from? Do some whales from the EHB population actually overwinter in this area as well? Or do the overwintering whales belong to another population that summers elsewhere-from James Bay for example? The TEK data also indicated that some beluga are found all along the Nunavik coast during summer. Are these whales that are observed in the Hudson Strait area in summer just stragglers from the migrating populations that exit Hudson Strait in summer? Or, do they represent some other remnant population that summers in this area?
From this study, it is evident that both data sets can provide complementary information and when this information is in agreement, conclusions are likely to be more solid. However, when the different approaches lead to different conclusions, it is important to understand why these differences exist. In most cases this involves a clear understanding of the different sampling methods that are employed, their strengths and their weaknesses.
3.2 Habits
3.2.1 Diving Characteristics and Sightability Estimates of Eastern Arctic Bowhead Whales Based on Satellite-Linked Telemetry
Larry Dueck

Bowhead and beluga surface in a polynya
Photo: Steve Ramsay
Bowhead whales in Canada consist of two populations, one that summers in the Beaufort Sea in the western Arctic, and one that resides in waters of the eastern Canadian Arctic and west Greenland. The eastern Arctic population was once considered to be two unique populations. However, recent evidence strongly suggests that they belong to a single population, likely segregated seasonally by age and reproductive class. The strongest evidence for this conclusion is the result of satellite-linked tracking.
The tracking and monitoring of whale behaviour with satellite-linked and data-archiving tags has provided an important window of opportunity to document what was previously unattainable for such an elusive and remote species. The tracking of long-range movements of bowhead whales has demonstrated that these whales, once thought to maintain two discrete ranges, actually share both summering and wintering areas. Analysis of movements and identification of seasonal residency have provided new information on migration routes, new insight into life history, and the potential importance of particular habitat.
Using the latest satellite-linked telemetry technology, tagged animals have also provided information on dive behaviour, demonstrating that bowhead whales can dive to depths of 400 meters. Among the valuable information provided by examination of diving behaviour, the proportion of time spent out of sight is important when estimating the abundance of bowhead. It turns out that bowhead whales spend close to 75 percent of their time at depths greater than four meters.
3.2.2 Ringed Seal Ecology
Steve Ferguson
Ringed seal
Photo: J. Blair Dunn
Ringed seals contribute to the bulk of the Inuit subsistence harvest of marine mammals and are the main food resource for polar bears. The evolutionary adaptations of ringed seals to exploit the land-fast ice habitat for reproduction and survival could expose this species to critical challenges with predicted global warming. Concerns have arisen over possible declines in ringed seal numbers in western Hudson Bay, as indicated by hunter knowledge, reduced pregnancy rate, reduced pup survival, older age structure, and reduced growth and number of polar bears. Four aerial surveys that took place from 1995-2000 estimated the population size as declining from 70,000 to 45,000 seals.
An aerial survey was conducted in May 2007 and capture and tagging of ringed seals was conducted in September 2007. The goal of the field work was to collect samples and tag seals, in order to better understand ringed seal movements and foraging ecology in Hudson Bay. Satellite tagged seals will provide information on how often seals are not visible from planes and thereby allow correcting the aerial survey estimates. Basic biological information, such as condition and morphology, as well as samples from seals, both live and dead, were also collected.
3.2.3 Development of PAM Methodology to Non-Intrusively Monitor Whales in their Environment with Examples from the St. Lawrence Seaway and Arctic
Yvan Simard
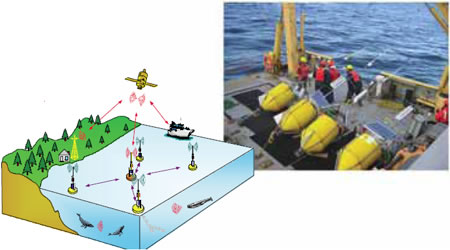
Figure 5. The WOW satellite and radio-linked intelligent buoy network for real-time localizing whales from PAM (photo: Yvan Simard)
Marine mammals intensively use underwater acoustics to communicate, navigate, and detect prey and predators. Like birds, many species and sub-groups can be identified by their specific calls. Recording these signature calls then reveals the presence of the species in the monitored area. As sound propagates very efficiently in water, the detection area can be quite large, exceeding 100 kilometres in favourable conditions for low-frequency vocalizations. This surpasses visual detection ranges by a large factor. Thus, marine mammal scientists from various disciplines have worked for several decades to harness this acoustic potential to non-intrusively detect and monitor whales in their environment. With the rapid development of knowledge and technology in this field a new methodology, named PAM (Passive Acoustic Monitoring), is emerging (Fig. 5).
Various PAM systems have been used throughout the world, ranging from simple recording systems and a single hydrophone thrown overboard to large-scale shore-cabled military systems to hear entire ocean basins. In collaboration with the University of Quebec at Rimouski, a research program was launched in 2002 to develop and explore PAM systems to monitor whales in the St. Lawrence Estuary.
After developing an autonomous hydrophone, called AURAL, to record audio files, a fleet of them was deployed in the Saguenay-St. Lawrence Marine Park during the summers of 2003-2005 to explore the possibility of different configurations to detect and localize blue and fin whale calls. Several localization methods were explored to find the position of the whales in the 75-km long basin. Despite the particular difficulty of the study area, propagation modeling was combined with noise characteristics to show that the technology can detect and localize blue and fin whales from their calls, with a high efficiency. A study is ongoing to monitor the local beluga population.
The plan for the next generation of these systems is to operate in real-time and have artificial intelligence to automatically solve the detection and localization of the calls. Additionally, a three-year research project to develop a network of cooperating intelligent buoys has been conducted. This system will be tested in the field in coming years. In the meantime, AURALs were deployed at several locations in the Arctic and Hudson Bay in 2004 to monitor the changes in the timing of seasonal occupation of bowheads, beluga, and bearded seals. Results are starting to reveal clear relations with changes in ice conditions.
3.3 Foraging Ecology and Diet
3.3.1 Sex Differences in Habitat Use, Feeding Frequency and Diet in Grey Seals
Don Bowen
Adult male (background) and female (foreground) grey seal showing sex difference in body size
Photo: Don Bowen
Many animal species segregate by sex. Such segregation may be social in nature, or ecological, or both. Grey seals, like many large mammals, as sexually size dimorphic. To investigate sexual segregation of habitat in grey seals, satellite tracks from 95 adults breeding at Sable Island were collected from 1995-2005 (Fig. 6). Differences were most pronounced just before (October-December) and immediately after (February-March) breeding. During both periods, males primarily used areas along the continental shelf break, while females mainly used mid-shelf regions. These differences may serve to maximize fitness by reducing intersexual competition during key foraging periods.
Season and sex explains most of the observed variation in adult diets. Estimates of diet were derived from the analysis of fatty acids (the building blocks of fat) in blubber biopsies taken from free-ranging individuals using a method called quantitative fatty acid signature analysis. The differences were most evident during the post-breeding foraging period when energy acquisition is important to female recovery of nutrient stores needed to support pregnancy. Females selected fewer and higher quality prey species in spring than males. There were no sex differences in the diets of juveniles.
The frequency of feeding in seals has traditionally been inferred from the state of digestion of prey in stomach contents. These estimates are rather imprecise and may not be representative of entire foraging trips to sea. In a new study, small radio transmitters were placed in the stomachs of adult grey seals. These transmitters continuously recorded changes in stomach temperature associated with feeding. The results showed that the number of feeding events is typically greater in males than females, as is the time associated with feeding per day. Seals, on average, fed on 57.8 percent of days, and had an average of 1.7 meals per day. Grey seals tended to have many single feeding events with long periods separating each event, as was expected for a large carnivore. These results provide new insight into the basis of sex differences in diving and diet.
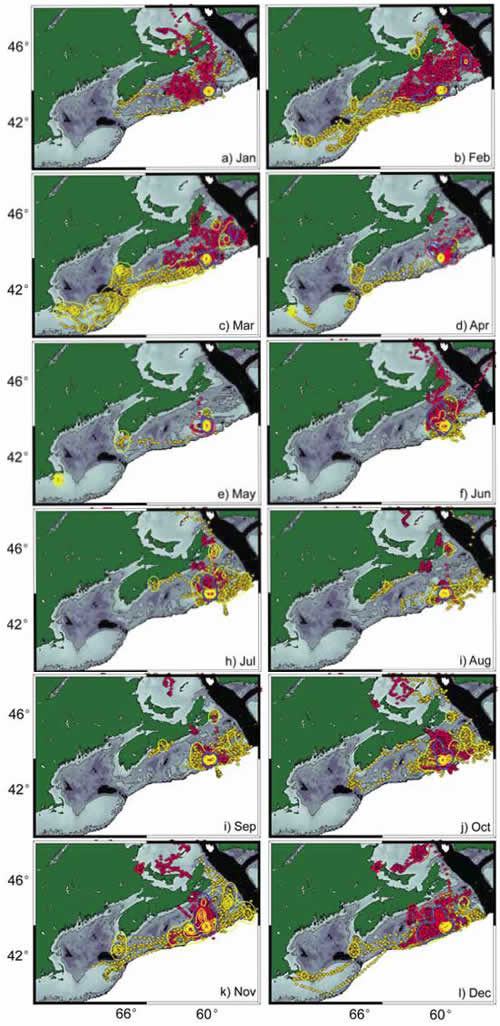
Figure 6. Monthly distribution of adult male (yellow) and adult female (red) grey seals based on satellite location from Argos. Solid lines enclosing areas are kernel densities indicating areas of high use.
3.3.2 Diet of Harp and Hooded Seals
Garry Stenson
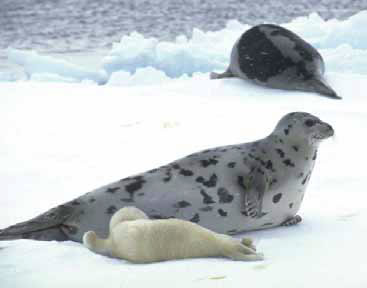
Harp Seal female and pup
Photo: DFO
Hooded seal family
Photo: Mike Hammill
Harp and hooded seals are two of the most abundant marine mammals in the North Atlantic. As such, both species play important roles in structuring this ecosystem. Considerable research has been carried out over the past decade to determine their ecological role and the potential impact of seal predation on the population dynamics of their prey. However, these are extremely complex problems and definitive answers are not easy to determine.
The development of satellite telemetry has provided scientists with the opportunity to improve their understanding of the movements and habitat use of free ranging seals. Both harp and hooded seals are pelagic species that spend much of their time in the open ocean. Harp seals are found mainly along the continental shelves where they dive to relatively shallow depths (100-200m) although they have been observed diving as deep as 800m. In contrast, hooded seals inhabit the edges of the continental shelves and deep water slopes. Hoods regularly dive to depths greater than 300m and, occasionally, deeper than 1500m.
Both species feed on a variety of fish and invertebrates. The exact diet varies with age, sex, location, season and year. In general, harp seals feed upon a variety of small forage fish such as capelin, Arctic cod (or Polar cod in Europe, Boreogadus saida), herring and sand lance. They also prey upon invertebrates such as amphipods and shrimp. Although hooded seals feed on many of the same species, they tend to take larger amounts of deep water species such as Greenland halibut and redfish which are found along the shelf edges.
Traditionally, diets have been determined using hard parts found in the stomachs. However, every method has potential biases that may reduce the accuracy of diet estimates. New techniques such as fatty acid signatures and DNA analysis of stomach contents are providing new information on the diets over longer temporal and spatial scales. They are also providing new insights into the importance of individual prey species consumed by harp and hooded seals, and provide an opportunity to determine the extent of biases associated with each method.
Consumption of important prey species by seals in Atlantic Canada has been estimated using bioenergetics models. Harp seals are important predators off the east coast of Newfoundland and in the northern Gulf of St. Lawrence while hooded seals feed primarily off Newfoundland and around the Flemish Cap.
A number of studies have attempted to determine the impact of seals on fish stocks in the northwest Atlantic, particularly the impact of harp and/or grey seals on Atlantic cod. In general, these studies have indicated that although seals consume substantial amounts of commercial fish species and important forage species, the impact of these removals on the current fish stocks is difficult to determine. Seals are important predators of both large and small cod and could be playing a role in the non-recovery of cod stocks, but seal predation can not account for a large component of mortality in most areas and therefore, the total impact of seal predation cannot be determined. Often, estimates of age specific cod consumption by seals are inconsistent with the high mortality observed among older age groups. Little is known about the functional response of seals to changes in abundance of prey, other sources of mortality, or possible ecosystem effects such as competition for forage fish and positive feedback through seal predation on piscivorous fish.
3.4 Predator-Prey Interactions
3.4.1 Report from National Workshop on the Impacts of Seals on Fish Populations in Eastern Canada
Don Bowen
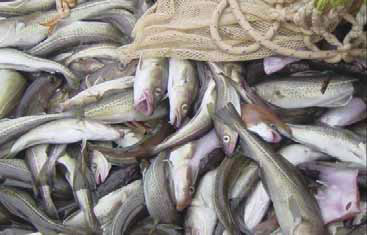
Atlantic cod captured in a trawl
Photo: DFO
A five-day day meeting was held in November, 2008, in Halifax, Nova Scotia, on topics related to the potential impacts of seals on fish stocks in Eastern Canada. Seals are hypothesized to have five kinds of negative natural effects on prey populations:
- predation,
- competition,
- transmission of parasites causing increased mortality of fishes,
- disruption of spawning, causing reduced reproductive success, and
- other indirect effects on fish behaviour caused by risk of seal predation. This was the second of two workshops and presentations focussed on new analyses and model results arising from research identified at the first workshop. The second meeting was attended by 30 invited participants from Canada, Norway, and the United States of America. Members of the fishing industry, graduate students from Dalhousie University, and interested scientists from the Bedford Institute of Oceanography also attended parts of the meeting. The principle objective of these workshops was to review what is known, identify gaps in our understanding, and determine what could be concluded about the impacts of seals on fish stocks in eastern Canada. A report of the meeting will be completed early in 2009.
3.4.2 The Importance of Grey Seal Predation on Cod
Don Bowen
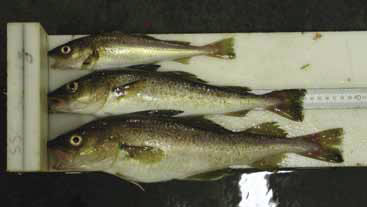
Various size classes of Atlantic cod
Photo: Tom Hurlbut
The continental shelf ecosystem of the Eastern Scotian Shelf has experienced drastic changes. Once-common top predators are now a small fraction of their historical abundance, and much of the current community structure is now dominated by pelagic fishes and invertebrates. Within this food web, Atlantic cod and grey seal populations have exhibited opposite trends. Since 1984, cod populations have decreased exponentially at a rate averaging 17 percent per year. At the same time, grey seals have continued to increase exponentially, at a rate averaging 12 percent.
The impact of grey seals on Atlantic cod dynamics was re-examined using more than 30 years of data on the population trends of cod and grey seals, and incorporating new information on seal diet and seasonal distribution. The closure of the cod fishery over ten years ago allowed for a better estimation of natural mortality rates.
Between 1993 and 2000, cod comprised, on average, approximately two percent of a grey seal's diet. Since the closure of the fishery, grey seals have imposed a significant level of instantaneous mortality, 21 percent of the total mortality on average. However, most of the natural mortality on cod during this period was from unknown sources. Nevertheless, given that cod abundance declined during the study, grey seal consumption of cod did contribute to the failure of the cod stock to recover.
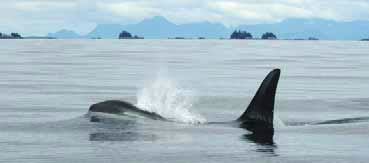
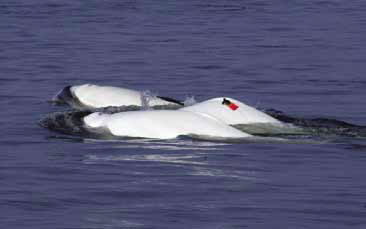
3.4.3 Antipredator Strategies of Baleen Whales
John Ford
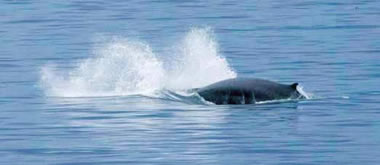
Fin whales can swim at speeds of more than 30 km/hr to escape from pursuing killer whales
Photo: Mark Malleson
Killer whales – the most important aquatic predator of most marine mammal species – have recently been hypothesized to have driven the collapse of populations of seals, sea lions, and sea otters in the North Pacific. This hypothesis maintains that industrial whaling of large, baleen whales in the 20th century eliminated this source of preferred prey of mammal-hunting killer whales, which forced these predators to switch to alternative prey species. This idea has not been widely accepted for various reasons, including the lack of evidence that killer whales have ever been a major predator of large, baleen whales. However, this point raises an interesting question – if killer whales do not prey routinely on the great whales, why not?
To better understand the tactics and strategies that baleen whales use to avoid these predators, published reports and unpublished observations of predator-prey interactions involving killer whales and baleen whales were compiled and examined. This study revealed that baleen whales have two distinct and contrasting antipredator strategies when harassed or attacked by killer whales: the fight strategy, where whales group together and physically defend themselves, and the flight strategy, where whales flee at high speed and, if overtaken and physically attacked, make no attempt to defend themselves.
Fight species include bowhead whales, right whales, humpback whales and grey whales, all of which have relatively robust, stocky body shapes and are relatively slow but maneuverable swimmers. These whales typically escape from killer whale attacks by rolling and splashing at the water's surface, and striking at the predators with their tail flukes. In contrast, the flight species – minke whales, sei whales, fin whales and blue whales – all share the same highly streamlined body shape and are fast swimmers. These whales usually escape successfully from pursuing killer whales by fleeing at high speeds of 20-40 km/hr.
Many aspects of the life history, behaviour, and morphology of baleen whales are consistent with their antipredator strategy, and it appears that evolution of these traits has been shaped by selection for reduced predation. For example, fight species often congregate for breeding in shallow nearshore waters, where they are better able to defend themselves and their calves from killer whales. Most flight species seldom enter confined waters that might inhibit an escape sprint. Fight species also tend to have encrustations on their bodies (callosities and barnacles) that may serve as armour or weapons for enhanced defense.
Overall, it seems that these divergent antipredator strategies of baleen whales are highly effective for avoiding predation by killer whales, particularly for adults. As a result, killer whales seldom attack these large whales and focus instead on smaller, easier to catch and more profitable mammalian prey. It seems doubtful that depletion of the great whales by whaling had a significant influence on killer whale dietary habits.
3.5 Marine Mammal Habitat
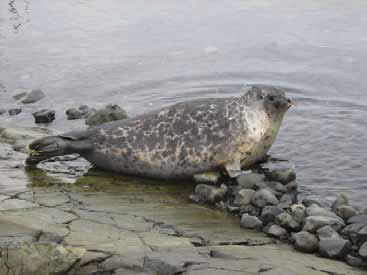
3.5.1 Harbour Seals in Newfoundland and Labrador: New Data
Becky Sjare
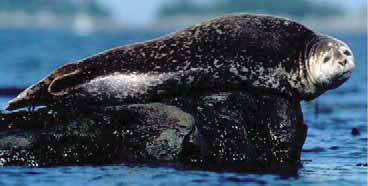
Harbour seal resting
Photo: DFO Quebec
The harbour seal is one of seven pinniped species found in the northwest Atlantic. Although this species is well studied throughout much of its distribution, relatively little is known about the ecology and population status of these seals in Newfoundland and Labrador waters. The objectives of this project were to determine baseline contaminant profiles for harbour seals and their major prey species, collect the necessary ecological data to evaluate if the species might be a good indicator of ecosystem health, and begin considering how to use data for monitoring longer-term cumulative effects of future coastal developments related to offshore oil production.
Based on a limited number of reconnaissance boat surveys, opportunistic shore-based haul-out counts, and interviews with fishermen, harbour seals are relatively common but patchily distributed in low densities. The exceptions are the northwest and northeast coasts of Newfoundland and Labrador where there have been few observations. It appears that local abundance of seals at known haul-out sites along the south and southwest coasts have increased; abundance at more northern sights has remained low.
Generally, harbour seals are known to consume a wide variety of prey and their diet varies geographically, seasonally, and is age dependent. Analyses of stomach samples collected from 1985-2003 indicated consumption of approximately 30 different species of fish and invertebrate prey, but ten species accounted for almost 95 percent. Winter flounder, Arctic cod, short-horned sculpin, and Atlantic cod were the most important.
From 2001-2003, a total of 66 tissue samples were collected throughout the province, and analyzed for total mercury, trace elements, and total persistent organic pollutants (POP) levels. The concentrations of trace elements and total mercury were generally comparable to other northern seal species. Total mercury, selenium, and cadmium showed the greatest variability within, and among, sampling sites; seals sampled along the south and east coasts of the province had the highest concentrations of renal cadmium. The source of cadmium is unknown at this time.
Based on the suite of POPs examined, harbour seals sampled from Newfoundland waters were less contaminated than those from the St. Lawrence Estuary population, and generally similar to those from the southern Gulf of St. Lawrence. Mirex and PCB concentrations were five-ten times higher in the Estuary population while DDT and chlordane were two-five times higher than in Newfoundland seals. Mature males had higher POP levels than females, but there were no differences between the sexes of juveniles.
These new data on harbour seals will provide a basis for future ecological studies, population assessments, development of ecosystem indicators for coastal areas, and research addressing how contaminants accumulate in coastal food chains.
3.5.2 Gender-based Characteristics of Sea Otter Raft Sites
Linda Nichol

Sea otter
Photo: Brian Gisborne
Sea otter aggregations, called rafts, can include over 100 individuals resting as a group in the water. Males and females segregate and occupy spatially distinct raft areas. Rafts form consistently in the same area over periods of years. From field observations, there appear to be differences in the characteristics of rafting locations used by males and females, as well as differences in the daily formation of rafts. Female rafts are more numerous than male rafts.
In this study, the characteristics of 49 raft sites were measured in a GIS environment. Physical characteristics included average depth, distance from large and small land masses, exposure, and bottom complexity. Male rafts were, on average, more protected from the southeast than were female rafts. Several male rafts were located in inlets, whereas no female rafts were. Male rafts were closer to large land masses, and female rafts were closer to small land masses. Rafts of both genders occurred in depths less than 20 meters.
Gender differences in raft site characteristics likely reflect differences in the needs and constraints confronting adult male and female sea otters. Adult females give birth to a single pup each year. Females care for their pups for six to eight months. Large land masses are a potential source of terrestrial predators and bald eagles, which are known to prey on pups. Land masses less than 50 meters were typically associated with rock reefs and variable shallow habitat, features providing a variety of shallow foraging habitat. To obtain the benthic invertebrates upon which sea otters feed, females must leave their pups unattended at the surface while they dive. Shallow depths may be preferred by females with pups.
3.5.3 From Physics to Whales: The Example of the Baleen Whale Feeding Ground of the St. Lawrence Estuary
Yvan Simard
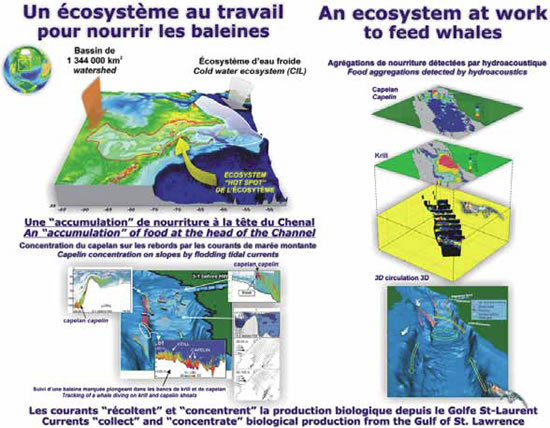
Figure 7

Fin whale
Photo: John Ford
Baleen whales from the northwest Atlantic migrate annually to the Gulf of St. Lawrence during the ice-free season to refill their fat reserves by foraging on their preferred prey. This intensive annual feeding is fundamental to the health of the individuals, their reproduction, and growth of the population. The question is what makes and controls these aggregations.
Using an ecosystem approach, this question was addressed by a systematic research plan, in order to understand the oceanographic processes determining the prey aggregations at a traditional whale feeding ground of the St. Lawrence system. Located at the upstream end of their annual migration route, it has been regularly visited by several species, notably blue, fin and minke whales. This high perennial recurrence is indicative of the presence of a persistent process that steadily maintains the aggregated preys at the head of the channel.
The research program showed that this area is the site of the richest krill aggregation in the northwest Atlantic. The mechanism (Fig. 7) responsible is the pumping of the adult krill from a large part of the Gulf of St. Lawrence. Tidal interactions of currents and krill with the channel slopes concentrate adult krill in up-welling slope currents. This current feeds the Marine Park krill aggregation. Pelagic forage fish such as capelin also aggregate in this area. Further research on their aggregation dynamics at the channel head and the Saguenay fjord entrance is underway.
Intensive hydro-acoustic measurements of krill distribution of the whole Gulf of St. Lawrence were required to get the full picture of an exceptional perennial baleen whale feeding ground in Eastern Canada. Modeling also pointed out areas of other krill aggregations in the St. Lawrence system, which matches the published data from a survey over the Gulf.
4.0 Human Impacts on Marine Mammals
4.1 Commercial and Subsistence Hunts
4.1.1 Bowhead Whales in the Eastern Canadian Arctic and West Greenland
Jeff Higdon

Successful bowhead hunt
Photo: Jack Orr
Commercial harvesting of bowhead whales in eastern Canada and West Greenland has a long history, starting with Basque whalers in the Strait of Belle Isle in 1530. Inuit in Canada and West Greenland have also hunted bowheads for subsistence, and for trade, for centuries. Recovery planning for bowhead whales requires an estimate of pre-exploitation size to set population recovery targets. The estimated pre-whaling population size can be estimated using a population model and a harvest series. Establishing a catch series, as reported here, was the first step.
Commercial bowhead whaling started in the early 1500s in the Strait of Belle Isle area, and Danish and German whalers were voyaging to Davis Strait by the late 1600s. Danish-Norwegian colonization of West Greenland started in 1721, and these settlers were also active in bowhead whaling. British whalers were in Davis Strait by the mid-1700s and crossed into Baffin Bay in the early 1800s, starting another pulse in bowhead whaling off Baffin Island, in Lancaster Sound, Prince Regent Inlet, and the Gulf of Boothia. American whalers were active in Davis Strait in the 1700s and again in the 1800s, and in Hudson Bay after 1860, where they were joined by Scottish whalers. The last commercial whaling for bowheads in the Canadian Arctic was in 1915, when the population was at extremely low numbers and voyages were no longer profitable. The total (minimum) commercial harvest from 1530-1915 was estimated at 57,507-68,736 whales, with highest harvests by the Basques and British.

Figure 8. Estimated total bowhead harvest per decade in eastern Canada and West Greenland from 1530-2005, illustrating how small Inuit subsistence harvests were in comparison to commercial harvests.
The first native culture to be active bowhead whalers was the Thule. After 1500, bowhead whaling declined, possibly related to changing climatic conditions, a reduced whale population from Basque harvests, or a combination of both factors. The total estimated harvest between 1530 and the end of commercial whaling was 8,460 whales. Inuit whaling declined again after commercial whalers over-harvested the bowhead population, and only 56 whales are known to have been harvested after 1918. The estimated Inuit harvest is based on scattered data and a number of assumptions; there is some evidence that at least parts of the harvest series are underestimates. The long tradition of Inuit bowhead whaling was negatively impacted by commercial harvests. There is currently a limited hunt in Nunavut with similar hunts planned in Nunavik and West Greenland.
Combining the commercial and Inuit harvests after 1530 results in a total estimated kill of over 70,000 whales (not including struck and lost and known to be incomplete for some nations and eras). Nearly all (88 percent) were taken by commercial whalers. While still incomplete, the harvest series is more detailed than previously available data and should improve modeling efforts to estimate pre-whaling population size (Fig. 8). However, any modeling should rigorously assess the sensitivity of the results to varying aspects of the harvest series due to the number of assumptions included. The quality of the harvest data varies considerably by nation and era. Population modeling studies will need to explicitly incorporate this variability in data quality.
4.2 Providing Scientific Advice on TACs
4.2.1 The Management of Harp, Hooded and Grey Seals in Canada
Garry Stenson
Since the early 1980s, the Canadian government used a reference point known as ‘Replacement Yield' in the management of harp, hooded and grey seals in the Northwest Atlantic. Replacement yield is the number of animals that can be taken in any one year that will result in the population remaining the same as in the previous year. In 2003, however, Canada adopted a new approach to the management of seals in Atlantic Canada. This management approach, referred to as Objective Based Fisheries Management, incorporates the Precautionary Approach (PA) which strives to be more cautious when information is less certain, does not accept the absence of information as a reason for not implementing conservation measures, and defines, in advance, decision rules for stock management when the resource reaches clearly stated reference points. These points or levels are referred to as conservation (limit or critical), precautionary (or buffer) and target reference points.
One of the basic PA principles is the need to account for the uncertainty associated with estimates and to develop a basis for taking action even if stock status is insufficiently known. Therefore, we distinguish between species where a considerable amount of data are available (‘data-rich') and situations where resource information is more limited (‘data-poor'). Data-rich species are defined as requiring three or more abundance estimates over a 15-year period, with the last estimate obtained within the last five years, and current information (≤ five years old) on fecundity and/or mortality. If these data are not available, the species would be considered as data-poor.
For data-rich species, the conservation reference point (Ncritical) represents the (estimated) numerical abundance at which continued removals are considered to cause serious and irreversible harm to the population. However, estimates of abundance are associated with considerable uncertainty and this uncertainty increases as the population is projected into the future. Managing a population close to the conservation reference point could result in a high probability that the population unintentionally declines below Ncritical. Therefore, a Precautionary Reference Point (Nbuffer) identifies an ‘unsafe' population range within which risk-adverse management control rules would apply. When a population is above the precautionary reference point, managers may establish a target reference point based upon considerations such as ecosystem impacts and/or socio-economic benefits. As long as the population remained above Nbuffer, higher-risk harvest strategies could be adopted. In fact, in Canada there must be an 80 percent likelihood that a population is above Nbuffer to be considered in the healthy zone.
If the population is below Nbuffer (but above Ncritical), conservation concerns become a higher priority and pre-agreed harvest control rules would be applied with the objective to rebuild the population to above Nbuffer within a specified number of years. Although harvesting and other human-induced removals could continue, management strategies require a high probability that the population will increase (or conversely, a lower risk that the population would continue to decline).
A population below Ncritical is considered to be a conservation concern and continued removals present an unacceptable risk of serious or irreversible harm. Therefore, management actions should ensure that all human-induced mortality is eliminated.

Figure 9. Objective Based Fisheries Management approach adopted by Canada in 2003 with reference levels identified for Northwest Atlantic harp seals.
Currently, we have set Ncritical to be 30 percent of the highest population level estimated or inferred (‘N30'), while the Nbuffer is considered to be 70 percent of this maximum (N70) (Fig. 9). For management purposes we have also identified a level at 50 percent where more stringent management measures are required. The precautionary reference level is set quite high owing to the characteristics of the way in which seals are assessed and the age structure of the current harvest. Because the primary method of assessment is to estimate pup production every four to five years and the high level of YOY in the harvest, the impact of current catches cannot be evaluated until surviving animals have themselves reproduced five or more years later. Also, recent environmental conditions have been poor and will likely continue to worsen, on average. Finally, history has shown that marine mammal populations grow relatively slowly, but can decline quickly (e.g. St. Lawrence beluga, blue whales) and that failure to consider uncertainty can result in severe harm (e.g. Atlantic cod, salmon, abalone).
For species not satisfying the data-rich criteria, the uncertainty associated with resource status and with the effects of particular management actions increases. Therefore, an even more risk-adverse approach is needed. We apply a formula similar to the ‘Potential Biological Removals' approach developed by the United States under the Marine Mammal Protection Act.
Under the Objective Based Fisheries Management plan, hooded seals are considered to be ‘Data Poor'. Harp and grey seals are considered to be ‘Data Rich' and are currently considered to be above the N70 precautionary reference level.
4.2.2 Hunt Induced Mortality of Northwest Atlantic Hooded Seals
Garry Stenson
In order to determine the abundance of wild populations accurately, it is necessary to obtain the most complete data possible on the level of human induced mortality. This is particularly important for species that are exploited by subsistence or commercial hunts. In the Northwest Atlantic, hooded seals, like harp seals, are killed during a subsistence harvest in Greenland and a commercial hunt in southern Canadian waters. However, unlike harps, very few hooded seals are taken in the Canadian Arctic or as by-catch in Canadian fisheries.
The objective of this study was to summarize the available data on reported catches of hooded seals, and to estimate total hunt-induced mortality for the years 1954-2006. Prior to the imposition of quotas in 1974, catches were highly variable in Canada, ranging from a couple hundred to more than 25,000. Between 1974 and 1982 catches averaged 12,500 but declined after 1982 due to a collapse in the major markets. For the most part, annual catches were in the range of a few hundred until the mid-1990s. In 1996, a large number of bluebacks were taken illegally, and a subsidy for meat resulted in catches of 7,000 in 1997 and 10,000 in 1998. Since then the annual harvest has remained low.
Between 1945 and 1960, hooded seals were hunted by Norwegian vessels; annual catches ranged from 1,500 to 48,000 and averaged 14,500. Less than 1,000 were taken by Norwegian scientists biennially between 1970 and 1978. Meanwhile, catches in Greenland were 1,000 to 2,000 between the mid-1950s and 1972; catches are relatively steady now, averaging 6,000 to 7,000 seals.
Total removals averaged 34,800 between 1954 and 1960; from 1974 to 1982 the average was 24,600. The majority of hooded seals are caught in Greenland. With the exception of 1996-1998, when Canadian catches accounted for 70 percent of annual catches, Greenland accounted for 65 percent of hooded seals killed. Approximately 30 percent of hooded seals killed are young of the year.
4.2.3 Determining Total Allowable Catch Levels for Nunavut Beluga and Narwhal
Pierre Richard
Fisheries and Aquaculture Management (FAM) requested advice from Science on the total allowable catch (TAC) for all Nunavut stocks of belugas and narwhals. FAM also requested that science advice be framed by its draft Precautionary Approach Framework; this requires a sufficiently long time series of assessments of population size, hunting mortality and concurrent population dynamics parameters. This is not feasible for data-poor stocks – stocks for which population dynamic parameters cannot be estimated; the conservative Potential Biological Removal (PBR) method was used to determine TAC for these stocks.

Beluga whales surfacing in a polynya
Photo: M. Ramsay

Pod of narwhal
Photo: Larry Dueck
The PBR results were also compared to a simple growth model used to determine risk probability of different levels of decline. In this model, uncertainty distributions were used to model the imprecision of population size and hunting loss rate and to model uncertainty in the population growth rate. The recommended total allowable landed catch, i.e.: PBR- hunting losses, when compared to the risk model with simple growth model, was shown to have a small probability of resulting in a declining trend. In the future, more surveys of these stocks may help to estimate trend and population dynamic parameters for these stocks.
4.3 Marine Mammal By-Catch
4.3.1 By-Catch of Harp Seals in the Newfoundland Lumpfish Fishery
Becky Sjare

Harp seal bycatch in a crab pot
Photo: DFO Newfoundland
By-catch is defined as the incidental entrapment or capture of non-target species during a fishing operation. Unfortunately it is a key conservation issue for numerous marine species around the world. All species of seals found in Newfoundland waters are incidentally taken in both active fishing gears, such as trawls, and passive gears, such as gillnets. In Newfoundland, harp seals are involved in the majority of entrapments, and most are caught in gillnets set for lumpfish.
Lumpfish occur along all coasts of the province and there are major concentrations on the St. Pierre Bank. The fishery uses monofilament gillnets with a mesh size of 25-27 centimetres usually set in 3-33 meters of water. Fishermen typically use between 20 and 100 nets that are set in a series of long strings and left to fish for two to three days before they are hauled.
The types of gear used, and the timing of the lumpfish fishery in Newfoundland, are key factors influencing the level of harp seal by-catch. The large mesh nets used in the fishery pose a significant barrier to the seals, possibly by being invisible to them, or attracting them when they become full of fish. In certain areas of the province, seal migration routes overlap with fishing activities. Young harp seals born in late February and early March migrate out of whelping areas located in the southern Gulf of St. Lawrence and northeast coast of Newfoundland in April and May. During this spring migration, some of the seals travel along inshore areas of Newfoundland; it is these animals that encounter lumpfish gillnets.
This research provides estimates of the number of harp seals taken annually from 1970-2003. Data were obtained from a by-catch monitoring program that required lumpfish fishermen to record fishing effort (roe landings) and the number of seals caught on a daily basis from 1989-2003. Prior to 1989, annual by-catch was estimated using historic roe landings.
From the beginning of the lumpfish fishery in 1970 until 1985 the by-catch of harp seals remained below 5,000 animals. In 1987, catches increased to a high of 13,100 seals and then declined to 3,600 in 1990. The peak by-catch for the time series was 46,394 seals in 1994; catch levels remained higher than 18,000 animals until 1997. In 2002 and 2003 there was a major down-turn in the fishery and by-catch levels dropped below 10,000 animals. Since 2003, catches have remained low. These estimates of annual by-catch vary depending on several key assumptions but they provide a long-term view of by-catch as a source of mortality.
4.3.2 Modified Fishing Gear to Reduce Incidental Cetacean Mortalities
Edward Trippel

Modified fishing ropes and gear
Photo: Edward Trippel
Incidental mortality of cetaceans due to bycatch and entanglement in commercial fishing gear is a conservation concern worldwide. It is estimated that the North Atlantic right whale, a critically endangered species, owes more than ten percent of its mortality and over half of serious injuries to entanglement in lobster pot and gillnet gear lines. Since the 1990s, a number of mitigation techniques to reduce mortalities in the right whale population have been tested. The use of some of these techniques has now been legislated in the commercial fishery.
However, the North Atlantic right whale population remains in a precarious state. This study investigated the current state of development and effectiveness of mitigation techniques through the addition of barium sulphate to fishing gear rope.
The development of a neutrally buoyant groundline was undertaken to reduce the probability of large whale entanglements. The resulting product maintained a much lower profile in the water column compared to traditional groundlines but in hard bottom areas it was susceptible to chaffing and breaking. In order to reduce mortalities once large whales are entangled, a weak rope was developed, again with the addition of barium sulphate. The breaking strength of this product was 1,065 pounds, which meets U.S. legislated limits but is half the weight of traditional groundlines.
4.4 Seismic Surveys and Navy Sonar
4.4.1 Bowhead Whale Feeding Aggregations in the Canadian Beaufort Sea and their Role in the Mitigation of Effects of Seismic Underwater Noise
Lois Harwood

Bowhead whales as seen from survey airplane
Photo: Lois Harwood
A systematic strip-transect aerial survey of the south-eastern Beaufort Sea was conducted on August 22-23, 2007. The objective of the survey was to update the knowledge of distribution and use of Beaufort Sea by bowhead whales, as the last comprehensive survey was done in 1986.
Twenty-four north-south transect lines were flown, providing approximately ten percent survey coverage of the south-eastern Beaufort. Primary observers recorded 132 bowhead whales on-transect, 38 off-transect and 71 during reconnaissance flights, for a total of 241 whales. The number of bowhead whales sighted on-transect was more than twice that of the 1980s survey, but the general areas where they aggregated were similar.
According to the definition of feeding aggregation area, being more than five bowheads per 100 squared kilometres, bowheads occurred in three main feeding aggregations in 2007. These were found off the Yukon coast between Komakuk Beach to Shingle Point, near the shelf-break north of the Mackenzie River estuary, and off the Tuktoyaktuk Peninsula.
The propensity of bowheads to aggregate, and a real-time knowledge of aggregation areas, provides an opportunity to establish mitigation procedures that can be
- more restrictive within localized bowhead feeding areas, to ensure no disturbance or injury to feeding whales, and
- less restrictive outside the feeding areas, so as not to unjustifiably constrain industry activity. Replicated aerial surveys are planned for August 2008 and August 2009.
4.4.2 Acoustic Monitoring of Killer Whales off Canada's West Coast
John Ford

Deployment of an acoustic recording package at sea
Photo: Hiromi Naito
The killer whale – the world's apex marine predator – can be found in all oceans but they are very rare in most regions. The waters off Canada's west coast are home to an unusual abundance of this species, and they have become a high-profile icon of the wild marine environment of British Columbia. Killer whales have long been a focus of field research by marine mammal scientists at DFO's Pacific Biological Station (PBS). Each year since the early 1970s, killer whales have been studied using photo-identification of individuals from natural markings. Registries of over 700 individual whales from three distinct assemblages – or ecotypes – of killer whales in British Columbia waters are maintained at PBS. This annual population monitoring is critical to recovery efforts for these ecotypes, all of which are listed under Canada's Species at Risk Act.
Thanks to this long-term study, many aspects of the life history and ecology of killer whales in British Columbia are becoming clear, but many gaps in our knowledge remain. A major source of uncertainty is the whereabouts of killer whales in winter, when most whales vacate their summer habitats in the protected inshore waters around Vancouver Island. Finding killer whales in remote waters off the west coast during winter is a daunting task, and the small vessels we use during our summer studies are not suitable for such work. Satellite tagging the whales is not yet a viable option due to the difficulty in attaching tags to the whales without capturing them and the short lifespan of the tags, which is usually limited to a month or two.
To learn more about the winter distribution of killer whales, we are developing a network of remote underwater acoustic monitoring stations in strategic locations along the BC coast to track the whales using their own vocalizations. Killer whales are ideal for this kind of monitoring, as their vocalizations are highly stereotyped and differ between populations and social groups. Thus, with only a few minutes of killer whale calls, we can determine which ecotype of whales is present and, especially for the so-called ‘resident' killer whales, we can identify the clans and pods involved.
Our acoustic monitoring stations are of two different kinds: onshore and offshore. A prototype onshore station has been tested over four winters at Langara Island, off the northwest corner of the Queen Charlotte Islands, or Haida Gwaii. This station consists of a weatherproof case containing a specialized computer with a custom-engineered sound detection system. It is powered by storage batteries that remain charged with solar panels. The instrument is connected by armored cable to an underwater microphone, or hydrophone, located on the sea floor about 100 metres offshore. When whale sounds are received by the hydrophone, the sound detection system triggers the computer to record a sample of underwater sound on a hard disk for later analysis. This station has yielded a great deal of new information on whale occurrence at this remote site, and we hope to deploy additional shore-based stations in the future.

Remote acoustic recording station (“Orcabox”) at Langara Island
Photo: John Ford
Our second kind of monitoring station is similar in function to the onshore units but the whole system is housed in a submersible watertight case for deployment in offshore waters. The case contains the hydrophone, a miniaturized computer system with hard disk for storing digital recordings, and batteries that allow monitoring and recording for up to a year. The offshore stations are anchored to the seafloor and are suspended 50 metres beneath the surface by floats. They are retrieved by triggering an acoustic release, which disconnects the anchor and allows the station to float to the surface for pick up.
A third method of monitoring killer whales acoustically is becoming possible through our collaboration with two new initiatives off the west coast – VENUS (Victoria Experimental Network Under the Sea) and NEPTUNE (Northeast Pacific Time-Series Underwater Networked Experiments). Both VENUS and NEPTUNE involve oceanographic sampling nodes on the seafloor that are linked via fibre optic cable to the Internet. These nodes will include hydrophones optimized for monitoring whale sounds, and will provide opportunities for researchers and the public alike to listen to killer whales in real time.
As our killer whale acoustic monitoring network grows, we anticipate that it will continue to provide new insights into the seasonal movement patterns of these enigmatic predators.
4.5 Marine Mammals as Sentinels of Environmental Contamination
4.5.1 Assessing the Potential Effects of Near Shore Hydrocarbon Exploration on Ringed Seals in the Beaufort Sea Region
Lois Harwood

Ringed seal at a breathing hole
Photo: DFO
The objectives of this study were to identify and evaluate any potential impacts of offshore industrial activities on resident seal populations, with a view to providing advice on any mitigating measures and monitoring studies which might be employed effectively in the future. The study focused on ringed seals from 2003-2006 in the fast ice habitat north of the Mackenzie River estuary in the Beaufort Sea.
Devon Canada's 2006 Paktoa drilling site was located close to the edge of the fast ice, which is a highly important feature of the arctic marine ecosystem and important for seals. This feature is used for establishing and defending mating territories, giving birth to and nurturing their pups, breeding and basking. The first three years of the study were conducted prior to industry activity at Paktoa, while the fourth year was conducted during the latter part of an exploratory drill season. In 2006 Devon successfully completed drilling and abandoned the well.
The mean distance of lairs and breathing holes from Paktoa were not significantly different among the non-industry and industry years. The same was true for frozen and active seal structures, which showed no significant differences among those same years. In 2006, the frequency distribution of distances of seal structures from the ice road, the airstrip, and research camp showed no tendency toward avoidance or attraction to these sites.
Twenty ringed seals were captured, instrumented with satellite-linked transmitters and released near the Paktoa site. The movements and size of the territories used by these tagged seals did not statistically vary between 2005 and 2006, when ice conditions were vastly different. Additionally, 68 ringed seals were collected to examine body condition and reproductive status of the local seal population. The collected specimens showed good body condition with ample fat stores, in normal reproductive status and most with prey in their stomach.
Overall, the study provided important baseline information on the use of the near shore Beaufort Sea by ringed seals during spring, and is a benchmark for any future studies involving multiple or longer-term drilling operations. The results suggest that one season of drilling by industry at the Paktoa site had no detectable effect on ringed seals in the study area. The effects of longer exposures to industrial activity remain unknown.
4.5.2 Killer Whales as Sentinels for Ocean Pollution
Peter Ross

Orcas swim past an oil refinery
Photo: Ingrid Visser
Despite international efforts to control them, polychlorinated biphenyls (PCBs) and many other contaminants persist in the environment and can present health risks to marine mammals at the top of the food chain. British Columbia's killer whale populations face severe pressures. The Committee on the Status of Endangered Wildlife in Canada (COSEWIC) categorizes “southern residents” as endangered, “northern residents” as threatened and “transient” as threatened. “Resident” killer whales consume a diet that consists entirely of fish, while “transients” consume almost exclusively marine mammals.
Factors that threaten the recovery of B.C.'s resident killer whales include small population size, reduced availability of their primary prey (salmon), noise and disturbance. Resident killer whales are a charismatic viewing target for tourists, and steps are being taken to ensure that these ecotourism activities do not impede normal life processes, including feeding, socializing, and reproduction.
The harbour seal has helped provide insight into the threat posed to killer whales by contaminants such as PCBs. This small, non-migratory marine mammal has a similar physiology to killer whales. Sampling them is less disruptive than taking more dart biopsies from killer whales. The abundance of harbour seals, with 130,000 in B.C., allows researchers to select animals of a consistent age and condition, which gives more reliable data.
Whether contaminants originate nearby or far away, B.C.'s killer whales pick them up by eating coastal prey. Salmon, a major food source, migrate inshore from distant ocean waters, bringing small amounts of global toxics with them. Species such as rockfish, which spend their lives closer to the coast, carry more contaminants.
The prey's position in the food chain also makes a difference. Transient killer whales dine on seals, sea lions, porpoises, and other mammals that have already accumulated toxins from lower levels of the food chain. Thus the transient whales are more at risk for toxic effects than their resident, fish-eating cousins. B.C.'s killer whales are helping researchers and managers better understand the fate of environmental contaminants on a global scale.
4.6 Strandings and Mortality Events
4.6.1 Hunt Induced Mortality of Northwest Atlantic Harp Seals
Garry Stenson

Sealing vessels travelling to harp seal hunt near the Magdalen Islands
Photo: Mike Hammill
Information on the level of human induced mortality is required for accurate population estimates for any population. It is particularly important for exploited species that are subject to high catch levels, and thus it is needed to develop a responsible management plan. The Northwest Atlantic harp seal population is subject to various types of human induced mortality, including subsistence harvests in Greenland and the Canadian Arctic, commercial catches in southern Canadian waters, animals that are killed but not landed, and bycatch in commercial fishing gear.
The objective of this study was to summarize available estimates and update them for the years 1952-2004. Commercial and subsistence hunts accounted for the majority of removals. Between 1952 and 1971, catches averaged more than 288,000 seals in the commercial hunt. Quotas were introduced in 1972 and, until the demise of the large vessel hunt in 1982, 165,000 seals were taken annually. After 1982, catches averaged 52,000, until 1995 when they increased to an average of 258,000 seals.
In Greenland, catches were less than 20,000 prior to 1980, have increased steadily to a peak of over 100,000 in 2002, and declined again recently to approximately 70,000 seals. Limited data is available on catches in the Canadian Arctic, but it appears that the numbers are relatively low (less than 5,000). Thus, the total removals from 1952-1982 was 388,000 but declined to 178,000 annually between 1983 and 1995. Higher catches in Canada and Greenland commenced in 1996, resulting in an average annual removal of 471,000. Young of the year account for approximately 68 percent of current removals.
4.6.2 St. Lawrence Estuary Beluga – Review of Carcass Program
Lena Measures

Examination of a beached beluga whale
Photo: Lena Measures
In 2005, a workshop on the St. Lawrence Estuary beluga carcass program was conducted at the Maurice Lamontagne Institute with some 25 scientists and managers involved or interested in the program and invited external consultants. The workshop had two objectives: 1) to evaluate the value of the program in terms of four specified themes, causes of mortality and disease, contaminants and toxic effects, biology and demography and conservation; and 2) to determine the future of the program by examining options and consequences. A history of the carcass recovery program was presented as well as a description of the necropsy program. Additional presentations summarized present knowledge on parasitic and infectious diseases, exposure and toxic effects of contaminants, ecological and demographic information and conservation measures (national marine park and a proposed marine protected area) designed to protect the beluga and its habitat. A final presentation on the value of a marine mammal stranding program in California was presented for comparative purposes.
Four key recommendations resulted from the workshop:
- the St. Lawrence Estuary beluga carcass program is a world-recognized case study that should continue;
- available data should be shared and integrated, protocols should be standardized and documented, archived tissues and databases co-ordinated, etc;
- the core components of the program (monitoring, necropsy and sampling) should continue with adequate funding; and
- special research projects should be funded to investigate specific questions arising from the core program and to serve specific management needs. It was considered essential to validate, examine and integrate over 20 years of data made available in an accessible database so that various hypotheses could be tested and used to assist in understanding why this population has failed to recover. A proceedings report (2007/005) on the workshop is available at the following website:
www.meds-sdmm.dfo-mpo.gc.ca/csas/applications/Publications/publicationIndex_e.asp.
4.6.3 Reducing the Risk of Vessel and Right Whale Collision in the Roseway Basin Region of the Southwestern Scotian Shelf
Heath Stone

Right whale female and calf
Photo: NOAA-NMML
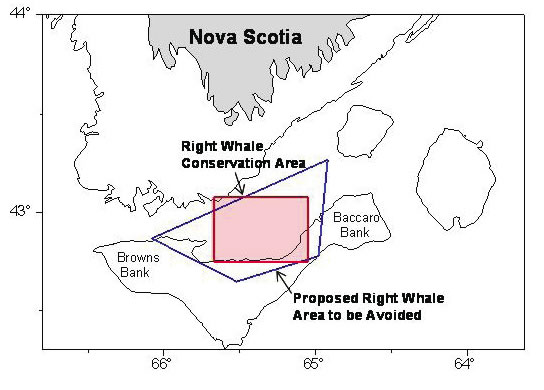
Figure 10. The southwestern Scotian Shelf with locations the Roseway Basin Right Whale Conservation Area (red) and designated right whale “Area to be Avoided” by commercial shipping (blue).
The North Atlantic Right Whale is one of the world's large whales. It is also one of the most endangered, and is listed as Endangered under Schedule 1 of the Canadian Species at Risk Act (SARA). Current population abundance is estimated at 350-400 individuals. The species appeared to decrease in abundance during the 1990s, and most of the documented human-induced mortality is attributed to vessel strikes. In 1993, DFO designated two conservation areas: Grand Manan Basin (Bay of Fundy) and Roseway Basin (between Browns and Baccaro Banks). Both areas are important for feeding and socializing and have high concentrations of right whales during the summer and fall.
Conservation measures to reduce the potential for right whale/vessel collisions in the Grand Manan Basin conservation area were successfully implemented in 2003 by Transport Canada and the DFO. Outside the Bay of Fundy, Roseway Basin is the only other known area in Canadian waters where North Atlantic Right Whales aggregate in relatively high numbers, but there are no current recognized vessel traffic management measures in this region.
In 2006, the National Marine Mammal Peer Review Committee (NMMPRC) of DFO Science reviewed a proposal to designate an “Area to be Avoided” around the Roseway Basin Conservation Area (Fig. 10). The proposal was based on scientific data, which compared the distribution of right whales with information on vessel traffic transiting the region. The NMMPRC concluded that a reduction in vessel traffic in this area would result in a reduced probability of right whale/vessel encounters, and thus increase the probability of species recovery.
On October 7, 2007, the International Maritime Organization (IMO) adopted the proposal (led by Transport Canada) to designate 1,780 square kilometres of Roseway Basin as an “Area to be Avoided” by ships 300 gross tons or more, solely in transit, from June 1 to December 31. The effective date is May 1, 2008.
4.7 Climate Change
4.7.1 Ringed Seals as Indicators of Change
Lois Harwood

Releasing a tagged ringed seal back to its hole
Photo: Lois Harwood
The ringed seal has a circumpolar distribution, and is the most abundant pinniped species in the Arctic Ocean. They are considered reasonable indicators of ecosystem health due to their position near the top of the food chain. They are omnipresent and important prey of polar bears; changes in seal distribution and abundance can have long-term survival consequences for polar bears. Ringed seals are a valued subsistence resource of the Inuvialuit. Past research on ringed seals of the Western Arctic revealed downward trends in seal abundance, reduced ovulation rates among mature females, reduced pups in the subsistence harvests, and reduced number of birth lairs in association with the heavy ice winter of 1974-1975.
Sampling of seals taken in the subsistence harvest has been done by a highly experienced seal hunter from Ulukhaktok, Northwest Territories. The parameters examined include determination of the ovulation rate of adult females, the proportion of pups in the subsistence harvest, year class strength, body condition (blubber thickness, body mass index) of harvested seals, and the recording of unusual observations and events by harvesters. Ovulation rates remained consistently high from 1992-1999 and have dropped slightly more recently. The annual proportion of pups in the open water harvest also showed a decreasing trend over the 2000-2006 time period. Blubber thickness showed a decline from 1992-2006 for all age classes except newly weaned pups.
This downward trend in seal reproduction and body condition tracked closely with the number of open water days in 2000, and 2002-2005. During years with a longer open water period, such as 1998 and 2001, ringed seals were fatter than in other years, and pup production was high. The mechanisms are not clearly understood, but appear related to changes in the timing of break up of sea-ice in spring. Timing of break-up influences the timing of the establishment of oceanographic conditions that favour the production of seal food items such as cod.
4.7.2 Killer Whales and Climate Change
Steve Ferguson

Killer whales spy-hopping
Photo: Graeme Ellis
Although controversial, killer whales have been implicated as major ecosystem modifiers creating trophic cascades as a result of ecosystem disruptions that include human commercial whaling. Climate change models predict major reductions in sea ice, likely resulting in changes in species distribution and abundance. It has been hypothesized that killer whales will move into Arctic waters as sea ice disappears, and that as top predators they will initiate major ecosystem adjustments. As such, the prediction is that killer whales will be major players in the reorganization of Arctic oceans currently undergoing global warming.
In this study, changes in distribution of killer whales in Hudson Bay were measured with decreasing sea ice as an example of global readjustments occurring with climate change. Records of killer whales in Hudson Bay, Hudson Strait, and Foxe Basin were summarized and related to an historical sea ice dataset. The results point to evidence of “choke points”, where sea ice inhibits killer whale movement, causing restrictions to their Arctic distribution. Hudson Strait appears to have been a significant sea ice “choke point” that opened up 50 years ago, allowing for the appearance of killer whales, and the advancing distribution of an ice-avoiding predator.
Killer whale sightings have increased exponentially, and are now reported in the Hudson Bay region every summer. The prediction is that other “choke points” will soon open up with the continued sea ice melt, producing punctuated predator-prey trophic cascades across the Arctic.
5.0 Publications 2006-2008
- Anderson, J.T., D.V. Holliday, R. Kloser, D. Reid and Y. Simard. 2007. Acoustic seabed classification of marine physical and biological landscapes. In: Anderson et al. (eds.) ICES Cooperative Research Report, No. 286. 183 pp.
- Anderson, J.T., D.V. Holliday, R. Kloser, D. Reid and Y. Simard. 2007. Future directions for acoustic seabed classification science. In: Anderson et al. (eds.) Acoustic seabed classification of marine physical and biological landscapes. ICES Cooperative Research Report, No. 286. 183 pp.
- Anderson, J.T., D.V. Holliday, R. Kloser, D. Reid, D. and Y Simard. 2008. Acoustic seabed classification: Current practice and future directions. ICES Journal of Marine Science, 65 doi:10.1093/icesjms/fsn061
- Assuncao M.G.L., K.A. Miller, N.J. Dangerfield, S.M. Bandiera and P.S. Ross. 2007. Cytochrome P450 1A expression and organochlorine contaminants in harbour seals: Evaluating a biopsy approach. Comparative Biochemistry and Physiology C-Toxicology and Pharmacology, 145(2): 256-264.
- Austin, D., W.D. Bowen, J.I. McMillan and D.J. Boness. 2006. Stomach temperature telemetry reveals temporal patterns of foraging success in a free-ranging marine mammal. Journal of Animal Ecology, 75: 408-420.
- Austin, D., W.D. Bowen, J.I. McMillan and S.J Iverson. 2006. Linking movement, diving and habitat to feeding a large marine predator. Ecology, 87: 3095-3108.
- Bahoura, M., R. Lepage, X. Mouy, C.W. Park, J. Rouat, N. Ray, D. Seebaruth, Y. Simard and M. Sirois. 2006. Development and experimentation of a satellite buoy network for real-time acoustic localization of whales in the St. Lawrence. Proceedings of OCEANS'06 MTS/IEEE – Boston, IEEE Cat. No. 06CH37757C. ISBN: 1-4244-0115-1. IEEE, Piscataway, NJ, USA.
- Bahoura, M. and Y. Simard. 2008. Blue whale calls characterization using chirplet transform. Journal of the Acoustical Society of America, 123: 3779.
- Bahoura, M. and Y. Simard. 2008. Chirplet transform applied to simulated and real blue whale (Balaenoptera musculus) calls. Image and Signal Processing in Lecture Notes in Computer Science No. 5099: 296-303. https://link.springer.com/content/pdf/10.1007%2F978-3-540-69905-7_34.pdf.
- Beck, C.A., S.J. Iverson, W.D. Bowen and W. Blanchard. 2007. Sex differences in grey seal diet reflect seasonal variation in foraging behaviour and reproductive expenditure: evidence from quantitative fatty acid signature analysis. Journal of Animal Ecology, 76: 490-502.
- Bedard, C. and Y. Simard. 2006. Automatic detection of white whale vocalizations in St. Lawrence estuary and occurrence pattern. Proceedings of the Canadian Acoustical Society Annual Meeting. Canadian Acoustics, 34(3): 84-85.
- Benjamins, S., J.Lawson and G. Stenson. 2007. Recent harbour porpoise bycatch in gillnet fisheries in Newfoundland and Labrador. Journal of Cetacean Research and Management, 9: 189-199.
- Benoit, D., Y. Simard and L. Fortier. 2008. Hydro-acoustic detection of large winter aggregations of Arctic cod (Boreogadus saida) at depth in ice-covered Franklin Bay (Beaufort Sea). Journal of Geophysical Research, 113: C06S90, doi:10.1029/2007JC004276.
- Boily, F., S. Beaudoin and L.N. Measures. 2006. Hematology and serum chemistry of harp (Phoca groenlandica) and hooded seals (Cystophora cristata) during the breeding season, in the Gulf of St. Lawrence, Canada. Journal of Wildlife Diseases, 42: 115-132.
- Boness, D.J., W.D. Bowen, B. Bulheier and G. Marshall. 2006. Mating tactics and mating system of an aquatic mating pinniped: the harbour seal. Behavioural Ecology and Sociobiology, 61: 119-130.
- Bowen, W.D., C.A. Beck, S.J. Iverson, D. Austin and J.I. McMillan. 2006. Linking predator foraging behaviour and diet with variability in continental shelf ecosystems: grey seals of eastern Canada. In: Boyd, I., Wanless, S. and Camphuysen, C.J. (eds). Top Predators in marine ecosystems: their role in monitoring and management. Cambridge University Press, Cambridge UK. :pp. 63-81.
- Bowen, W.D., S.J. Iverson, J.I. McMillan and D.J. Boness. 2006. Reproductive performance in grey seals: age-related improvement and senescence in a capital breeder. Journal of Animal Ecology, 75: 2319-2326.
- Bowen, W.D. and G. Harrison. 2007. Seasonal and interannual variability in grey seal diets on Sable Island, eastern Scotian Shelf. In: T. Haug, M. Hammill and D. Olafsdottir (eds.), Grey seals in the North Atlantic and the Baltic. Nammco scientific publications vol 6. 227 pp. The North Atlantic Marine Mammal Commission. Tromso, Grafisk Nord, Finnsnes. Pp. 123-134.
- Bowen, W. D., D.J. Boness and L.L. Lowry. 2007. Review of the 2007 Draft Steller Sea Lion Recovery Plan for the North Pacific Fishery Management Council. July 2007. 25 p.
- Bowen, W.D., J.I. McMillan and W. Blanchard. 2007. Reduced rate of population growth of grey seals at Sable Island: evidence from pup production and age of primiparity. Marine Mammal Science, 23: 48-64.
- Bowen, W.D, J.I. McMillan,D. Lidgard and W. Blanchard 2007. Continued reduction in population growth rate of grey seals at Sable Island. Canadian Science Advisory Secretariat Research Document, 2007/087
- Bowen, W. D., L. Gage, D. Goodman and L.L. Lowry. 2008. Report of the Independent Review Panel on the National Marine Fisheries Service's Implementation of the Permit Program for Research on Steller Sea Lions and Northern Fur Seals. 48p.
- Bowen, W. D., M.O. Hammill, M. Koen-Alonso, G. Stenson, D.P. Swain and K. Trzcinski. 2008. Proceedings of the National Workshop on the Impacts of Seals on Fish Populations in Eastern Canada (Part 1). Canadian Science Advisory Secretariat Proceedings, 2008/021.
- Breed, G.A., W.D. Bowen, J.I. McMillan and M.L. Leonard. 2006. Sexual segregation of seasonal foraging habitats in a non-migratory marine mammal. Proceedings of the Royal Society B-Biological Sciences, 273(1599): 2319-2326.
- Buren, A.D., M. Koen-Alonso and G.B. Stenson. 2006. Predator-prey interaction between harp seals and Atlantic cod: An exploration of sources of variation. In: Report of the Workshop on the Decline and Recovery of cod Stocks throughout the North Atlantic, including tropho-dynamic effects (WKDRCS). ICES CM 2006/OCC:12 pp. 151-152.
- Burns, J.M., K.C. Lestyk, L.P. Folkow, M.O. Hammill and A.S. Blix. 2007. Size and distribution of oxygen stores in harp and hooded seals from birth to maturity. Journal of Comparative Physiology B – Biochemical Systemic and Environmental Physiology, 177(6): 687-700.
- Calambokidis, J., E.A. Falcone, T.J. Quinn, A.M. Burdin, P.J. Clapham, J.K.B. Ford, C.M. Gabriele, R. LeDuc, D. Mattila, L. Rojas-Bracho, J.M. Straley, B.L. Taylor, R.J. Urbán, D. Weller, B.H. Witteveen, M. Yamaguchi, A. Bendlin, D. Camacho, K. Flynn, A. Havron, J. Huggins and N. Maloney. 2008. SPLASH: Structure of Populations, Levels of Abundance and Status of Humpback Whales in the North Pacific. Final report for Contract AB133F-03-RP-00078. Cascadia Research, Olympia, WA.
- Calambokidis, J., J. Barlow, J., J.K.B. Ford, T.E. Chandler and A.B. Douglas. In press. Insights into the population structure of blue whales in the eastern North Pacific from recent sightings and photographic identification. Marine Mammal Science.
- Chambellant, M. and S.H. Ferguson. In press. Ageing live ringed seals (Phoca hispida): which tooth to pull? Marine Mammal Science.
- Chassot, E., A. Caskenette, D. Duplisea, M. Hammill, H. Bourdages, Y. Lambert and G. Stenson. 2007. A model of predation by harp seals (Phoca groenlandica) on the northern Gulf of St. Lawrence stock of Atlantic cod (Gadus morhua). Canadian Science Advisory Secretariat Research Document, 2007/066.
- Chassot, E., D. Duplisea, M. Hammill, A. Caskenette, N. Bousquet, Y. Lambert and G. Stenson. In press. The role of predation by harp seals (Pagophilus groenlandicus) in the collapse and non-recovery of northern Gulf of St. Lawrence cod (Gadus morhua). Marine Ecology Progress Series.
- Chikoski, J., S.H. Ferguson and L. Meyer. 2006. Effects of water addition on soil arthropods and soil characteristics in a precipitation-limited environment. Acta Oecologia, 30:203-211.
- Clark, C.A., J.M. Burns, J.F. Schreer and M.O. Hammill. 2006. Erythropoietin concentration in developing harbour seals. General and Comparative Endocrinology, 147(3): 262-267.
- Clark, CA, J.M. Burns, J.F. Schreer and M.O. Hammill. 2007. A Longitudinal And Cross-Sectional Analysis Of Total Body Oxygen Store Development In: Nursing Harbor Seals (Phoca vitulina). Journal of Comparative Physiology B, 177:217–227.
- Coltman, D.W., G. Stenson, M.O. Hammill, T. Haug, S. Davis and T.L. Fulton. 2007. Panmictic population structure in the hooded seal (Cystophora cristata). Molecular Ecology, 16(8): 1639-1648.
- Cote, D., H, Stewart, R.S. Gregory, J. Gosse, J. Reynolds, G.B. Stenson and E.H. Miller. 2008. Prey selection by marine –coastal river otters (Lontra canadensis) in Newfoundland, Canada. Journal of Mammalogy, 89:1001–1011.
- Cosens, S.E., H. Cleator and P. Richard. 2006. Numbers of bowhead whales (Balaena mysticetus) in the eastern Canadian Arctic, based on aerial surveys in August 2002, 2003 and 2004. Canadian Science Advisory Secretariat. Research Document. 2006/052.
- Cyr, C., J.-F. Gosselin, M.O. Hammill, V. Lesage, N. Roy and Y. Simard. 2007. Impacts de la construction d'un port méthanier à Gros-Cacouna sur les mammifères marins. Secr. can. de consult. sci. du MPO. Rép. des sci., 2007-010.
- Davidson, F.J.M., M.O. Hammill and G. Stenson. 2007 Expanding the gathering of real-time in situ oceanographic data with the DFO Marine Mammal Research Program. Atlantic Zone Monitoring Program Bulletin, 6: 63-68.
- Dietz, R., A.D. Shapiro, M. Bakhtiari, J. Orr, P.L. Tyack, P. Richard, I. Grønborg Eskesen and G. Marshall. 2007. Upside-down swimming behaviour of free-ranging narwhals. BMC Ecology, 7: 14 doi:10.1186/1472-6785-7-14.
- Dietz, R., M.P. Heide-Jørgensen, P. Richard, J. Orr, K. Laidre and H.C. Schmidt. 2008. Movements of narwhals (Monodon monoceros) from Admiralty Inlet monitored by satellite telemetry. Polar Biology, DOI 10.1007/s00300-008-0466-4.
- Dueck, L.P., M.P. Heide-Jorgensen, M.V. Jensen and L.D. Postma. 2006. Update on investigations of bowhead whale movements in the eastern Arctic, 2003-2005, based on satellite-linked telemetry. DFO Canada Science Advisory Secretariat Research Document, 2006/050: 25p.
- Dueck, L. and P. Richard. 2008. Preliminary evaluation of selective hunting and recovery of Eastern Canadian Arctic-West Greenland bowhead whales. Canadian Science Advisory Secretariat. Research Document 2008/xx.
- Dueck, L., P. Richard and S. Cosens. 2008. A review and re-analysis of Cosens et al. (2006) aerial survey assessment of bowhead whale abundance for the eastern Canadian Arctic. Canadian Science Advisory Secretariat. Research Document. 2007/080
- Ferguson, S.H. 2006. The Influences of environment, mating habitat, and predation on evolution of pinniped lactation strategies. Journal of Mammalian Evolution, 13: 63-82.
- Ferguson, S.H. and J.W. Higdon. 2006. How seals divide up the world: environment, life-history, and conservation. Oecologia, 150: 318-329.
- Ferguson, S.H., J. W. Higdon and S. Larivière. 2006. Does seasonality explain the evolution and maintenance of delayed implantation in the family Mustelidae (Mammalia: Carnivora)? Oikos, 114:249-256.
- Ferguson, S.H. and S. Larivière. 2008. How social behaviour links environment and body size in mammalian carnivores. Open Journal of Ecology, 1:1-7.
- Ford, J.K.B. 2006. An assessment of critical habitat of resident killer whales in British Columbia. Research Document 2006/072. Canadian Science Advisory Secretariat, Fisheries & Oceans Canada, Ottawa, ON.
- Ford, J.K.B. and G.M. Ellis. 2006. Selective foraging by fish-eating killer whales in British Columbia. Marine Ecology Progress Series, 316: 185-199.
- Ford, J.K.B., G.M. Ellis and J.W. Durban. 2007. An assessment of the potential for recovery of West Coast transient killer whales using coastal waters of British Columbia. Research Document 2007/088. Canadian Science Advisory Secretariat, Fisheries & Oceans Canada, Ottawa, ON.
- Ford, J.K.B. and R.R. Reeves. 2008. Fight or flight: antipredator strategies of baleen whales. Mammal Review, 38: 50-86.
- Ford, J.K.B. In press. Killer whale Orcinus orca. In: W.F. Perrin, B. Wursig and H.G.M. Thewissen (eds.), The Encyclopedia of Marine Mammals Second Edition. Elsevier, New York, NY.
- Ford, J.K.B. In press. Dialects. In: W.F. Perrin, B. Wursig and H.G.M. Thewissen (eds.), The Encyclopedia of Marine Mammals Second Edition. Elsevier, New York, NY.
- Ford, J.K.B. and G.M. Ellis. In press. You are what you eat: ecological specializations and their influence on the social organization and behaviour of killer whales. In: J. Yamagiwa and L. Karczmarski (eds.), Primates and Cetaceans: Field Studies and Conservation of Complex Mammalian Societies. Springer, New York, NY.
- Ford, J.K.B., A.L. Rambeau, R.M. Abernethy, M.D. Boogaards, L.M. Nichol and L.D. Spaven. 2008. An assessment of the potential for recovery of humpback whales off the Pacific coast of Canada. Canadian Science Advisory Secretariat, Research Document2008/0xx. Department of Fisheries and Oceans Canada, Ottawa, ON.
- Frouin, H., M. Lebeuf, R. Saint-Louis, M.O. Hammill, É. Pelletier and M. Fournier. 2008. Toxic effects of tributyltin and its metabolites on harbour seal (Phoca vitulina) immune cells in vitro. Aquatic Toxicology 90, 243–251.
- Gade, A., Harwood L., Melling H., Stern G., S.H. Ferguson. In press. Organochlorine contaminants in ringed seals (Phoca hispida) in the western Canadian Arctic: Trends with sea ice. Organohalogen Compounds, 70: XXX-XXX.
- Gajadhar, A.A., L.B. Forbes and L.N. Measures. 2006. Effect of salt water and chemical disinfectants on the sporulation and infectivity to Toxoplasma gondii oocysts. Proceedings of the American Association of Veterinary Parasitologists, 51st Annual Meeting, Honolulu, July 15-18.
- Gervaise, C., S. Vallez, Y. Stephan, C. Iaona and Y. Simard. 2007. Passive acoustic tomography: new concepts and applications using marine mammals. Journal of the Marine Biological Association of the United Kingdom, 87: 5-10.
- Gervaise, C., S. Vallez, Y. Stephan and Y. Simard. 2008. Robust 2D localization of low-frequency calls in shallow waters using modal propagation modeling. Canadian Acoustics, 36(1): 153-159.
- Gosselin, J.-F., M.O. Hammill and V. Lesage. 2007. Comparison of photographic and visual abundance indices of belugas in the St. Lawrence Estuary in 2003 and 2005. Canadian Science Advisory Research Document 2007/025.
- Gregr, E.J., L.M. Nichol, J.C. Watson, J.K.B. Ford and G.M. Ellis. 2008. Estimating carrying capacity for sea otters in British Columbia. Journal of Wildlife Management, 72: 382-388.
- Guinet, C., P. Domenici, R. de Stephanis, L. Barrett-Lennard, J.K.B. Ford and P. Verborgh. 2007. Killer whale predation on bluefin tuna: exploring the hypothesis of the endurance-exhaustion technique. Marine Ecology Progress Series, 347: 111-119.
- Hammill, M.O. and G.B. Stenson. 2006. Abundance of Northwest Atlantic hooded seals (1960 – 2005). DFO Canadian Science Advisory Secretariat Research Document, 2006/068. 19p.
- Hammill, M.O. and G.B. Stenson. 2006. Timing of whelping among Northwest Hooded seals. DFO Canadian Science Advisory Secretariat Research Document, 2006/069.
- Hammill, M.O., J.F. Gosselin and G.B. Stenson. 2007. Changes in abundance of grey seals in the NW Atlantic. Pages 99-115. In T. Haug, M. Hammill and D. Olafsdottir. (eds). Grey seals in the North Atlantic and the Baltic. NAMMCO Scientific Publication 6. 227 p.
- Hammill, M.O., J.W. Lawson, G.B. Stenson and D. Lidgard. 2007. Pup production of Northwest Atlantic grey seals in the Gulf of St. Lawrence and along the Nova Scotia Eastern Shore. DFO Canadian Science Advisory Secretariat Research Document, 2007/084.
- Hammill, M.O., V. Lesage, P. Richard and P. Hall. 2007. A response to ‘sentient beings and wildlife resources: Inuit, beluga whales and management regimes in the Canadian Arctic. Human Ecology, 35(5): 639-640.
- Hammill, M.O., L.N. Measures, J.-F. Gosselin and V. Lesage. 2007. Lack of recovery in St. Lawrence Estuary beluga. Canadian Science Advisory Research Document, 2007/026 :23 p.
- Hammill, M.O. and G.B. Stenson. 2007. Application of the precautionary approach and conservation reference points to management of Atlantic seals. ICES Journal of Marine Science, 64(4): 702-706.
- Hammill, M.O., G.B. Stenson, F. Proust, P. Carter and D. McKinnon. 2007. Feeding by grey seals in the Gulf of St. Lawrence and around Newfoundland. Pages 135-152. In: T. Haug, M. Hammill and D. Olafsdottir (eds.). Grey seals in the North Atlantic and the Baltic. NAMMCO Scientific publication 6. 227 p.
- Harris, L. 2007. Recovery Potential Assessment of Northern Bottlenose Whale, Scotian Shelf Population. Canadian Science Advisory Report. 2007/011.
- Harvey, V., S. D. Côté and M.O. Hammill. 2008. The Ecology Of 3-D Space Use In A Sexually Dimorphic Mammal. Ecography, 31: 371-380.
- Harwood, L.A., T.G. Smith and H. Melling. 2007. Assessing the potential effects of near shore hydrocarbon exploration on ringed seals in the Beaufort Sea Region 2003-2006. Environmental Studies Research Funds 162: 103 p.
- Harwood, L.A. and P. Sparling. 2008. Lake trout distribution and salinity: an assessment of the relative abundance and distribution of lake trout throughout Husky Lakes, 2001-2004. In: Mills, K. H., M. Dyck, and L. A. Harwood. 2008. Proceedings of the Second North American Lake Trout Symposium 2005, Yellowknife, Northwest Territories. Canadian Technical Report of Fisheries and Aquatic Sciences, 2778. 247 p.
- Harwood, L.A., A. Joynt and S. Moore. 2008. Bowhead whale feeding aggregations in the Canadian Beaufort Sea and their role in the mitigation of effects of seismic underwater noise. Working Paper /Presentation at the Review of Scientific Information on the Impacts of Seismic Sound on Fish, Invertebrates, and Marine Mammals, Workshop II, March 26-28, 2008, Ottawa, Ontario.
- Harwood, L.A., F. Pokiak and J. Walker-Larsen. 2008. Assessment of the subsistence fishery and biological data for Arctic cisco in Tuktoyaktuk Harbour, NT, Canada, 1997-1999. Canadian Management Report of Fisheries and Aquatic Sciences. 2845: ix + 31 p.
- Haug, T., G.B. Stenson, P.J. Corkeron and K.T. Nilssen. 2006. Estimation of harp seal pup production in the North Atlantic completed: results from surveys in the Greenland Sea in 2002. ICES Journal of Marine Science, 63(1): 95-104.
- Heide-Jorgensen, M.P., K.L. Laidre, M.V. Jensen, L.P. Dueck and L.D. Postma. 2006. Dissolving stock discreteness with satellite tracking: bowhead whales in Baffin Bay. Marine Mammal Science, 22: 34-45.
- Heise, K., J. Ford and P. Olesiuk. 2007. Marine mammals and turtles. In: Lucas, B.G., Verrin, S., and Brown, R. (eds). Ecosystem overview: Pacific North Coast Integrated Management Area (PNCIMA). Canadian Technical Report of Fisheries and Aquatic Sciences, 2667: xii + 104 p.
- Heise, K., L.G. Barrett-Lennard and J.K.B. Ford. 2008. Update COSEWIC Status Report on Killer Whales Orcinus orca. Prepared for the Committee on the Status of Endangered Wildlife in Canada.
- Hickie, B.E., P.S. Ross, R.W. Macdonald and J.K.B. Ford. 2007 Killer whales (Orcinus orca) face protracted health risks associated with lifetime exposure to PCBs. Environmental Science and Technology, 41(18): 6613-6619.
- Higdon, J. 2007. Status of knowledge on killer whales (Orcinus orca) in the Canadian Arctic. Canadian Science Advisory Research Document 2007/048.
- Higdon J.W., O.R.P Bininda-Emonds, R.M.D. Beck and S.H. Ferguson. 2007. Phylogeny and divergence of the pinnipeds assessed using a multigene dataset. BMC Evolutionary Biology, 7:216.
- Higdon, J.W., and S.H. Ferguson. In press. Sea ice declines causing punctuated change as observed with killer whale (Orcinus orca) sightings in the Hudson Bay region over the past century. Ecological Applications.
- Higdon, J.W., O.R.P. Bininda-Emonds, R.M.D. Beck, and S.H Ferguson 2008. Correction: Phylogeny and divergence of the pinnipeds (Carnivora: Mammalia) assessed using a multigene dataset BMC Evolutionary Biology, 8: 216.
- Koen-Alonso, M. and G. Stenson. 2006. Keystone species: definitions and related concepts in an applied context. Pg 9-20 in "Background scientific information for candidate criteria for considering species and community properties to be ecologically significant", J. Rice (Ed.). DFO Canadian Science Advisory Secretariat Research Document, 2006/089. 82 pp.
- Koschinski, S., B.M. Culik, E.A. Trippel and L. Ginzkey. 2006. Behavioral reactions of free-ranging harbor porpoises encountering standard nylon and BaSO4 mesh gillnets and warning sound. Marine Ecology Progress Series, 313: 285-294.
- Krahn, M.M., M.B. Hanson, R.W. Baird, D.G. Burrows, C.K. Emmons, J.K.B. Ford, L.L. Jones, D.P. Noren, P.S.Ross, G.S. Schorr, T.K. Collier and R.H. Boyer. 2007. Persistent organic pollutants and stable isotopes in biopsy samples (2004/2006) from Southern Resident killer whales. Marine Pollution Bulletin, 54(12): 1903-1911.
- Laidre, K.L., I. Stirling, L.F. Lowry, Ø. Wiig, M.P. Heide-JØrgensen, and S.H. Ferguson. 2008. Quantifying the sensitivity of Arctic marine mammals to climate-induced habitat change. Ecological Applications, 18: S97-S125.
- Lambourn, D.M., S.J. Jeffries, M.M. Lance, P.F. Olesiuk, S.A. Raverty and A.W. Trites. 2006. Blood analysis on free ranging Steller sea lions (Eumetopias jubatus). International Association for Aquatic Animal Medicine Conference, 6-10 May 2006. Nassau, Bahamas.
- Lapierre, J.L., J.F. Schreer, J.M. Burns and M.O. Hammill. 2007. Effect of Diazepam on heart and respiratory rates of Harbour seal pups following intravenous injection. Marine Mammal Science, 23(1): 209-217.
- Lawson, J., M. Hammill and G. Stenson. 2006. Characteristics for Recovery: Beluga Whale. DFO Canadian Science Advisory Research Document, 2006/075.
- Lebeuf, M., M. Noël, S. Trottier and L.N. Measures. 2007. Temporal trends (1987-2002) of persistent, bioaccumulative and toxic (PBT) chemicals in beluga whales (Delphinapterus leucas) from the St. Lawrence Estuary, Canada. Science of the Total Environment, 383: 216-231.
- Leblanc, E., M. Bahoura and Y. Simard. 2008. Comparison of automatic classification methods for beluga whales vocalizations. Journal of the Acoustical Society of America, 123: 3772.
- Ledwell, W., S. Benjamins, J. Lawson and J. Huntington. 2007. The most southerly record of a stranded bowhead whale, Balaena mysticetus, from the western North Atlantic Ocean. Arctic, 60(1): 17-22.
- Lesage, V., J. Keays, S. Turgeon and S. Hurtubise. 2006. Bycatch of harbour porpoises (Phocoena phocoena) in the gillnet fishery of the Estuary and Gulf of St Lawrence, 2000--2002. Journal of Cetacean Research and Management 8(1): 67-78.
- Lesage, V., J.-F. Gosselin, M.O. Hammill, M.C.S. Kingsley and J. Lawson. 2007. Ecologically and Biologically Significant Areas (EBSAs) in the Estuary and Gulf of St. Lawrence – A marine mammal perspective. Canadian Science Advisory Research Document 2007/046.
- Lewis, A.E., Hammill, M.O., Power, M., Doidge, D.W. and V. Lesage. In press. A comparison of eastern Hudson Bay beluga (Delphinapterus leucas) movement and aggregation patterns using satellite telemetry and traditional ecological knowledge. Arctic, 62 (1): 13-24.
- Lidgard, D. and W.D. Bowen. 2008. Behavioural interactions between predators and their prey in marine ecosystems. Canadian Science Advisory Secretariat Research Document, 2008/032
- Lidgard, D.C., D.J. Boness, W.D. Bowen and J.I. McMillan. 2008. The implications of stress on male mating behavior and success in a sexually dimorphic polygynous mammal, the grey seal. Hormones and Behaviour,53: 241-248.
- Lilly, G., K. Wieland, B. J. Rothschild, S. Sundby, K.F. Drinkwater, K. Brander, G. Ottersen, J.E. Carscadden, G.B. Stenson, G.A. Chouinard, D.P. Swain, N. Daan, K. Enberg, M.O. Hammill, A. Rosing-Asvid, H. Svedäng and A. Vázquez. 2008. Decline and Recovery of Atlantic Cod (Gadus morhua) Stocks throughout the North Atlantic. 2008. In G.H. Kruse, K. Drinkwater, J.N. Jianelli, J.S. Link, D.L. Stram, V. Wespestad, D. Woodby (ed.) Resiliency of Gadid stocks to fishing and climate change. AK-SG-08-01, 2008.
- Loseto, L., P. Richard, J. Orr, G. Stern, and S.H. Ferguson. 2006. Intrapopulation habitat selection by beluga whales in the eastern Beaufort Sea. Canadian Journal of Zoology, 84:1743-1751.
- Loseto, L.L., G.A. Stern, and S.H. Ferguson. 2008. Size and Biomagnification: How habitat selection explains beluga mercury levels. Environmental Science and Technology, 42: 3982-3988, 2008. 10.1021/es7024388.
- Loseto, L.L., G.A. Stern, D. Deibel, T.L. Connelly, A. Prokopowicz, D.R.S. Lean, L. Fortier, S.H. Ferguson. 2008. Linking mercury exposure to habitat and feeding behaviour in Beaufort Sea beluga whales. Journal of Marine Systems. 74: 1012–1024.
- Luque, S. P., J. Higdon and S. H. Ferguson. 2007. Dentine deposition rates in beluga (Delphinapterus leucas): an analysis of the evidence. Journal of Aquatic Mammals 33:241-245.
- Matkin, C.O., E.L. Saulitis, G.M. Ellis, P. Olesiuk, and S.D. Rice. 2008. Ongoing population-level impacts on killer whales Orcinus orca following the ‘Exxon Valdez' oil spill in Prince William Sound, Alaska. Marine Ecology Progress Series, 356: 269-281.
- Measures, L.. 2007. Proceedings of the workshop on the St. Lawrence Estuary beluga – review of carcass program. November 14 – 17, 2005. Canadian Science Advisory Secretariat Proceedings Series 2007/005.
- Miller, E. H., H.-C. Sing, V.D. Moulton, G.W. Miller, J.K. Finley and G.B. Stenson. 2007. Variation and integration of the simple mandibular postcanine dentition in two species of phocid seals. Journal of Mammalogy, 88: 1325–1334.
- Mills, K.H., M. Dyck, and L.A. Harwood. 2008. Proceedings of the Second North American Lake Trout Symposium 2005, Yellowknife, Northwest Territories. Canadian Technical Report of Fisheries and Aquatic Sciences, 2778. 247 p.
- Mooney T.A., W.W.L. Au, P.E. Nachtigall and E.A. Trippel. 2007. Acoustic and stiffness properties of gillnets as they rebate to small cetacean bycatch. ICES Journal of Marine Science, 64(7): 1324-1332.
- Morissete, L., M.O. Hammill and C. Savenkoff. 2006. The trophic role of marine mammals in the northern Gulf of St. Lawrence. Marine Mammal Science, 22(1): 74-103.
- Mos, L., B. Morsey, S.J. Jeffries, M.B. Yunker, S. Raverty, S. De Guise and P.S. Ross. 2006. Chemical and biological pollution contribute to the immunological profiles of free-ranging harbor seals. Environmental Toxicology and Chemistry, 25(12): 3110-3117.
- Mos, L., M. Tabuchi, N. Dangerfield, S.J. Jeffries, B.F. Koop and P.S. Ross. 2007. Contaminant-associated disruption of vitamin A and its receptor (retinoic acid receptor alpha) in free-ranging harbour seals (Phoca vitulina). Aquatic Toxicology, 81(3): 319-328.
- Nichol, L.M. 2007. Recovery Potential Assessment for Sea Otters (Enhydra lutris) in Canada. Canadian Science Advisory Research Document, 2007/034.
- Nielsen, O., G. Smith, H. Weingartl, S. Lair and L. Measures. 2008. Use of a SLAM transfected Vero cell line to isolate and characterize marine mammal morbilliviruses using an experimental ferret model. Journal of Wildlife Diseases 44: 600 - 611.
- Noren, S. R., D.J. Boness, S.J. Iverson, J. McMillan and W.D. Bowen. 2008. Body Condition at Weaning Affects the Duration of the Postweaning Fast in Gray Seal Pups (Halichoerus grypus). Physiological & Biochemical Zoology, 81: 269-277.
- Olesiuk, P.F. 2007. A Preliminary Assessment of the Recovery Potential of Northern Fur Seals (Callorhinus ursinus) in British Columbia. Canadian Science Advisory Secretariat Research Document 2007/076.
- Olesiuk, P.F. 2008. Abundance of Steller sea lions (Eumetopias jubatus) in British Columbia. Canadian Science Advisory Secretariat Research Document 2007/063.
- Olesiuk, P.F., D.G. Calkins, K.W. Pitcher, W.L. Perryman, C. Stinchcomb and M. Lynn. 2008. An evaluation of Steller sea lion (Eumetopias jubatus) pup counts from 35mm oblique photographs. Canadian Science Advisory Secretariat Research Document 2007/064.
- Pang, D.S.J., Y. Rondenay, L.N. Measures and S. Lair. 2006. The effects of two dosages of midazolam on short-duration anesthesia in the harp seal. Journal of Zoo and Wildlife Medicine, 37: 27-32.
- Pang, D.S.J., Y. Rondenay, E. Troncy, L.N. Measures and S. Lair. 2006. Use of end-tidal partial pressure of carbon dioxide to predict arterial partial pressure of carbon dioxide in harp seals during isoflurance-induced anesthesia. American Journal of Veterinary Research, 67: 1131-1135.
- Park, C.W., Y. Simard, M. Bahoura, J. Rouat and M. Sirois. 2006. The remote monitoring system for the buoy to localize the whale by Labview. Proceedings of the OCEANS'06 MTS/IEEE – Boston, IEEE Cat. No. 06CH37757C. ISBN: 1-4244-0115-1. IEEE, Piscataway, NJ, USA.
- Parsons, K.M., K.C. Balcomb III, J.K.B. Ford and J.W. Durban. In press. The social dynamics of southern resident killer whales and conservation implications for this endangered population. Animal Behaviour.
- Pitcher, K.W., P.F. Olesiuk, R.F. Brown, M.S. Lowry, S.J. Jeffries, J.L. Sease, W.L. Perryman, C.E. Stinchcomb and L.F. Lowry. 2007. Abundance and distribution of the eastern North Pacific Steller sea lion (Eumetopias jubatus) population. Fishery Bulletin, 150(1): 102-115.
- Pitman, R. L., H. Fearnbach, R. LeDuc, J.W. Gilpatrick Jr., J.K.B. Ford and L.T. Balance. 2007. Killer whales prey on a blue whale calf on the Costa Rica Dome: genetics, morphometrics, vocalizations and composition of the group. Journal of Cetacean Research and Management 9:151-157.
- Raverty, S., B. Hanson, D. Lamborn, J. Gaydos, M. Haulena, J.K.B. Ford, J. Calambokidis and P.S. Ross. 2007. An overview of emerging infectious and noninfectious diseases in the Northeastern Pacific Ocean. Working paper, Scientific Committee of the International Whaling Commission, SC/59/DW, 59th Annual Meeting, 7-18 May, 2007, Anchorage, AK.
- Riesch, R., J.K.B. Ford and F. Thomsen. 2008. Whistle sequences in wild killer whales (Orcinus orca). Journal of the Acoustical Society of America, 124: 1822-1829.
- Robbins, J., J. Barlow, A.M. Burdin, J. Calambokidis, P.J. Clapham, J.K.B. Ford, C.M. Gabriele, R. LeDuc, D. Mattila, T.J. Quinn II, L. Rojas-Bracho, J.M. Straley, J. Úrban, P. Wade, D. Weller, B.H. Witteveen, K. Wynne and M. Yamaguchi. 2007. Minimum estimates of humpback whale entanglement frequency in the North Pacific Ocean based on scar evidence. Working paper SC/59/BC, Scientific Committee, International Whaling Commission Meeting, Anchorage, AK May 2007.
- Ross, P.S. 2006. Fireproof killer whales: Flame retardant chemicals and the conservation imperative in the charismatic icon of British Columbia. Canadian Journal of Fisheries and Aquatic Sciences, 63: 224-234.
- Roy, N., Y. Simard and J. Rouat. 2008. Performance of three acoustical methods for localizing whales in the Saguenay-St. Lawrence Marine Park. Canadian Acoustics, 36(1): 160-164.
- Roy, N., Y. Simard, C. Bédard and E. Leblanc. 2008. Habitat occupation time-series of St. Lawrence belugas from passive acoustic monitoring. Journal of the Acoustical Society of America. 123: 3771-3772.
- Savenkoff, C., M. Castonguay, D. Chabot, A. Fréchet, M.O. Hammill and L. Morissette. 2006. Main prey and predators and estimates of mortality of Atlantic cod (Gadus morhua) in the northern Gulf of St. Lawrence during the mid-1980s, mid-1990s, and early 2000s. Canadian Technical Report of Fisheries and Aquatic Sciences 2666. 40pp.
- Savenkoff, C., D.P. Swain, J.M. Hanson, M. Castonguay, M.O. Hammill, H. Bourdages, L. Morissette and D. Chabot. 2007. Effects of fishing and predation in a heavily exploited ecosystem: Comparing periods before and after the collapse of groundfish in the southern Gulf of St. Lawrence (Canada). Ecological Modelling, 204:115-208.
- Savenkoff, C., M. Castonguay, D. Chabot , M. O. Hammill , H. Bourdages and L. Morissette. 2007. Changes in the northern Gulf of St. Lawrence ecosystem estimated by inverse modelling: Evidence of a fishery-induced regime shift? Estuarine, Coastal and Shelf Science, 73: 711-724.
- Savenkoff, C., L. Morissette, M. Castonguay, D.P. Swain, M. O. Hammill, D. Chabot, and J.M. Hanson. 2008. Interactions between marine mammals and fisheries: Implications for cod recovery. Pages 107-151. In: Ecosystem Ecology Research Developments (F. Columbus, ed.). Nova Science Publishers, Inc., New York.
- Shelton, P.A., B. Best, A. Cass, C. Cyr, D. Duplisea, J. Gibson, M. Hammill, S. Khwaja, M.A. Koops, K.A. Martin, R. O'Boyle, J.C. Rice, A. Sinclair, K. Smedbol, D.P. Swain, L.A. Vélez-Espino and C.C. Wood. 2007. Assessing recovery potential: Long-term projections and their implications for socio-economic analysis. Canadian Science Advisory Research Document, 2007/045.
- Simard, Y., N. Roy and C. Gervaise. 2006. Shipping noise and whales: world's tallest ocean liner vs. largest animal on earth. OCEANS'06 MTS/IEEE – Boston, IEEE Cat. No. 06CH37757C. ISBN: 1-4244-0115-1. IEEE, Piscataway, NJ, USA.
- Simard, Y., C. Bédard, X. Mouy and L. Fortier. 2006. Passive acoustic detection of bowheads, belugas and seals at Mackenzie Shelf break in Beaufort Sea during fall 2004. Arctic Net NSERC RCE Annual Science Meeting. Victoria, BC, 12-15 Dec.
- Simard,Y., M. Bahoura, C.W. Park, J. Rouat, M. Sirois, X. Mouy, D. Seebaruth, N. Roy and R. Lepage. 2006. Development and experimentation of a satellite buoy network for real-time acoustic localization of whales in the St. Lawrence. Proceedings of OCEANS'06 MTS/IEEE – Boston, IEEE, Piscataway, NJ, USA.
- Simard, Y. and A. Stepnowski. 2007. Classification methods and criteria. Chapter 5. In: Anderson et al. (eds.) Acoustic seabed classification of marine physical and biological landscapes. ICES Cooperative Research Report, No. 286. pp. 61-72.
- Simard, Y. and J.T. Anderson. 2007. Terms and acronyms. In: Anderson et al. (eds.) Acoustic seabed classification of marine physical and biological landscapes. ICES Cooperative Research Report, No. 286. pp. 147-151.
- Simard, Y., V. Lesage, J.-F. Gosselin, M. Hammill, N. Roy and C. Cyr. 2007. Impacts de la construction d'un port méthanier à Gros-Cacouna sur les mammifères marins. Secr. can. de consult. sci. du MPO. Rép. des Sci. 2007/010.
- Simard, Y. In press. The Saguenay-St. Lawrence Marine Park: oceanographic process at the basis of this unique forage site of Northwest Atlantic whales. Rev. Sc. Eau XX: XXX-XXX.
- Simard, Y. and L. Fortier. 2008. Listening at climate change in ice-covered seas: example with AURAL autonomous hydrophones in the Arctic. Proc. IEEE Oceans'08. MTS/IEEE - Quebec, IEEE, Piscataway, NJ. USA. 2p.
- Simard, Y. and N. Roy. 2008. Detection and localization of blue and fin whales from large-aperture autonomous hydrophone arrays: a case study from the St. Lawrence estuary. Canadian Acoustics, 36(1): 104-110.
- Simard, Y., N. Roy and C. Gervaise. 2008.Passive acoustic detection and localization of whales: effects of shipping noise in Saguenay-St. Lawrence Marine Park. Journal of the Acoustical Society of America, 123(6): 4109-4117.
- Simard, Y., N. Roy and C. Gervaise. 2008. Masking of blue and fin whales low-frequency vocalizations by shipping noise in the Saguenay—St. Lawrence Marine Park. Bioacoustics, 17: 183-185.
- Simard, Y., N. Roy, F.-J. Saucier, J. Gagné and S. Giard. 2008. Saguenay fjord entrance whale feeding ground: Acoustic study of sill dynamics and tidal aggregation of forage fish. Journal of the Acoustical Society of America, 123: 2992-2993.
- Simard, Y., and Sourisseau, M. In press. Diel changes in acoustic and catch estimates of krill biomass. ICES Journal of Marine Science XX: XX-XXX.
- Smedbol, R.K. 2007. Recovery Potential Assessment of western North Atlantic right whale (Eubalaena glacialis) in Canadian waters. Canadian Science Advisory Research Document, 2007/044.
- Sourisseau, M., Y. Simard and F.J. Saucier. 2006. Krill aggregation in the St. Lawrence system, and supply of krill to the whale feeding grounds in the estuary from the gulf. Marine Ecology Progress Series, 314: 257-270.
- Sourisseau, M., Y. Simard and F.-J. Saucier. 2008. Krill diel vertical migration fine dynamics, nocturnal overturns, and their roles for aggregation in stratified flows. Canadian Journal of Fisheries and Aquatic Sciences, 65: 574-587.
- Steiger, G. H., J. Calambokidis, J.M. Straley, L.M. Herman, S. Cerchio, D.R. Salden, R. Urbán, J.K. Jacobsen, O. von Ziegesar, K.C. Balcomb, C.M. Gabriele, M.E. Dahlheim, S. Uchida, J.K.B. Ford, P. Ladrón de Guevara, M. Yamaguchi and J. Barlow. 2008. Geographic variation in killer whale attacks on humpback whales in the North Pacific: implications for predation pressure. Endangered Species Research, 4: 247–256.
- Straley, J., J. Ford, G. Ellis, D. Matkin, V. Deecke and C. Gabriele. 2007. Prey preferences of mammal-eating killer whales in southeastern Alaska and British Columbia. Working paper submitted to Special Meeting on Killer Whales, Scientific Committee of the International Whaling Commission, SC/59/Rep 1, 59th Annual Meeting, 7-18 May 2007, Anchorage, AK.
- Stewart, R.E.A. S. E. Campana, C. M. Jones and B.E. Stewart. 2006. Bomb radiocarbon dating calibrates beluga (Delphinapterus leucas Pallas, 1776) age estimates. Canadian Journal of Zoology, 84(12): 1840-1852.
- Stenson, G. 2006. Estimating abundance of seals in the North Atlantic: designing and conducting a scientific assessment. pp. 47 -51. NAMMCO Conference on User Knowledge and Scientific Knowledge in Management Decision-Making, G. K. Hovelsrud and C. Winsnes, eds., Reykjavik, Iceland 4 – 7 January 2003.
- Stenson, G. B. 2006. Hunt induced mortality in northwest Atlantic hooded seals. DFO Canadian Science Advisory Secretariat Research Document, 2006/066.
- Stenson, G. B. and M.O. Hamill. 2006. Estimating consumption of Atlantic cod (Gadus morhua) by harp seals (Pagophilus groenlandicus) In: Report of the Workshop on the Decline and Recovery of cod Stocks throughout the North Atlantic, including tropho-dynamic effects (WKDRCS). ICES CM 2006/OCC:12 pp. 152-154.
- Stenson, G.B., M.O. Hammill, J. Lawson and J. F. Gosselin. 2006. 2005 Pup Production of Hooded Seals, Cystophora cristata, in the Northwest Atlantic. DFO Canadian Science Advisory Secretariat Research Document, 2006/067.
- Stenson, G. B. 2007. Current research on the impact of pinnipeds on commercial fish stocks in the Northwest Atlantic. NAFO SCR Doc. 07/49. Serial No. N5401.
- Tabuchi, M., A. Veldhoen, N. Dangerfield, S. Jeffries, C.C. Helbing and P.S. Ross. 2006. PCB-related alteration of thyroid hormones and thyroid hormone receptor gene expression in free-ranging Harbor Seals. Environmental Health Perspectives, 114(7): 1024-1031.
- Thomas, L, M.O. Hammill and W.D. Bowen. 2007. Estimated size of the Northwest Atlantic grey seal population 1977-2007. Canadian Science Advisory Research Document, 2007/082.
- Tollit, D.J, A.D. Schulze, A.W. Trites, P.F. Olesiuk, S.J. Crockford, T.S. Gelatt, R.R. Ream and K.M. Miller. In press. Development and application of DNA techniques for validating and improving pinniped diet estimates. Ecological Applications.
- Trites, A.W., V.B. Deecke, E.J. Gregr, J.K.B. Ford and P.F. Olesiuk. 2007. Killer whales, whaling, and sequential megafaunal collapse in the North Pacific: A comparative analysis of the dynamics of marine mammals in Alaska and British Columbia following commercial whaling. Marine Mammal Science, 23(4): 751-756.
- Trzcinski, M.K., R. Mohn and W.D. Bowen. 2006. Continued decline of the threatened Eastern Scotian Shelf Atlantic cod population: how important is grey seal predation. Ecological Applications, 16: 2276-2292.
- Tucker, S., W.D. Bowen and S.J. Iverson. 2007. Dimensions of diet segregation in grey seals Halichoerus grypus through stable isotopes of carbon (d13C) and nitrogen (d15N). Marine Ecology Progress Series, 339: 271-282.
- Tucker, S., W.D. Bowen and S.J. Iverson. 2008. Convergence of diet estimates from fatty acids and stable isotopes, support for long-term integration of natural diets within individual grey seals. Marine Ecology Progress Series, 354: 267-276.
- Tucker, S., W.D. Bowen, S.J. Iverson and G.B. Stenson. In press. Intrinsic and extrinsic sources of variation in the diets of harp and hooded seals revealed by fatty acid profiles. Canadian Journal of Zoology.
- Veinott, G. and B. Sjare. 2006. Mercury, cadmium, selenium, and seven other elements in the muscle, renal, and hepatic tissue of harbor seals from Newfoundland and Labrador. Bulletin of Environmental Contamination and Toxicology, 77(4): 597-607.
- Wade, P.R., V.N. Burkanov, M.E. Dahlheim, N.A. Friday, L.W. Fritz, T.R. Loughlin, S.A. Mizroch, M.M. Muto, D.W. Rice, L.G. Barrett-Lennard, N.A. Black, A.M. Burdin, J. Calamboikidis, S. Cerchio, J.K.B. Ford, J.K. Jacobsen, C.O. Matkin, D.R. Matkin, A.V. Mehta, R.J. Small, J.M. Straley, G.R. VanBlaricom and P.J. Clapham. 2007. Killer whales and marine mammal trends in the North Pacific – A re-examination of evidence for sequential megafauna collapse and the prey-switching hypothesis. Marine Mammal Science, 23(4): 766-802.
- Ward, E.J., K. Parsons, E.E. Holmes, K.C. Balcomb III and J.K.B. Ford. In press. The role of menopause and reproductive senescence in a long-lived social mammal. Frontiers in Zoology.
- Weir, J. N., S. P. Mahoney, B. McLaren, and S.H. Ferguson. 2007. Impact of mining on woodland caribou (Rangifer tarandus) in Newfoundland, Canada. Wildlife Biology, 13: 66-74.
- Wiig, Ø., E.W. Born, I. Gjertz, C. Lydersen, and R.E.A. Stewart. 2007. Historical sex-specific distribution of Atlantic walrus (Odobenus rosmarus rosmarus) in Svalbard assessed by mandible measurements. Polar Biology, 31(1): 69-75.
- Wolkers, H., M.O. Hammill and B. van Bavel. 2006. Tissue-specific accumulation and lactational transfer of polychlorinated biphenyls, chlorinated pesticides, and brominated flame retardants in hooded seals from the Gulf of St. Lawrence: Applications for monitoring. Environmental Pollution, 142(3): 476-486.
- Wolkers, H., F. Boily, F. van Bavel, M.O. Hammill, J. Fink-Gremmels and R. Primicerio. 2008.Tissue-specific contaminant accumulation and associated effects on hepatic serum analytes and cytochrome P450 enzymes activity in hooded seals (Cystophora cristata) from the Gulf of St. Lawrence: implications for effect studies. Archives of Environmental Contamination and Toxicology, DOI 10.1007/s00244-008-9186-6.
- Zwanenburg, K.C.T., A. Bundy, P. Strain, W.D. Bowen, H. Breeze, S.E. Campana, C. Hannah, E. Head, and D. Gordon. 2006. Implications of ecosystem dynamics for the management of the eastern Scotian Shelf. Canadian Technical Report of Fisheries and Aquatic Sciences, 2652: xiii, 91 p.
- Date modified: