
Center of Expertise in Marine Mammology: Scientific Research Report 2012-2014
Table of Contents
- Acknowledgements
- Message from the Director of CEMAM
- The 2013 High Arctic Cetacean Survey
- St. Lawrence Estuary Beluga
- Predator-borne Acoustic Transceivers and GPS Tracking Reveal Encounters with Acoustically Tagged Free-ranging Marine Fish
- Long-term Measures of Reproductive Performance Reveal Marked Variation in Fitness in Grey Seals
- Year-round Atlas of Shipping Noise: The PSSEL Model
- Climate Related Changes in the Quality and Availability of Land Fast Sea Ice Suitable for Breeding Ringed Seals Along the Coast of Labrador
- Belugas and Ringed Seals: Indicators of Ecosystem Change in the Beaufort Sea
- The Impact of Climate Change on Reproduction in an Ice-dependent Species, the Northwest Atlantic Harp Seal
- Publications 2012-2014
Acknowledgements
This publication was made possible by the many DFO marine mammal scientists from across Canada providing input and guidance. We acknowledge support staff, reviewers and all those who made valuable contributions toward the production of this publication. In addition, we thank Christine Abraham for her hard work in compiling the report. Specifically, we would like to thank the contributors who provided the text for this publication:
- Don Bowen, Research Scientist, Halifax, NS
- Thomas Doniol-Valcroze, Biologist, Mont-Joli, QC
- Mike Hammill, Research Scientist, Mont-Joli, QC
- Lois Harwood, Biologist, Yellowknife, NWT
- Véronique Lesage, Research Scientist, Mont-Joli, QC
- Yvan Simard, Research Scientist, Mont-Joli, QC
- Becky Sjare, Research Scientist, St. John’s, NL
- Garry Stenson, Research Scientist, St. John’s, NL
Message from the Director of CEMAM
The Centre of Expertise in Marine Mammalogy (CEMAM) is a virtual centre within the Department of Fisheries and Oceans Science sector involving some forty professionals and support staff located in five laboratories across the country, as well as at national headquarters. It was established in 2004, to promote collaboration, increase visibility and develop some critical-mass nationally within the Department’s science sector.
A key challenge in our science activities is to provide science advice to inform policy and programs for species ranging from those at risk to highly abundant species. Over the last couple of years, there have been important changes within CEMAM, as well as across the country in other sectors in the Department. While program review has modified our mandate and retirements have affected some of our research capacity, new researchers have joined CEMAM with new quantitative skills that are helping us to address new research challenges. These new challenges include collecting new data, as well as building new models or frameworks to improve our predictive capacity to evaluate potential impacts of increasing ocean noise levels on marine mammals, cumulative impacts of development, modeling predator-prey interactions and prey selection by marine mammals, and evaluating habitat needs for animals that in some cases involve large ocean basin features.
In Canada, many marine mammals are hunted commercially and for subsistence. They also generate considerable public interest as ‘charismatic megafauna’. The habitat needs of marine mammals extend across provincial, national and international boundaries. Their large size often limits the possibility of capture and handling, and their extensive movements result in several logistic challenges. In some cases, linking community observations from Inuit hunters with remote sensing imagery of ice conditions have provided insights into how the timing of beluga migrations have varied with climate change. At the other end of the scale, the deployment of satellite and acoustic transmitters independently or in collaboration with the Ocean Tracking Network (OTN) at Dalhousie University is providing insights into blue whale, narwhal, beluga and grey seal movements and diving activity as well as interactions with other components in the ecosystem similarly equipped with telemetry devices (e.g. Atlantic cod, Bluefin tuna, Atlantic salmon). In addition, our long-term studies, such as those monitoring harp seal productivity since the 1950s, and changes in grey seal juvenile survival rates and killer whale survival and productivity since the 1970s, are unique datasets related to the ecology of large, long-lived mammalian predators that are helping us to understand population responses to changes in environmental conditions.
One of CEMAM’s strengths is its high level of inter-regional collaboration. In part this is necessary because marine mammals often straddle regional boundaries, but collaborations often extend further. This was evident in the completion of the High Arctic Cetacean Survey (HACS) during August 2013, which involved 12 researchers from three laboratories from different provinces flying in three aircraft to execute the first ever comprehensive survey of narwhal and bowhead in Canada’s North and to analyse the data. Results from this survey have recently been peer-reviewed and will be provided to our northern clients (e.g. Inuit co-management boards) in the coming year.
In this our third report, we highlight some of CEMAM’s activities for 2012-2013-2014. We hope you find this summary from the CEMAM team both interesting and instructive.
Mike Hammill
Director, CEMAM
Maurice Lamontagne Institute
Mont Joli-QC
The 2013 High Arctic Cetacean Survey

Figure 1. The team of the 2013 High Arctic Cetacean Survey and one of the survey aircrafts (photo: P. Carter).

Figure 2. An example of the high-definition photographs taken by a belly-mounted camera in a Twin Otter flying at 1,000 feet. Inset is of zoomed-in-view of narwhals observed in Tremblay Sound (photo: DFO).

Figure 3. Map of survey effort (blue lines), narwhal sightings (red circles) and bowhead sightings (blue circles).
Thomas Doniol-Valcroze, Steve Ferguson, Jean-François Gosselin, Jack Lawson and Kevin Hedges
Numerous Inuit communities across the Canadian Arctic hunt narwhals and bowhead whales for subsistence, economic and cultural reasons. Sustainability of these important harvesting activities relies on obtaining up-to-date estimates of population abundance. Obtaining such estimates, however, is challenging because of the vast geographic areas to cover, and difficult Arctic weather conditions. Moreover, narwhals exhibit site fidelity by returning to the same summering areas every year, and therefore each of these summer stocks has to be surveyed to provide estimates that are meaningful to local hunters.
The purpose of the High Arctic Cetacean survey, a large-scale aerial survey conducted in the eastern Canadian Arctic in August 2013, was to obtain new abundance estimates of the Baffin Bay narwhal population and the Eastern Canada-West Greenland bowhead whale population. The last estimates were approximately 10 years old and known to be incomplete, given the broad spatial range of both populations. Never before had a survey counted all of the Canadian Baffin Bay narwhal stocks during one summer. We also wanted to obtain for the first time an estimate for the putative narwhal stocks found in the waters around Ellesmere Island.
The only way to achieve these ambitious goals within a short time window constrained by ice cover, weather conditions and whale migrations was to use three aircraft simultaneously, each with a full team of experienced observers and equipment operators. To make this possible, it was necessary to combine the resources of three regions of the Department of Fisheries and Oceans: Central & Arctic, Quebec, and Newfoundland & Labrador. Marine mammal specialists from all three regions were involved in every step of the project, from logistics and survey design to manning the planes and analyzing the data. In all, fifteen team members gathered at the Polar Continental Shelf Program base in Resolute on August 1st and began preparing the three aircraft for the survey (Figure 1). During the first two days, all observers were given extensive training sessions to familiarize themselves with the data collection protocols and included practice flights around Resolute.
Nunavut communities were involved at every step of the survey process. A visit was made to Grise Fiord in 2012 to collect local information on narwhal movements and distribution around Ellesmere Island, and four community members participated in a reconnaissance survey of the identified areas. Traditional knowledge on narwhal and bowhead whales all around Baffin Island was used in conjunction with previous aerial surveys and satellite telemetry studies to design the flight plans and determine the best order and timing of the different spatial components of the survey. During the survey, each of the plane crews included one Inuk as part of the four observers collecting sightings of whales. Moreover, members of the Hunter and Trapper Organizations in each community visited by the survey aircraft (Resolute Bay, Arctic Bay, Pond Inlet, Clyde River, Kugaaruk, Taloyoak, Hall Beach and Pangnirtung) took advantage of the opportunity to fly on the planes during surveys around their communities.
The aerial survey was flown at an altitude of 1,000 feet using three deHavilland Twin Otter 300 aircraft, each equipped with four bubble windows and a large belly window. Four observers were stationed at the windows, with a fifth team member acting as a navigator and camera operator. Sighting data were collected by two observers on each side to increase the probability of detecting narwhals and to improve precision of the survey results. In addition to visual observations, the three aircraft collected continuous photographic images using two digital cameras pointing downwards towards either side of the survey track line, taking pictures through the belly window (Figure 2). These geo-referenced images will be used to generate separate abundance estimates and will provide another means to estimate the proportion of whales missed by observers.
Between August 1 and August 26, the three teams flew for a combined total of 241 hours and surveyed the majority of the planned areas, covering the entire summering range of Baffin Bay narwhal stocks and most of the bowhead whale range (Figure 3), despite a late ice break-up and difficult weather conditions throughout the month. The flying sequence was designed to survey areas in order of priority while taking into consideration local knowledge of ice conditions. In an effort to avoid the effect of potential movements of whales between areas, we tried to survey each stratum in a day or two. For large or remote areas, this often required the use of two, sometimes all three aircraft simultaneously. Overall, the survey was extremely successful and represents DFO’s largest scale assessment of cetacean populations in the Arctic.
Processing of the survey data, which began in fall of 2013, involved transcribing, assembling and verifying the recordings made by the observers, mapping observations, assessing duplicate sightings and running statistical programs designed to best estimate narwhal and bowhead abundance. Additional analyses have been undertaken to improve the accuracy of the stock assessments, including re-analysing dive times from telemetry data to be able to correct estimates for whales that were submerged at the time the aircraft flew over and therefore could not be counted. The analysis of the visual survey data was presented at the annual meeting of the national marine mammal peer-review committee in the fall of 2014 and will yield new and updated abundance estimates of the five Canadian stocks of the Baffin Bay narwhal population and the Eastern Arctic-West Greenland bowhead whale population. The reading and analyzing of the 180,000 high-definition photographs is also underway and will take several more months to complete.
The abundance estimates for each narwhal stock and for the bowhead population will allow managers and stakeholders to determine how many whales can be hunted sustainably while decreasing the risk of local depletion of resources in each community.
St. Lawrence Estuary Beluga
Véronique Lesage
The St. Lawrence Estuary (SLE) beluga are listed as threatened under the Species at Risk Act; a Recovery Strategy is defined, and their summer Critical Habitat has been identified. A review of the SLE beluga status (2007) concluded that the population was stable over the period 1988-2006. However, in recent years there has been an increase in reports of death of young-of-the-year, and an apparent increase in adult female perinatal mortalities, suggesting that the status of SLE beluga may have changed.
In the fall of 2013, a thorough review of the available scientific information was conducted at the annual national marine mammal peer-review committee meeting to provide an update of the status of the SLE beluga population, in particular information on current population size and trends, an analysis of factors that are affecting the population trend, including recruitment levels, sources of mortality, environmental conditions, contaminant loads, and their potential impact on mortality and fecundity. This review, led by DFO, was the result of concerted efforts from over 20 scientists, approximately two-thirds of whom were from DFO.

Beluga adult and calf (photo: DFO).
This review confirmed that the SLE beluga population was stable or increasing at a slow rate until the beginning of the 2000s, and also appeared stable in terms of calf production, pregnancy rate, age structure, and adult mortality. During this period, environmental conditions such as sea ice and water temperature were favourable to an Arctic species, although several of the groundfish stocks, including known prey of beluga such as Atlantic cod, collapsed in the early 1990s. The lower-than-expected population growth observed during the 1990s suggests that food, environmental conditions or other factors were limiting population growth. Other limiting factors may include high contaminant loads, negative effects from marine traffic, or high mortality rate associated with occasional events such as toxic algal blooms. The relative importance of all these factors in limiting population growth is not known.
A model informed by various data sources suggests that the SLE beluga population began to decrease in the early 2000s. This decline was concomitant to an increased, and more variable newborn calf mortality with cascading effects on the reproductive pattern of females, and to an observed and predicted decrease in the number of younger age classes in the population. During this period, females having lost their calf became available for reproduction earlier than the normal 3-year cycle, resulting in years with over half of the mature females being pregnant at the same time. These peaks were usually followed by peaks of high newborn mortality. Based on the analysis of some ecosystem indices in the Gulf of St. Lawrence, this change in population dynamics coincided with a period of warming temperatures, decline in ice cover, negative spring herring and large demersal prey abundance indices, and change in indices of beluga diet. This period also followed one characterized by an exponential increase in some chemical substances such as polybrominated diethyl ethers (PBDEs) in beluga and their environment, and when these substances were at their maxima.

Beluga whale (photo: DFO).
The decrease in population size documented in recent aerial surveys appears to be a lagged response resulting from lower recruitment propagating through the population. Although the events that initially triggered this perturbation are not fully understood, the problem seems to have worsened in the last six years, following a harmful algal bloom of Alexandrium tamarense in the SLE beluga summer range, which probably played a major role in the high mortalities observed in 2008, on its own or in conjunction with other unfavourable environmental and anthropogenic factors. The 2010 and 2012 anomalies in the numbers of newborn calves washing ashore cannot be explained by higher calf production alone. These anomalies resulted from a combination of an increased calf production, and reduced calf survival, likely related partly to unfavorable environmental conditions for the species, although the mechanisms leading to these additional mortalities in newborn calves are not understood.
This review also suggests that SLE beluga live in an environment less favorable to an Arctic species since the late 1990s, also characterized by chronic exposure to potentially aggravating stressors such as marine traffic, persistent organic pollutants, and occasional toxic algal blooms.
Climate variability resulting, among other things, in increases in water temperature and associated declines in ice-cover may further affect this beluga population, for instance through changes in food resources and increases in inter-specific competition as other species expand their range due to loss of ice cover. In the short term, efforts can be directed towards reducing anthropogenic stressors such as disturbance in sensitive areas and critical periods for females and calves, chemical contamination, nutrient enrichment, habitat loss, and competition for food resources from fisheries. This underlines the importance of maintaining a critical population to withstand periodic downturns, in particular by addressing anthropological factors that could delay recovery.
Environmental shifts resulting in poor foraging conditions have been observed in other ecosystems and have resulted in several years of little or no population growth, for example, North Atlantic Right Whales in response to low copepod abundance; northern resident killer whales in the Pacific in response to declines in salmon abundance. However, observations from other systems also show that populations of long-lived mammals do respond to favourable conditions when they occur.
DFO continues to monitor the SLE beluga population dynamics, and trends in habitat quality, and contributes by its innovative research to further our understanding of the ecological needs of beluga, and the mechanisms of action and relative importance of current environmental stressors and to implement actions that are the most appropriate to help the recovery of this population.
Predator-Borne Acoustic Transceivers and GPS Tracking Reveal Encounters with Acoustically Tagged Free-ranging Marine Fish
W. Don Bowen, Lidgard, D.C., Jonsen, I., and Iverson, S. J.
There is increasing evidence that upper trophic level predators, such as seals, play an important role in shaping and stabilising ecosystem structure and functioning. Although technological advances in telemetry have led to a greater understanding of movement, foraging behaviour and habitat use of upper trophic level marine predators, still little is known about how marine mammals interact with their prey or competitors. The innovative use of location telemetry coupled with coded acoustic transmitters and transceivers, through a collaborative research program called the Ocean Tracking Network (OTN), promises to radically improve our understanding of predator behaviour and predator-prey interactions in the ocean.
The Ocean Tracking Network (OTN) is a $35 million Canada Foundation for Innovation (CFI) - International Joint Ventures Fund global research and technology development platform headquartered at Dalhousie University, Halifax, Nova Scotia, Canada, that aims to revolutionize the way oceans are viewed and understood. Through the CFI funding in partnership with NSERC and DFO, OTN is implementing a robust, open-access global infrastructure in Canada’s three oceans to establish a new and unique ocean observation system, one that is centered on scientifically documenting animal movements, habitat use, and survival in relation to changing physical, chemical and biological ocean conditions. Starting in 2008, OTN began deploying Canadian state-of-the-art acoustic receivers and oceanographic monitoring equipment in key ocean locations. “OTN Canada” is the seven-year Canada-wide integrative research network program that was funded beginning in January 2010 by the Natural Sciences and Engineering Research Council (NSERC) of Canada.
One of the Atlantic components of OTN is the use of grey seals (Halichoerus grypus) as “bioprobes” to collect both biological and physical data from the continental shelf off eastern Canada. Predator–prey interactions have important population and community level consequences that depend on the frequency of predator and prey encounters. Nevertheless, little is known about the spatial and temporal patterns of encounters between predators and prey in the ocean. Through the use of acoustic and satellite telemetry, a team of researchers from the Bedford Institute of Oceanography (BIO) and Dalhousie University have begun to collect data on the spatial and temporal pattern of grey seal encounters with Atlantic cod (Gadus morhua) and Atlantic salmon (Salmo salar). These fish species are of conservation concern and commercial interest and grey seal predation is hypothesized as one factor influencing recovery. Interactions among acoustically tagged grey seals and between grey seals and acoustically tagged tuna, a presumed competitor for prey, are also being revealed for the first time.

Figure 4. Adult male grey seal equipped with an Argos/GPS tag (head) and VMT (middle back) heading to sea at Sable Island, June 2014. (Photo: W. D. Bowen)
During the first four years of study (beginning in 2009), the VMT on 16 of 64 adult grey seals recorded detections from 17 adult Atlantic cod and 7 Atlantic salmon that had been implanted with coded acoustic tags (Figure 5). An examination of the temporal and spatial pattern of these seal−fish interactions suggested that one salmon and two cod might have been eaten. However, in addition to acoustic detection of prey, most of the acoustically tagged grey seals also detected one another. Over the first four years about 7,000 detections were recorded among tagged seals. Detailed analysis of the 2009 data revealed that these detections were not randomly distributed in space and time but preferentially occurred at offshore banks where feeding is presumed to mainly take place (Figure 6).
This research has two components. The first is to equip grey seals with an Argos satellite-linked and GPS location and behaviour tag and a Vemco mobile transceiver (VMT) that both receive and transmit coded acoustic messages (Figure 4). The second is to tag prey, such as Atlantic cod, with Vemco coded acoustic tags that identify individual fish through the transmission of unique acoustic messages. The VMT was programmed to transmit on an irregular schedule, every 60 to 180 s (to avoid VMTs transmitting at the same time and causing code collisions and false detections) and to remain in listening mode for the remainder of the time. Over the same period, a total of 623 Atlantic cod were tagged with a Vemco V13 acoustic transmitter in the southern Gulf of St. Lawrence and the Eastern Scotian Shelf, as were about 300 Atlantic salmon.

Figure 5. Distribution of fish deployments (Δ), grey seal−fish encounters (o) and movement tracks (light blue) for 16 grey seals on the Eastern Scotian Shelf and in the southern Gulf of St. Lawrence from 2010 to 2012. Atlantic cod are represented by orange symbols, Atlantic salmon smolts by red and Atlantic salmon kelts by yellow. The white arrows indicate the location of a possible predation event.

Figure 6. Location of associations between grey seals for A) all seals (n = 14), B) seal 98430 and C) seal 98428. Figures B) and C) are examples to illustrate the correlation between location of associations, bathymetry and seal behaviour. Pr(ARS behaviour) is a continuous measure (0 to 1) of the probability of exhibiting area-restrictive search behaviour (an indication of foraging) according to the hidden Markov model.
The need to recover the VMT for data retrieval has limited deployments to locations where confidence in instrument recovery is high, such as Sable Island, and has thus restricted both species and areas where this tag could be used. To overcome these limitations, a Bluetooth link was integrated into the VMT and GPS-satellite linked transmitter through a partnership with SMRU Limited, St. Andrews, Scotland and Vemco, Canada. The two-unit design allows data collected by the VMT to be transmitted via Bluetooth to the satellite transmitter, which relays the data to the ARGOS satellite system for retrieval. To evaluate in-situ performance, units were deployed on two adult female grey seals on Sable Island, NS in October 2012 and recovered during the subsequent breeding season. Data archived by the VMT were compared with data uploaded via ARGOS and found to be for all intentions identical. In July 2013, eight Bluetooth VMTs were deployed in the Gulf of St. Lawrence and another five were to be deployed in 2014.
Researchers have demonstrated that a novel combination of acoustic transceivers and ARGOS/GPS technology can be used to determine the spatial and temporal pattern of interactions between grey seals and fish species in two large marine ecosystems, the Eastern Scotian Shelf and the southern Gulf of St. Lawrence, Canada.
Long-term Measures of Reproductive Performance Reveal Marked Variation in Fitness in Grey Seals
Bowen, W. D., den Heyer, C. E., McMillan, J. I., Lang., S., Lidgard, D.C. and Iverson, S. J.
Marine mammals are long-live vertebrates with delayed maturation and low reproductive rates. Therefore, long-term studies are needed to understand both the sources and extent of variation in reproductive success among individuals and the effect of this variation on population dynamics. We studied the number and weaning mass of offspring of 619 known-age, grey seal (Halichoerus grypus) females annually between 1978 and 2012 (Figure 7). Individual females varied significantly in reproductive quality. The percentage of females that failed to produce offspring increased with population density. Modal number of births by individual females was 20, but varied from 1 to 30 in 242 females aged 25 years or greater. Number of offspring produced was negatively correlated with age at primiparity, but positively correlated with age at last birth (Figure 8), underscoring the influence of longevity on fitness. Individual variation in maternal quality, as judged by birth rate, was not significantly correlated with maternal energy investment during lactation (i.e., mean weaning mass of offspring) for 212 females in which three or more of their pups had been weighed at weaning. Our long-term study reveals considerable heterogeneity in reproductive performance among females. Such heterogeneity has implications for understanding the response of populations to environmental forcing.

Figure 7. Adult female grey seal with her pup just prior to weaning at about 18 days after birth. (Photo: W.D. Bowen).

Figure 8. Relationship between longevity and the number of pups produced by grey seal females at Sable Island.
Year-round Atlas of Shipping Noise: The PSSEL Model
Yvan Simard, Nathalie Roy, Florian Aulanier, Cédric Gervaise
The main source of anthropogenic noise in ocean is shipping. World shipping has increased at a high rate in both size and number of ships since the 1960s. Because shipping noise is peaking at the low frequencies that propagate over large distances (> 100 km), low-frequency ocean noise is expected to have increased in the northern hemisphere shipping belt, in proportion to world shipping growth and economic activity. The potential adverse effects of increasing underwater noise on marine life and ecosystems have attracted the attention of the scientific community, regulators and the International Maritime Organization.
Numerical modeling and software tools have been proposed to assist in the estimation shipping noise threat for marine organisms, notably using shipping traffic distribution. For instance, accurate maps of shipping noise are needed for marine spatial planning in support of ocean activity regulation. This request may seem straightforward and simple but its proper response for sound management decisions represents a tremendous task (Figure 9). The quality of the response can be judged with: a) the capacity of the modeling to adequately replicate in situ measurements; b) the adequate spatial resolution of the whole modeling process to properly account for the high propagation loss close to the sources and small-scale environmental gradients (i.e. chosen mesh size of inputs and mapping grid); c) the temporal resolution, notably over the annual cycle for seasonally varying environments such as Canadian three-ocean waters; and d) the capacity of providing meaningful metrics for management decisions, such as the complete probability distribution of the values, their temporal breakdown for time budgets, and not only central statistics such as the mean value, which cannot provide the needed proportion of time that critical high levels are encountered.

Figure 9. Flowchart of the several steps involved in generating accurate 2D or 3D maps of probability metrics of shipping noise exposure.
Green: raw inputs;
violet: processed input for ship spectral source levels (SSL) and maps of shipping traffic density per ship type;
orange: sound propagation loss model;
red: PSSEL model of probability of shipping noise exposure;
blue: family of maps of the shipping-SEL (SSEL) occurring over selected percentiles of time;
burgundy: family of maps the percentage of time selected SSELs are exceeded.
The ongoing probabilistic shipping sound exposure level (PSSEL) project was launched in 2012 to develop a new shipping noise modeling and mapping approach to provide adequate and efficient tools to respond to the above needs for assessing conditions presently prevailing in Canadian waters and expected in the near future with increasing shipping activities, notably along projected new routes in Canadian Arctic and Subarctic.
The St. Lawrence Seaway in the ~300-m deep Lower St. Lawrence Estuary (Figure 11), where several marine mammals are encountered year-round or seasonally, is taken as pilot region for developing the PSSEL model. An underwater acoustic observatory called AS4 (for Acoustic Surveillance of Seaway and Ship Signatures) was deployed along the in-going lane of the St. Lawrence Seaway rail (Figure 11) and operated for one year in 2012-2013 to measure ship spectral source levels (SSL) of the present merchant fleet, following ANSI protocol (Figure 9, left violet box). The shipping traffic was monitored from the Canadian Coast Guard networks of AIS (Automatic Identification System) antennae deployed in southern Canadian waters (Figure 11) for 12 months in 2013, which provided the ship characteristics and their locations with high resolutions in time and space (Figure 10). These AIS data were used to compute a year-round shipping traffic atlas per ship type, length and speed with a monthly scale (Figure 9, right violet box). Both shipping traffic density and SSL data bank are feeding the PSSEL modeling. The third and last input to the PSSEL model is the acoustic propagation loss from the sources (i.e. ships), which can come from the output of one of several simple or complex propagation models that are fed with the characteristics of the propagation medium, with its bathymetry and bottom geological structure (Fig. 9, orange box).
Preliminary results of the PSSEL model applied to the 2013 summer traffic in the Lower St. Lawrence Estuary illustrate the importance of taking into account the complete probability of the shipping sound exposure level (SSEL) to assess the shipping noise and its impact on marine life. As a corollary, it illustrates the low relevance of central metrics averaged over long periods and coarse grids for realising such a task. Maps of the percentage of time the SSEL exceeds given levels, which the PSSEL model algorithm is able to efficiently compute, appear very helpful to rapidly assess the hottest and coldest areas in marine spatial planning. The PSSEL model was used in forecasting mode to simulate a traffic increase with a realistic traffic composition for the pilot area. Such simulations are in the process of implementation for expected new routes in Canadian Arctic and Subarctic.

Figure 10. Examples of 1-km resolution AIS shipping traffic maps for 2013 on Western and Eastern Canadian waters (from Simard et al. 2014b, c).

Figure 11. Example of the computation flowchart of the ANSI third-octave SSL for 5 isolated ships crossing the AS4 acoustic observatory in St. Lawrence Seaway off DFO-MLI on 21 November 2012 and respecting the imposed conditions.
Climate Related Changes in the Quality and Availability of Land Fast Sea Ice Suitable for Breeding Ringed Seals Along the Coast of Labrador
Becky Sjare
Ringed seals are a key species in seasonally ice-covered Arctic marine ecosystems because they link the aquatic food web to higher level predators such as polar bears, arctic fox and ravens. In addition, they are an important country food for Inuit in northern communities and are also of cultural significance. Ringed seal pups are born in a snow cave (lair) constructed by the female near a well-drifted pressure ridge or ice hummock of rough ice. The lair provides much needed shelter from the cold temperatures as well as helps protects the pup from predation. Adequate snow cover and appropriate ice roughness have been correlated with increased survival of ringed seal pups. Ice that is too smooth does not allow adequate snow drift development for the proper construction of the lair and extremely rough ice is often too thick and potentially to too mobile for the females to effectively maintain the lair and ensure the pup is not crushed by the ice.
A GIS-based model that uses RADARSAT satellite imagery (24m resolution; Figures 12 and 13) of land fast ice has been developed to quantify changes in the availability of quality ringed seal pupping habitat along the coast of Labrador. Three core study sites were located in the vicinity of Nain, Hopedale and Rigolet (2001-2013) and four in more northern fjord areas (Nachvak, Saglek, Hebron and Okak; 2008-2013). Most recently, exploratory research is ongoing at sites near the Belcher Islands and in the eastern James Bay region of Hudson Bay (2012-2013). The key land fast ice parameters used by the model to identify quality habitat included the presence, concentration and distribution of rough ice. Although various analyses are ongoing, for areas of the coast that generally have the highest availability of quality pupping habitat, it is apparent that in some years pack ice surges very close to shore compressing favorable rough ice habitat into a narrow band. In other years when wind forcing on the pack ice is minimal, freezing occurs quickly and a near solid sheet of smooth ice extends right out to the edge of the pack ice – again minimizing the availability of useable rough ice. There is evidence of these two unfavorable types of scenarios occurring in 2001, 2002 and 2004-06 and 2010.
This research will provide a comprehensive geographic perspective of changing land fast ice for coastal Labrador as well as a comparative glimpse at sites in eastern Hudson Bay. In the future, it may allow researchers to quantitatively link the reproductive productivity of seals to changing habitat availability and/or quality. These new data will also provide the opportunity to both identify areas of land fast ice that may be especially vulnerable to climate related changes along the coast of Labrador and to better understand what this may mean for successful ringed seal production in the future. The USA has recently listed the Arctic sub-population of ringed seals as threatened under their Endangered Species Act based on medium and longer term projections of sea ice deterioration in Arctic regions. This development emphasizes the importance of understanding and predicting the relationship between changing sea ice habitat and ringed seal productivity in Canada’s northern waters.
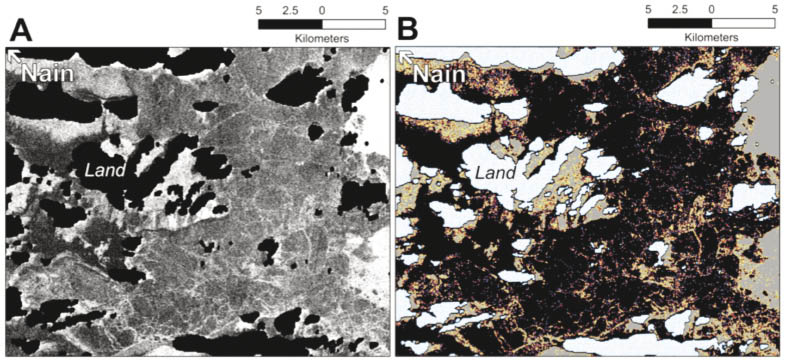
Figure 12.
(A) A near raw RADARSAT-1 image of the Nain, Labrador study area recorded on 18 March 2003. In this image land masses are intense black and the heavy pack ice along the eastern edge of the frame is bright white. Dark to intermediate grey areas identify relatively smooth ice while the brighter white spots and bright linear structures highlight moderately rough ice including ice hummocks and pressure ridges. To produce the habitat suitability map (B), a neighbourhood focal statistic (ArcGIS 2010) was used to calculate the amount of rough ice around individual pixels in the image. In this image the color legend is as follows: white with blue speckle = land; black = smooth ice (generally unsuitable habitat); blue = light rough ice (useable); red = moderate rough ice (prime pupping habitat); yellow = heavy rough ice (useable); grey = rubble or pack ice (generally unsuitable). Ice conditions were favorable for ringed seals in the Nain area in 2003 (one of the better years in the time series) with 30% of the habitat being classified as prime or useable and 48% and 22% being too smooth or rough respectively. Images are displayed north-up.
Color legend: white with blue speckle=land; black = smooth ice (generally unsuitable habitat); blue = light rough ice (useable); red = moderate rough ice (prime pupping habitat); yellow = heavy (useable); grey = rubble or pack ice (generally unsuitable).
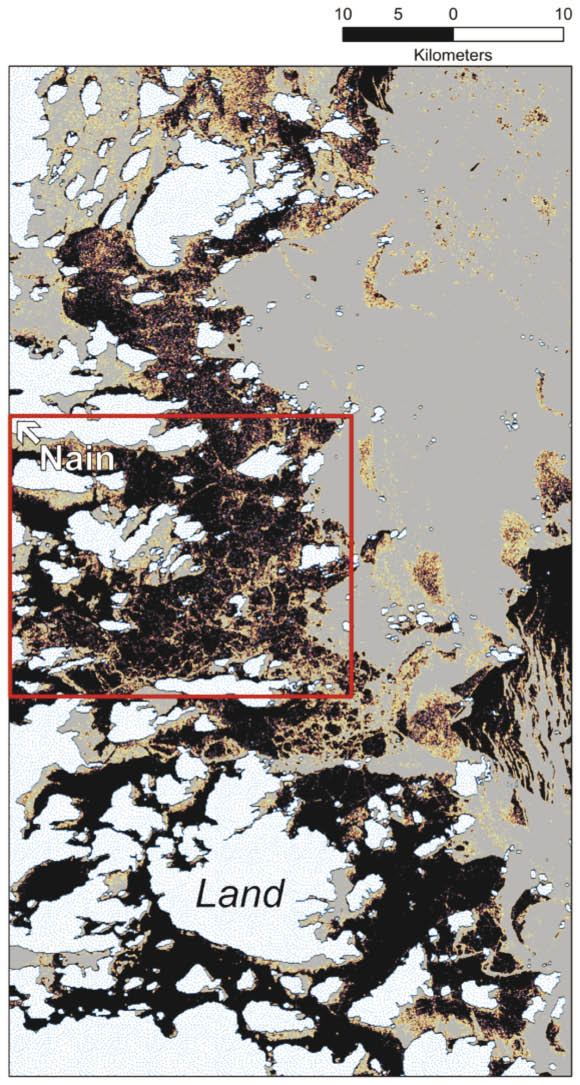
Figure 13.
Results of a habitat suitability map of ringed seal pupping habitat covering a larger geographic area (~ 3400 km2). The area inside the red box represents the core area shown in Figure 12A & B. The good correspondence between key ice features in each of the two images indicates that the current version of the model can be successfully scaled to a larger geographic area. The red arrows identify examples of important pressure ridges that characterize prime pupping habitat.
Color legend: white with blue speckle=land; black = smooth ice (generally unsuitable habitat); blue = light rough ice (useable); red = moderate rough ice (prime pupping habitat); yellow = heavy (useable); grey = rubble or pack ice (generally unsuitable).
Belugas and Ringed Seals: Indicators of Ecosystem Change in the Beaufort Sea

A hunter enjoying freshly cooked muktuk at the whaling camp at Baby Island, Mackenzie Delta, NT (photo: DFO).
Lois Harwood
As long-lived and wide-ranging oceanic predators, marine mammals can act as indicators of the state of the ecosystem, providing evidence of changes to the food web and ecosystem structure. They often first respond to ecosystem variation with changes in body condition, a direct link to the year-to-year availability and quality of their prey. Changes in condition can eventually affect reproduction, growth rates and survival of individuals, and impact marine mammal populations.
Belugas
The Beaufort Sea stock of belugas winters in the Bering Sea, and each spring migrates along the north coast of Alaska to summering areas in the Mackenzie Estuary, as well as the offshore Beaufort Sea and Amundsen Gulf. This stock is shared with Alaska and Russia, and is the second largest in Canada. The stock was last assessed by DFO as stable or increasing.
Belugas aggregate in the warm, shallow waters of the Mackenzie River estuary during summer, during which time they are the subject of a sustainable, subsistence harvest by the Inuvialuit of the Western Canadian Arctic. Subsistence-harvested belugas have been measured and sampled since 1980. Our study objectives, using harvest monitor-collected data on the sex, length, age and blubber thickness of landed belugas, were to examine beluga growth rates and blubber thickness, specifically for indications of temporal trends which could ultimately be linked to environmental change.
Our analyses revealed there has been a subtle (0.08% per year), but sustained decline in beluga growth rates, 1.75% over the time series from 1988-2008. Also, of 300+ male belugas landed between 2000 and 2007, there was significant variation in blubber thickness among years, with belugas being thinnest in 2005. This, along with subtle changes in growth of the belugas over the time series, may be a reflection of ecosystem changes that are negatively influencing the availability or quality/quantity or distribution of their prey.
Ringed Seals

Ringed seal (photo: DFO)
We also obtained measurements and samples from ringed seals taken in the subsistence harvests near Ulukhaktok, NT, formerly known as Holman. We worked with our seal monitor at this location, John Alikamik, and his family, since the beginning of the study. The seal harvest in this area is the largest and most predictable in the western Canadian Arctic, and provides the best opportunity to obtain adequate sample sizes on a reliable, long-term basis. We examined the relationship between body condition, reproduction (ovulation rate, percent pups in harvest) and sea ice in a time series from 1992-present, building on work started in this area in the 1970s through similar collaborations among hunters and DFO scientists. A subsistence harvest-based sample of approximately 100 seals per year was obtained annually during 1992-2011, from the family’s traditional hunting camp located on the northwest shore of west Prince Albert Sound, 5 km from east Amundsen Gulf. The results from 2 decades of monitoring revealed two main findings. First, there was a temporal, statistically significant trend of decreasing mean annual body condition of ringed seals (using an index of length, mass, fat depth: adults) beginning in 1994, and detected in adult males, adult females and subadults.
A second and parallel result was that body condition of the seals was negatively correlated with the timing of fast ice clearance in spring, obvious during extreme ice years. Failure to ovulate was striking in the most extreme late ice clearance year in our series, 2005, when only 30.0% of the mature adult females sampled ovulated. This came at a time when seal body condition indices and percent pups in the harvest were among the lowest annual values, and when spring ice clearance in Amundsen Gulf was delayed by more than five weeks compared to the 1992-2011 average. While the seal population in this core habitat appears to recover from natural and extreme-year fluctuations over four decades in this and previous studies, the possible magnified effect of several consecutive extreme ice years, compounded by the simultaneous occurrence of the temporal decline in seal body condition, is of particular concern.
Indications of Ecosystem Change
Concurrent declines in growth, condition and/or reproduction in ringed seals and belugas suggest that changes that are occurring in the Arctic marine ecosystem. Results can be augmented further with published and anecdotal observations from other species (concurrent studies/observations are available for black guillemots, polar bears, Arctic char, bowhead whales) which are indicating environmental change relating to prey shifts and/or changes in distribution. Belugas and ringed seals are excellent indicator species for measuring environmental change. Concurrent changes in belugas and seals, based on 2-decades of consistent, robust monitoring, are particularly informative as this link appears to indicate subtle climatic/oceanographic changes are occurring lower in the trophic pyramid, and this could have cascading and profound ecosystem impacts, and would be difficult or impossible to study by other methods.
Continued Research
To further our understanding of ecosystem change, it is important to continue, among studies of other species, monitoring of beluga growth and ringed seal body condition through long-term, standardized monitored of subsistence-harvested specimens. This, paired with direct (stomach contents) and indirect (isotopes, fatty acids) monitoring of diet, and detailed study of movements and seasonal ranges through telemetry, will refine our understanding of the possible prey shifts and critical habitats used by these marine mammals. Ultimately, this would be coordinated with biophysical and oceanographic sampling, at spatial and temporal scales, and geographic locations, that are relevant to the home range, critical habitats and prey of marine mammals.
The Impact of Climate Change on Reproduction in an Ice-dependent Species, the Northwest Atlantic Harp Seal
Garry Stenson
Trends in populations are influenced by changes in reproduction that are the result of a complex interaction between intrinsic factors related to changes in population (i.e., density dependent) and extrinsic factors driven by environmental variability (i.e., density independent). As species encounter changing environmental conditions as a result of climate change, understanding the influence of these different factors becomes critical if we wish to predict how a species will respond. Unfortunately, determining the relative importance of these different factors is difficult for most species as they require extensive, long term measurements of reproductive rates, population size, and a variety of environmental factors. Notwithstanding these challenges, gaining an understanding of the factors that influence reproduction is important as environmental conditions throughout the world are changing rapidly, particularly in Arctic and sub-Arctic areas. Perhaps the most dramatic have been the reductions in sea ice extent. As the earth continues to warm, these alterations in the sea ice will continue, resulting in serious impacts on a number of species that inhabit ice-covered areas for reproduction and/or feeding during all, or part of the year.
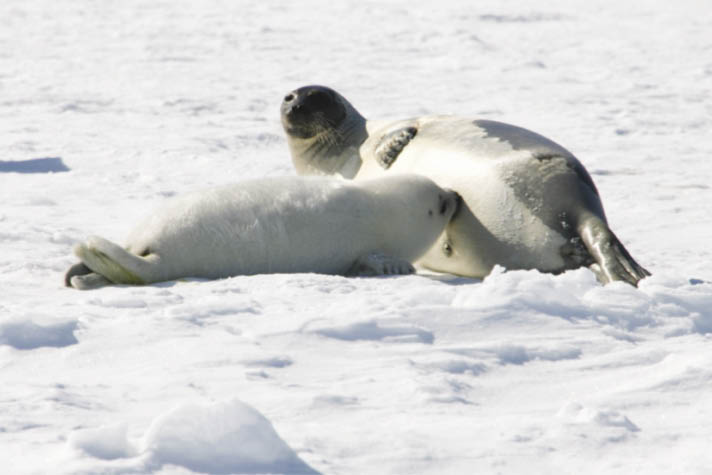
Harp seal mother feeding her pup, March 2012. Photo: Garry Stenson
Harp seals (Pagophilus groenlandicus) are the most abundant marine mammals in the North Atlantic. They are an ice-dependent species, giving birth and nursing their pups on pack ice each spring. Their annual movements appear to follow the development and retreat of the ice pack, and these seals are often seen feeding along the ice edge throughout the year. The Northwest Atlantic population ranges from the eastern Canadian Arctic and Baffin Bay in the north to the Gulf of St. Lawrence in the south. Each spring they give birth on the pack ice of the Gulf of St. Lawrence or off the coast of southern Labrador and northeastern Newfoundland.
Although water temperatures have varied historically, over the past four decades there has been a trend towards warmer water temperatures. As a result, there has been a decline in sea ice extent and coverage. Poor ice conditions have been shown to impact harp seals directly by increasing mortality of young-of-the-year seals who need stable ice for nursing and later for resting during their post-weaning fast. If the ice is not extensive or thick enough, winter storms can break up the ice forcing the young seals into the water where they can drown. Additionally, these changes in ice quality and extent can also induce changes in the ecosystem which can impact harp seals indirectly by influencing prey availability and subsequent reproductive success.
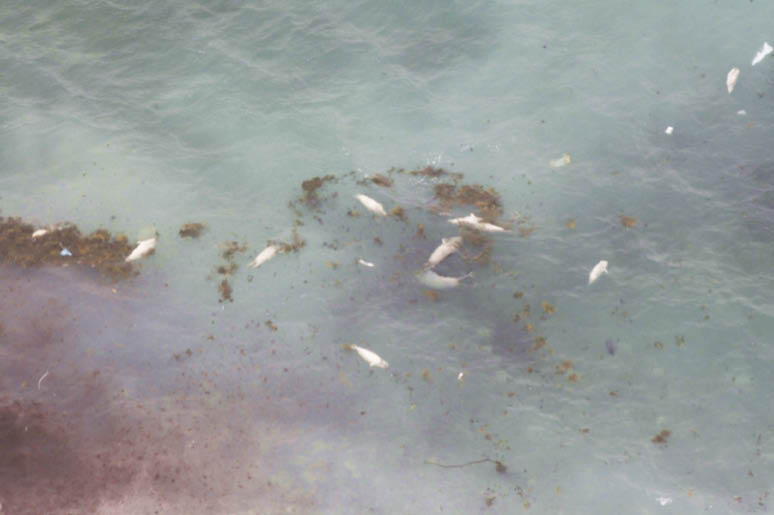
White-coated harp seals that drowned due to the breakup of the sea ice upon which they were born. Photo: Garry Stenson
To determine if environmental changes are impacting the reproductive success of harp seals, late-term pregnancy and abortion rates of Northwest Atlantic harp seals were estimated from female harp seals collected between 1954 and 2014 off Newfoundland and southern Labrador. Most of these samples were collected by hunters who are part of a cooperative science programme with the Marine Mammal Section that has been in place since the late 1970s. In some areas we are working with the third generation of collectors from the same family. During the winter, hunters collect seals and freeze them whole until DFO personal can visit to carry out necropsies. At that time, the seals are thawed, and we collect morphometric measurements and biological samples to determine reproductive status, age, and recent diets. All of the hunters have also been trained to collect and preserve the samples if they hunt in the spring. This long term data series allows us to examine the importance of various factors that influence reproduction in Northwest Atlantic harp seals.
Since the early 1980s, pregnancy rates have declined (Figure 14), while inter-annual variability increased, with late-term pregnancy rates among mature females falling to less than 30% in 2011. Comparing the reproductive data to a variety of concurrent environmental and biological factors, we found that while the general decline in fecundity is associated with increased population size, including late term abortion rates in the analysis explained much of the large inter-annual variability (Figure 15). Changes in abortion rates can be described by a model that incorporated late January ice cover and capelin biomass; it is likely that ice cover is also a proxy for ecosystem changes in prey availability or abundance.
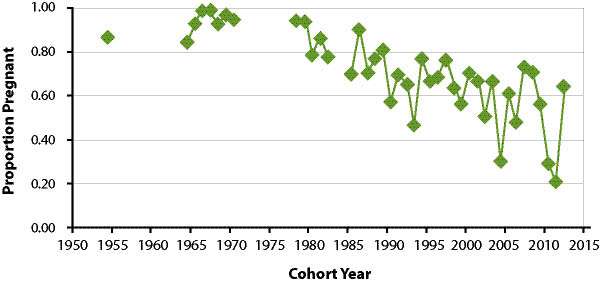
Figure 14. Proportion of mature northwest Atlantic harp seal females that are pregnant (fecundity) for the period 1954 to 2014.
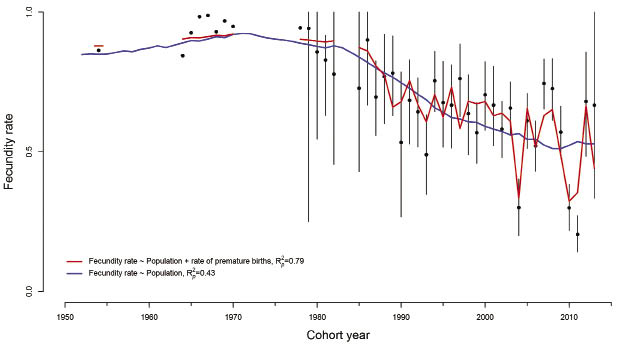
Figure 15. Results of models to examine the influence of biological and environmental factors on pregnancy rates of mature harp seals (fecundity) in the Northwest Atlantic. The best model (red) incorporates changes in harp seal population size and late abortion rates.
Thus it appears that harp seal reproductive rates are extremely sensitive to inter-annual variation in the biological and physical environment during periods of high seal abundance. Although environmental conditions varied while the population was relatively low during the 1970s and early 1980s, fecundity remained high. By the late 1980s, however, poor ice conditions and low capelin abundance resulted in high abortions rates and as a result, low fecundity.
Climate change models predict that the warming trend seen in the Gulf of St. Lawrence and Newfoundland waters will continue and that there will be greater inter-annual variability in environmental conditions. If correct, future climate-related impacts on harp seals will be unpredictable, but generally negative; pup mortality will likely be high, and reproductive rates will remain, on average, relatively low and highly variable. Given the highly variable annual pregnancy rates we have seen, continued effort to obtain accurate estimates is critical for assessing this population to determine harp seals’ future population responses in a changing environment. As a key component of the Northwest Atlantic ecosystem, such responses could have significant impacts on other species that harp seals consume or with whom they compete.
Publications 2012-2014
- Abraham, C.L. 2012. 2011 Harvest Attributions for Baffin Bay Narwhals. DFO Can. Sci. Advis. Sec. Res. Doc. 2012/073. v + 18 p.
- Addison, R.F., Muir, D. C., Ikonomouc, M.G., Harwood, L. Smith, T. G., and Alikamik, J. 2014. Temporal trends in “legacy” organochlorine contaminants in blubber of ringed seals (Phoca hispida) from Ulukhaktok, NT, Canada between 1972 and 2010. Science of the Total Environment 466-467: 564-576. http://dx.doi.org/10.1016/j.scitotenv.2013.07.079
- Alava, J. J., P.S. Ross, C. Lachmuth, J.K.B. Ford, B.E. Hickie, and F.A.P.C. Gobas. 2012. Habitat-based PCB environmental quality criteria for the protection of endangered killer whales (Orcinus orca). Environmental Science and Technology 46:12655-12663
- Alter, S. Elizabeth, Howard C. Rosenbaum, Lianne D. Postma , Peter Whitridge, Cork Gaines, Diana Weber, Mary G. Egan, Melissa Lindsay, George Amato, Larry Dueck, Robert L. Brownell, Mads-Peter Heide-Jorgensen, Kristen Laidre, Adalgisa Caccone, and Brittany Hancock. 2012. Gene flow on ice: The role of sea ice and whaling in shaping Holarctic genetic diversity and population differentiation in bowhead whales (Balaena mysticetus). Ecology and Evolution 2: 2895-2911
- Andersen, J.M, M. Skern-Mauritzen, L. Boehme, Y.F. Wiersma, A. Rosing-Asvid, M.O. Hammill and G.B. Stenson. 2013. Investigating Annual Diving Behaviour by Hooded Seals (Cystophora cristata) within the Northwest Atlantic Ocean. Plos One 8: Article number e80438. DOI 10.1371/journal.pone.0080438
- Andersen, J. M., Wiersma, Y. F., Stenson, G. B., Hammill, M. O., Rosing-Asvid, A., and Skern-Maurizen, M. 2013. Habitat selection by hooded seals (Cystophora cristata) in the Northwest Atlantic Ocean. – ICES Journal of Marine Science, 70:173–185
- Andersen JM, Stenson GB, Skern-Maurizen M, Wiersma YF, Rosing-Asvid A, MO Hammill and L Boehme. 2014. Drift Diving by Hooded Seals (Cystophora cristata) in the Northwest Atlantic Ocean. PLoS ONE 9(7): e103072. doi:10.1371/journal.pone.0103072
- Asselin NC, Barber DG, Richard PR, Ferguson SH. 2012. Occurrence, distribution and behaviour of beluga (Delphinapterus leucas) and bowhead (Baleaena mysticetus) whales at the Franklin Bay ice edge in June 2008. Arctic 65(2): 121–132
- Asselin, N.C., Ferguson, S.H., Richard, P.R. and Barber, D.G. 2012. Results of narwhal (Monodon monoceros) aerial surveys in northern Hudson Bay, August 2011. DFO Can. Sci. Advis. Sec. Res. Doc. 2012/037. iii + 23 p.
- Asselin, N.C., and Ferguson, S.H. 2013. A re-analysis of northern Hudson Bay narwhal surveys conducted in 1982, 2000, and 2011. DFO Can. Sci. Advis. Sec. Res. Doc. 2013/019. v + 9 p
- Bahoura, M., and Simard, Y. 2012. Serial combination of multiple classifiers for automatic blue whale calls recognition. Expert Syst. Appl. 39 (11): 9986-9993 doi:10.1016/j.eswa.2012.01.156
- Bailleul F., Lesage V., Power M., Doidge D.W., and Hammill, M.O. 2012. Differences in diving and movement patterns of two groups of beluga whales in a changing Arctic environment reveal discrete populations. Endangered Species Research 17: 27-41.
- Bailleul, F., Lesage, V., Power, M., Doidge, D.W., Hammill, M.O. 2012. Migration phenology of beluga whales in a changing Arctic. Climate Research 53: 169-178
- Bailleul, F., V. Lesage, M. Power, D.W. Doidge, and Mike O. Hammill. 2012. Environmental response in fall migration phenology of beluga in a changing Arctic. Climate Research 53:169-178
- Bailleul, F., V. Grimm, C. Chion and M. Hammill. 2013. Modeling implications of food resource aggregation on animal migration phenology. Ecology and Evolution. 3:2535-2546. Doi 10.1002/ece3.656
- Bajzak,C.E., W. Bernhardt, A. Mosnier, M. O. Hammill, I. Stirling. 2012. Habitat use by harbour seals (Phoca vitulina) in a seasonally ice-covered region, the western Hudson Bay. Polar Biology 36:477-491. DOI: 10.1007/s0 0 (300) 012-1274-4
- Baker, C.S., Steel, D., , Calambokidis, J., Falcone, E., González-Peral, U., Barlow, J., Burdin, A.M., Clapham, P.J., Ford, J.K.B., Gabriele, C.M., Matilla, D.K., Rojas-Bracho, L., Straley, J.M., Taylor, B.L., Urbán R., J., Wade, P.R., Weller, D., Witteveen, B.H., and Yamaguchi, M. 2013. Strong maternal fidelity and natal philopatry shape genetic structure in North Pacific humpback whales. Marine Ecology Progress Series 494: 291–306
- Baker, L.L., Jonsen, I.D., Mills-Flemming, J.E., Lidgard, D.C., Bowen, W.D., Iverson, S.J. and Webber, D. M. 2014. Probability of Detecting Marine Predator-Prey and Species Interactions Using Novel Hybrid Acoustic Transmitter-Receiver Tags. PLoS ONE 9(6): e98117. doi:10.1371/journal.pone.0098117
- Barber DG, Asplin MG, Papakyriakou TN, Miller L, Else BGT, Iacozza J, Mundy CF, Gosslin M, Asselin NC, Ferguson S, Lukovich JV, Stern GA, Gaden A, Pućko M, Geilfus NX, Wang F. 2012. Consequences of change and variability in sea ice on marine ecosystem and biogeochemical processes during the 2007–2008 Canadian International Polar Year program. Climate Change online DOI 10.1007/s1 0 (584) 012-0482-9
- Barbieri, M.M., S. Raverty, M.B. Hanson, S. Venn-Watson, J.K.B. Ford, and J.K. Gaydos. 2013. Spatial and temporal analysis of killer whale (Orcinus orca) strandings in the North Pacific Ocean and the benefits of a coordinated stranding response protocol. Marine Mammal Science 29(4):E448-E462
- Bell, R. K. and Harwood, L. A. 2012. Harvest-based monitoring in the Inuvialuit Settlement Region: Steps for Success. Arctic 64(4): 421-432
- Bennett, K.A., M. Hammill, and S. Currie. 2013. Liver glucose-6-phosphatase proteins in suckling and weaned grey seal pups: structural similarities to other mammals and relationship to nutrition, insulin signalling and metabolite levels. Journal Of Comparative Physiology B-Biochemical Systemic And Environmental Physiology 183:1075-1088. Doi:10.1007/S0 0 (360) 013-0768-X
- Bennett, KA, IS MacMillan, M Hammill, and S Currie. 2014. HSP70 abundance and antioxidant capacity in feeding and fasting gray seal pups: Suckling is associated with higher levels of key cellular defenses. Physiological and Biochemical Zoology 87(5):663–676
- Benoit, D., Simard, Y., and Fortier, L. 2014. Pre-winter distribution and habitat characteristics of polar cod (Boreogadus saida) in southeastern Beaufort Sea. Polar Biology. 37(2): 149-163. DOI: 10.1007/s0 0 (300) 013-1419-0
- Boehme L, Thompson D, Fedak M, Bowen D, Hammill MO, et al. (2012) How Many Seals Were There? The Global Shelf Loss during the Last Glacial Maximum and Its Effect on the Size and Distribution of Grey Seal Populations. PLoS ONE 7(12): e53000. doi:10.1371/journal.pone.0053000
- Bousquet N, Chassot E, Duplisea DE, Hammill MO. 2014. Forecasting the Major Influences of Predation and Environment on Cod Recovery in the Northern Gulf of St. Lawrence. PLoS ONE 9(2): e82836. doi:10.1371/ journal.pone.0082836
- Bowen, W. D. 2012. Center for Independent Experts Independent Peer Review of the November 2010 North Pacific Groundfish Fishery Biological Opinion. 67p. http://www.fakr.noaa.gov/protectedresources/stellers/esa/biop/final/cie/reports/bowen0912.pdf
- Bowen, W. D. and Lidgard, D. 2012. Marine mammal culling programs: review of effects on predator and prey populations. Mammal Review doi:10.1111/j.1365-2907.2012.00217.x
- Bowen, W. D. and Iverson, S. J. 2012. Validation of hard part and quantitative fatty acid methods of estimating marine mammal diets: experimental evidence, sources of bias and uncertainty. Mar. Mamm. Sci. DOI: 10.1111/j.1748-7692.2012.00604.x
- Bowen, W. D. 2014. Whale and seal research at BIO through five decades. In VOYAGE OF DISCOVERY, Fifty Years of Marine Research at Canada’s Bedford Institute of Oceanography: A commemorative volume in celebration of the 50th anniversary of the Bedford institute of Oceanography Dartmouth, Nova Scotia, Canada, 1962 – 2012. Ed. David N. Nettleship, D. E., Gordon, D. C., Lewis, M. C. F., and Latremouille, M. P. Pp. 93-102.
- Braune, B.M., A. J. Gaston, K. H. Elliott, J. F. Provencher, K. J. Woo, M. Chambellant, S. H. Ferguson, R. J. Letcher. 2014. Organohalogen contaminants and total mercury in forage fish preyed upon by thick-billed murres in northern Hudson Bay. Mar. Poll. Bull. 78: 258-266
- Breed, G., Bowen, W. D, and Leonard, M. 2013. Behavioural signature of intraspecific competition and density-dependence in colony breeding marine predators. Ecology and Evolution doi: 10.1002/ece3.754
- Brown TA, C Alexander, D J Yurkowski, SH Ferguson, and ST Belt. 2014. H-Print: A new chemical fingerprinting approach for distinguishing primary production sources in Arctic ecosystems. Environmental Chemistry Letters 12:387–392. DOI 10.1007/s1 0 (311) 014-0459-1
- Brown, T. A., S. H. Ferguson, D. J. Yurkowski, N. J. Davison, J. Barnett, P. D. Jepson and S. T. Belt. 2013. Identification of the sea ice diatom biomarker IP25 and related lipids in marine mammals: A potential method for investigating regional variations in dietary sources within higher trophic level marine systems. Journal of Experimental Marine Biology and Ecology 441: 99-104
- Buren, A.D., M. Koen-Alonso, P. Pepin, F. Mowbry, B. Nakashima, G. Stenson, N. Ollerhead, W.A. Montevecchi. 2014. Bottom-up regulation of capelin, a keystone forage species, PLoS One 9(2):e87589. Doi:10.1371/journal.pone.0087589
- Buren, A. D., M. Koen-Alonso and G. B. Stenson. 2014. The role of harp seals, fisheries and food availability in drive the dynamics of northern cod. Mar. Ecol. Prog. Ser. In Press. Accepted June 2014
- Chambellant, M, NJ Lunn, SH Ferguson. 2012. Temporal variation in distribution and density of ice-obligated seals in western Hudson Bay, Canada. Polar Biology 35: 1105-1117. DOI 10.1007/s0 0 (300) 012-1159-6
- Chambellant, M, I Stirling, WA Gough, SH Ferguson. 2012. Temporal variations in Hudson Bay ringed seal (Phoca hispida) life-history parameters in relation to environment. Journal of Mammalogy 93: 267-281
- Chambellant, M, I Stirling, SH Ferguson. 2013. Temporal variation in western Hudson Bay ringed seal (Phoca hispida) diet in relation to environment. Marine Ecology Progress Series 481: 269-287
- Chmelnitsky E. Ferguson SH. 2012. Beluga whale, Delphinapterus leucas, vocalizations from the Churchill River, Manitoba, Canada. Journal of the Acoustical Society of America 131:4821-4835
- Citta, J., Quakenbush, L. T., Okkonen, S. R., Druckenmiller, M. L. Maslowski, W., Clement-Kinney; J., George, J. C., Brower, H., Small, R. J., Ashijan, C. J., Harwood, L. A., and Heide-Jørgensen, M. P. 2014. Ecological characteristics of core-use areas used by Bering-Chukchi-Beaufort (BCB) bowhead whales, 2006-2012. Progress in Oceanography. In press.
- Colbeck, G.J., Duchesne, P.D., Postma, L., Lesage, V., Hammill, M.O., Turgeon, J. 2013. Groups of related belugas (Delphinapterus leucas) travel together during their seasonal migrations in and around Hudson Bay. Proceedings of the Royal Society of London B, 280. Doi: 10.1098/rspb.2012.2552
- Dalla Rosa, L., J.K.B Ford, and A.W. Trites. 2012. Distribution and relative abundance of humpback whales in relation to environmental variables in coastal British Columbia and adjacent waters. Continental Shelf Research 36:89-104
- Daoust, P.-Y., C. Caraguel, H. Fenton, M. O. Hammill, L. D. Roy, and J. Spears. 2012. Assessment of current and alternative methods for killing young grey seals (Halichoerus grypus) during commercial harvest. DFO Can. Sci. Advis. Sec. Res. Doc. 2012/xxx. iv + xx p. Available at http://www.dfo-mpo.gc.ca/csas-sccs/
- Daoust, P.-Y., M. Hammill, G. Stenson and C. Caraguel. 2014. A review of animal welfare implications of the Canadian commercial seal hunt: a critique. Marine Policy. 43:367-371
- Darnis G, Robert D, Pomerleau C, Link H, Archambault P, Nelson RJ, Geoffroy M, Tremblay J-É, Lovejoy C, Ferguson SH, Hunt BPV and Fortier L. 2012. Current state and trends in Canadian Arctic marine ecosystems: II. Heterotrophic food web, pelagic-benthic coupling, and biodiversity. Climate Change 115: 179-205
- Davies, K.T.A., Taggart, C.T., and Smedbol, R.K. 2014. Water masses define the diapausing copepod distribution and right whale Critical Habitat on the Scotian Shelf. Mar. Ecol. Prog. Ser. 497: 69-85
- den Heyer, C., W.D. Bowen, and J.I. McMillan. 2013. Long-term changes in grey seal vital rates at Sable Island estimated from POPAN mark-resighting analysis of branded seals. Can. Sci. Advis. Sec. Res. Doc., 2013/21
- Doniol-Valcroze, T. and Hammill, M.O. 2012. Harvest advice for beluga in the Belcher, King George, and Sleeper Islands in relation to the eastern Hudson Bay stock. DFO Can. Sci. Advis. Sec. Res. Doc. 2011/125. iv + 8 p.
- Doniol-Valcroze, T. and Hammill, M.O. 2012. Information on abundance and harvest of Ungava Bay beluga. DFO Can. Sci. Advis. Sec. Res. Doc. 2011/126. iv + 12 p.
- Doniol-Valcroze, T., Hammill, M.O. and Lesage, V. 2012. Information on abundance and harvest of eastern Hudson Bay beluga (Delphinapterus leucas). DFO Can. Sci. Advis. Sec. Res. Doc. 2011/119. iv + 17 p.
- Doniol-Valcroze, T, Lesage, V., Hammill, M. O. 2012. Management implication of closure of estuaries to hunting of beluga in Nunavik. DFO Can. Sci. Advis. Sec. Res. Doc. 2011/130. iv + 16 p. Available at http://www.dfo-mpo.gc.ca/csas-sccs/
- Doniol-Valcroze, T., Lesage, V.,Giard, J. and Michaud, R. 2012. Challenges in marine mammal habitat modelling: evidence of multiple foraging habitats from the identification of feeding events in blue whales. Endangered Species Research 17(3):255–268
- Doniol-Valcroze, T., Gosselin, J.-F. and Hammill, M.O. 2013. Population modeling and harvest advice under the precautionary approach for eastern Hudson Bay beluga (Delphinapterus leucas). DFO Can. Sci. Advis. Sec. Res. Doc. 2012/168. iii + 31 p.
- Doniol-Valcroze, T. and Hammill, M. O. 2013. Ecology of bowhead whales: A summary of knowledge and recent findings. In: Arvik! : in pursuit of the bowhead whale, Publications Nunavik TM, Westmount, Quebec, 216 pp.
- Doniol-Valcroze, T., Gosselin, J.-F. and Hammill, M.O. 2014. Impacts of a flexible Total Allowable Take system on beluga conservation in the Nunavik Marine Region. DFO Can. Sci. Advis. Sec. Res. Doc. 2014/004. v + 17 p.
- Ferguson SH, Higdon JW, KH Westdal. 2012. Prey items and predation behavior of killer whales (Orcinus orca) in Nunavut, Canada based on Inuit hunter interviews. Aquatic Biosystems 8:3 http://www.aquaticbiosystems.org/content/8/1/3
- Ferguson, S.H., M.C.S. Kingsley, and J.W. Higdon. 2012. Killer whale predation in a multi-prey system. Population Ecology. 54(1):31-41 DOI 10.1007/s1 0 (144) 011-0284-3
- Ferguson SH, Berteaux D, Gaston AJ, Higdon JW, Lecomte N, Lunn N, Mallory ML, Reist J, Russell D, Yoccoz NG, Zhu X. 2012. Time series data for Canadian arctic vertebrates: IPY contributions to science, management, and policy. Climate Change 115:235–258 DOI: 10.1007/s1 0 (584) 012-0476-7
- Ferguson, S. H. and J. W. Higdon. 2013. Grouping world cetaceans according to life-history characteristics indicates two divergent strategies. Can. Wildl. Biol. & Manage. 2: 51-66
- Filatova, O., Ford, J.K.B., Matkin, C.O., Barrett-Lennard, L.G., Burdin, A.M., and E. Hoyt. 2012. Ultrasonic whistles of killer whales (Orcinus orca) recorded in the North Pacific. Journal of the Acoustical Society of America 132:618-621
- Filatova, O.A., J.K.B. Ford, C.O. Matkin, L.G. Barrett-Lennard, M.A. Guzeev, A.M. Burdin, E. Hoyt, and V.B. Deecke. 2012. Call diversity in North Pacific killer whale populations: implications for dialect evolution and population history. Animal Behaviour 83:595-603
- DFO. 2012. Information in support of the identification of critical habitat for Transient Killer Whales (Orcinus orca) off the west coast of Canada. DFO Can. Sci. Advis. Sec. Sci. Advis. Rep. 2012/025
- Ford, J.K.B, E.H. Stredulinsky, J.R. Towers and G.M. Ellis. 2013. Information in Support of the Identification of Critical Habitat for Transient Killer Whales (Orcinus orca) off the West Coast of Canada DFO Can. Sci. Advis. Sec. Res. Doc. 2012/155. v + 46 p.
- Ford, J.K.B., J.W. Durban, G.M. Ellis, J.R. Towers, J.F. Pilkington, L. Barrett-Lennard, and R.D. Andrews. 2013. New insights into the northward migration route of gray whales between Vancouver Island, British Columbia, and southeastern Alaska. Marine Mammal Science 29:325-337
- Ford, J.K.B. 2014. Marine Mammals of British Columbia. Royal BC Museum Handbook, Mammals of BC, volume 6. Royal BC Museum, Victoria. 460 pp.
- Ford, J.K.B., and Ellis, G.M. 2014. You are what you eat: ecological specializations and their influence on the social organization and behaviour of killer whales. In: Yamagiwa, J., and L. Karczmarski (eds.), Primates and Cetaceans: Field Research and Conservation of Complex Mammalian Societies. Springer, New York, NY. Pp. 75-98
- Ford, J.K.B, Stredulinsky, E.H., Ellis, G.M., Durban, J.W., and Pilkington, J.F. in press. Offshore Killer Whales in Canadian Pacific Waters: Distribution, Seasonality, Foraging Ecology, Population Status and Potential for Recovery. DFO Can. Sci. Advis. Sec. Res. Doc. 2014/nnn. vi+xxp.
- Foster, E.A., D.W. Franks, S. Mazzi, S.K. Darden, K.C. Balcomb, J.K.B. Ford, and D.P. Croft. 2012. Adaptive prolonged postreproductive life span in killer whales. Science, 337 (6100): 1313 DOI: 10.1126/science.1224198
- Frie, A. K., G. Stenson and T. Haug. 2012. Long term trends in reproductive and demographic parameters of female Northwest Atlantic hooded seals (Cystophora cristata (Erxleben, 1777): Population responses to ecosystem change? Can. J. Zool. 90:376-392
- Frie, A. K., Hammill, M. O., Hauksson, E., Lind, Y., Lockyer, C., Stenman, O., and Svetocheva, O. 2013. Error patterns in age estimation and tooth readability assignment of grey seals (Halichoerus grypus): results from a transatlantic, image-based, blind-reading study using known-age animals. ICES Journal of Marine Science, 70:418-430. doi:10.1093/icesjms/fss169
- Frouin, H., Lebeuf , M., Hammill, M.O. , Fournier, M. 2012. Transfer of PBDEs and chlorinated POPs from mother to pup during lactation in harp seals Phoca groenlandica. Science of the Total Environment 417–418 (2012) 98–107
- Gaden, A, Ferguson S, Harwood L, Melling H, Alikamik J, Stern G. 2012. Western Canadian Arctic ringed seal organochlorine contaminant trends in relation to sea ice break-up. Environmental Science & Technology. 46: 4427-4433
- Gavrilchuk, K., and Lesage, V. 2014. Large-scale marine development projects (mineral, oil and gas, infrastructure) proposed for Canada’s North. Can. Tech. Rep. Fish. Aquat. Sci. 3069: x + 85 p. Available at: https://waves-vagues.dfo-mpo.gc.ca/library-bibliotheque/351290.pdf
- Gavrilchuk, K., Lesage, V., Ramp, C., Sears, R., Bearhop, S., Beauplet, G. 2014. Trophic niche partitioning among sympatric baleen whale species during the period following the collapse of groundfish stocks in the Northwest Atlantic. Marine Ecology Progress Series 497: 285–301
- Gervaise, C., Simard, Y., Roy, N., Kinda, B., and Ménard, N. 2012. Shipping noise in whale habitat: characteristics, sources, budget and impact on belugas in Saguenay–St. Lawrence Marine Park hub. J. Acoust. Soc. Am. 132(1): 76-89
- Gosselin JF, M.O. Hammill , S.H Ferguson , T. Doniol-Valcroze. 2012. , Ringed seal abundance in James Bay and eastern Hudson Bay in spring 2011 and 2012 . DFO Can. Sci. Advis. Sec. Res. Doc. 2012/xxx. iv + xx p. Available at http://www.dfo-mpo.gc.ca/csas-sccs/
- Gosselin, J.-F., T. Doniol-Valcroze and M.O. Hammill. 2012. Abundance estimate of eastern Hudson Bay beluga, summer 2011. DFO Can. Sci. Advis. Sec. Res. Doc. 2012/xxx. iv + xx p. Available at http://www.dfo-mpo.gc.ca/csas-sccs/
- Gosselin, J.-F., Doniol-Valcroze, T. and Hammill, M.O. 2013. Abundance estimate of beluga in eastern Hudson Bay and James Bay, summer 2011. DFO Can. Sci. Advis. Sec. Res. Doc. 2013/016. vii + 20 p.
- Hammill, M.O. and P.S. Galbraith. Changes in seasonal sea-ice cover and its effect on marine mammals. Pages 24-27 in Benoît, H. P., Gagné, J. A., Savenkoff, C., Ouellet, P., and Bourassa M.-N. (eds.). 2012. State-of the-Ocean Report for the Gulf of St. Lawrence Integrated Management (GOSLIM). Area. Can. Manuscr. Rep. Fish. Aquat. Sci. 2986: viii + 73 pp.
- Hammill, M.O., G.B. Stenson, T. Doniol-Valcroze and A. Mosnier. 2012. Estimating carrying capacity and population trends of Northwest Atlantic harp seals, 1952-2012. Canadian Science Advisory Secretariat Res. Doc. 2012/148. iii + 31 p.
- Hammill, MO. 2013. Effects of Climate Warming on Arctic Marine Mammals in Hudson Bay: Living on the Edge? Franz J. Mueter, Danielle M.S. Dickson, Henry P. Huntington, James R. Irvine, Elizabeth A. Logerwell, Stephen A. MacLean, Lori T. Quakenbush, and Cheryl Rosa (editors) Responses of Arctic Marine Ecosystems to Climate Change. Pub. no.: AK-SG-13-03. ISBN: 978-1-56612-175-0
- Hammill, M.O. and G.B. Stenson. 2013. A Discussion of the Precautionary Approach and its Application to Atlantic Seals. DFO Can. Sci. Advis. Sec.Res. Doc. 2013/030. v + 25 p.
- Hammill, M. O., den Heyer, C.E. and Bowen, W.D. 2014. Grey Seal Population Trends in Canadian Waters, 1960-2014. DFO Can. Sci. Advis. Sec. Res. Doc. 2014/037. iv + 44 p.
- Hammill, M.O., C. den Heyer, and W.D. Bowen. 2014. Northwest Atlantic grey seal population trends, 1960-2013. DFO Can. Sci. Advis. Sec. Res. Doc.
- Hammill, M. O and Stenson, G. B. 2014. Changes in ice conditions and potential impact on harp seal pupping. DFO Can. Sci. Advis. Sec. Res. Doc. 2014/025. iv + 14 p.
- Hammill, M. O. and Stenson, G. B. 2014. Assessing Harp Seals and Providing Advice in a Multiyear Framework. DFO Can. Sci. Advis. Sec. Res. Doc. 2014/038. iv + 22 p.
- Hammill, M.O., G.B. Stenson, D.P. Swain and H.P. Benoît. 2014. Feeding by grey seals on endangered stocks of Atlantic cod and white hake. ICES J. Mar. Sci. doi:10.1093/icesjms/fsu123
- Hammill, M. O., G. B. Stenson, A. Mosnier and T. Doniol-Valcroze. 2014. Abundance estimates of Northwest Atlantic harp seals and management advice for 2014. DFO Can. Sci. Advis. Sec. Res. Doc. 2014/022
- Harris, L.E., Gross, W.E., and Emery, P.E. 2013. Biology, Status, and Recovery Potential of Northern Bottlenose Whales (Hyperoodon ampullatus). DFO Can. Sci. Advis. Sec. Res. Doc. 2013/038. v + 35 p.
- Harvey,V., M.O. Hammill, D.P. Swain, G.A. Breed, C. Lydersen and K.M. Kovacs. 2012. Winter foraging by a top predator, the grey seal, in relation to the distribution of prey. Marine Ecology Progress Series 462: 273-286
- Harwood, L. A., Smith, T. G., Auld, J. C. 2012. Fall migration of ringed seals (Phoca hispida) through the Beaufort and Chukchi seas, 2001-2002. Arctic 65(1): 35-44
- Harwood, L. A., Smith, T. G., Melling, H., Alikamik, J., and Kingsley, M.C.S. 2012. Ringed seals and sea ice in Canada’s Western Arctic: harvest-based monitoring 1992-2011. Arctic 65(4): 377-390
- Harwood, L. A. and Kingsley, M.C.S. 2013. Trends in offshore distribution and relative abundance of Beaufort Sea beluga, 1982-1985 vs 2007-2009. Arctic 66(3): 247-256
- Harwood, L. A., Sandstrom, S. J., Papst, M. H., and Melling, H. 2013. Kuujjua River Arctic Charr: monitoring stock trends using catches from an under-ice subsistence fishery, Victoria Island, Northwest Territories, Canada 1991-2009. Arctic 66(3): 291-300
- Harwood, L. A. and Babaluk, J. A. 2014. Spawning, overwintering and summer feeding habitats used by anadromous Arctic char (Salvelinus alpinus) of the Hornaday River, Northwest Territories, Canada. Arctic 67(4): in press
- Harwood, L. A., Kingsley, M. C. S., and Smith, T. G. 2014. An emerging pattern of declining growth rates in belugas of the Beaufort Sea: 1989–2008. Arctic 67(4): in press
- Harwood, L. A., Iacozza, J., Auld, J. C., Norton, P. and Loseto, L. 2014. Belugas in the Mackenzie River estuary, NT, Canada: habitat use and hot spots in the Tarium Niryutait Marine Protected Area. Ocean & Coastal Management 100: 128-138. doi.org/10.1016/j.ocecoaman.2014.08.004
- Heaslip, S. G., M. C. James, S. J. Iverson, and W. D. Bowen. 2012. Jellyfish support high energy intakes of leatherback sea turtles (Dermochelys coriacea): video evidence from animal-borne cameras. PlosOne 7(3): e33259. doi:10.1371/journal.pone.0033259
- Heaslip, S.G., W.D. Bowen, and S.J. Iverson. 2014. Testing predictions of optimal diving theory using animal-borne video from harbour seals (Phoca vitulina). Canadian Journal of Zoology 92:309-318
- Higdon JW, Byers T, Brown L, Ferguson SH. 2013. Observations of killer whales (Orcinus orca) in the Canadian Beaufort Sea. Polar Record 49: 307-314
- Higdon, J.W. and S.H. Ferguson. 2014. Inuit recollections of a 1950s Killer Whale (Orcinus orca) ice entrapment in Foxe Basin, Nunavut, Canada. Aquatic Mammals, 40(1): 9-19, DOI 10.1578/AM.40.1.2014.9
- Higdon, J.W., K.H. Westdal, and S.H. Ferguson. 2014. Distribution and abundance of killer whales (Orcinus orca) in Nunavut, Canada – an Inuit knowledge survey. Journal of the Marine Biological Association of the United Kingdom, 94(6), 1293–1304. doi:10.1017/S 0 (025) 315-413000921
- Hoover C, M Bailey, J Higdon, SH Ferguson, R Sumaila. 2013. Estimating the economic value of narwhal and beluga hunts in Hudson Bay, Nunavut. Arctic 66: 1-16
- Iacozza, J. and S. H. Ferguson. 2014. Spatio-temporal variability of snow cover over sea ice in western Hudson Bay, with reference to ringed seal pup survival. Polar Biology 37:817–832. DOI 10.1007/s0 0 (300) 014-1484-z
- Kelly TC, Higdon JW, Ferguson SH. 2014. Large testes and brain masses in odontocetes: The influence of mating system on encephalization. Can. J. Zool. 92: 721–726 dx.doi.org/10.1139/cjz-2014-0044
- Kelley TC, Stewart REA, Yurkowski DJ, Ryan A, Ferguson SH. 2014. Mating ecology of beluga (Delphinapterus leucas) and narwhal (Monodon monoceros) as estimated by reproductive tract metrics. Mar Mamm Sci in press
- Kinda, B., Simard, Y., Gervaise, C., Mars, J.I. and Fortier, L. 2013. Under-ice ambient noise in Eastern Beaufort Sea, Canadian Arctic, and relations with environmental forcing. J. Acoust. Soc. Am. 134:77-87
- Kingsley, M.C.S., Richard, P. and Ferguson, S.H. 2012. Stock-dynamic model for the northern Hudson Bay narwhal population based on 1982-2008 aerial surveys. DFO Can. Sci. Advis. Sec. Res. Doc. 2012/020. iv + 20 p.
- Kingsley, M.C.S., Asselin, N.C., and Ferguson, S.H. 2013. Updated stock-dynamic model for the Northern Hudson Bay narwhal population based on 1982-2011 aerial surveys. DFO Can. Sci. Advis. Sec. Res. Doc. 2013/011. v + 19 p.
- Kiszka, J., Lesage, V., Ridoux, V. 2014. Effect of ethanol preservation on stable carbon and nitrogen isotope values in cetacean epidermis: implication for using archived biopsy samples. Marine Mammal Science 30(2): 788-795
- Koski, W.R., and Ferguson, S.H. 2012. Review of Methods for Eastern Canada-Western Greenland Bowhead Whale (Balaena mysticetus) Population Abundance Estimation. DFO Can. Sci. Advis. Sec. Res. Doc. 2012/nnn. vi + 23 p.
- Lair, S., Martineau, D., Measures, L.N. 2014. Causes of mortality in St. Lawrence Estuary beluga (Delphinapterus leuca) from 1983 to 2012. DFO Can. Sci. Advis. Sec. Res. Doc. 2013/119 iv+37 p.
- Lang, S.L.C., S.J. Iverson and W.D. Bowen. 2012. Primiparous and multiparous females differ in mammary gland alveolar development: implications for milk production. J. Exp. Biol. 215:2904-2911
- Larrat, S., L. Measures and S. Lair. 2012. Rake marks on a harbour porpoise (Phocoena phocoena) calf suggestive of a fatal interaction with an Atlantic white-sided dolphin (Lagenorhynchus acutus). Aquatic Mammals 38: 86 - 91
- Lawson, J.W., and Lesage, V. 2013. A draft framework to quantify and cumulate risks of impacts from large development project for marine mammal populations: A case study using shipping associated with the Mary River Iron Mine project. Department of Fisheries and Oceans, Ottawa, ON. Canadian Science Advisory Secretariat Research Document 2012/154. vi + 22 p.
- Lawson, J.W., and Stevens, T.S. 2014. Historic and current distribution patterns, and minimum abundance, of killer whales (Orcinus orca) in the north-west Atlantic. J. Mar. Biol. Assoc. U.K. 94(6):1253-1265
- Lebeuf, M., L. Measures, M. Noël, M. Raach and S. Trottier. 2014. A twenty-one year temporal trend of persistent organic pollutants in St. Lawrence Estuary beluga, Canada. Science of the Total Environment 485-486: 377 - 386
- Lebeuf, M., Raach, M., Measures, L., Ménard, N., and Hammill, M. 2014. Temporal trends of PBDEs in adult and newborn beluga (Delphinapterus leucas) from the St. Lawrence Estuary. DFO Can. Sci. Advis. Sec. Res. Doc. 2013/120. v + 11 p.
- Lemieux-Lefebvre, S., Michaud, R., Lesage, V., Berteau, D. 2012. Identifying high residency areas of the threatened the St. Lawrence beluga whale from fine-scale movements of individuals and coarse-scale movements of herds. Marine Ecology Progress Series 450: 243-257
- Lesage V., Comtois S., Savenkoff C., Simard Y., Gosselin J.-F. 2013. 2013 Lesage V., Comtois S., Savenkoff C., Simard Y., Gosselin J.-F. Mammifères marins, pp. 16-23 in Gagné, P, Ouellet, P, Savenkoff, C., Galbraith, P.S., Bui, A.O.V., Bourassa, M.-N. (Éd.), Rapport intégré de l’initiative de recherche écosystémique (IRÉ) de la région du Québec pour le projet : Les espèces fourragères responsables de la présence des rorquals dans l’estuaire maritime du Saint-Laurent. DFO Can. Sci. Advis. Sec. Res. Doc. 2013/086. vi + 181 p. Available at http://www.dfo-mpo.gc.ca/csas-sccs/
- Lesage, V. 2014. Trends in the trophic ecology of St. Lawrence beluga (Delphinapterus leucas) over the period 1988-2012, based on stable isotope analysis. DFO Can. Sci. Advis. Sec. Res. Doc. 2013/126. iv + 25 p. Available at http://www.dfo-mpo.gc.ca/csas-sccs/
- Lesage, V., McQuinn, I.H., Carrier, D., Gosselin, J.-F., and Mosnier, A. 2014. Exposure of the beluga (Delphinapterus leucas) to marine traffic under various scenarios of transit route diversion in the St. Lawrence Estuary. DFO Can. Sci. Advis. Sec. Res. Doc. 2013/125. iv + 28 p. Available at http://www.dfo-mpo.gc.ca/csas-sccs/
- Lesage, V., Mosnier, A., Measures, L., Lair, S., Béland, P. 2014. Mortality patterns in St. Lawrence Estuary beluga (Delphinapterus leucas), inferred from the carcass recovery data, 1983-2012. DFO Can. Sci. Advis. Sec. Res. Doc. 2013/118. ii+24p. Available at http://www.dfo-mpo.gc.ca/csas-sccs/
- Lewis, S., Ramirez-Luna, V., Templeman, N., Simpson, M.R., Gilkinson, K., Lawson, J.W., Miri, C., and Collins, R. 2014. A Framework for the Identification of Monitoring Indicators Protocols and Strategies for the Proposed Laurentian Channel Marine Protected Area (MPA). DFO Can. Sci. Advis. Sec. Res. Doc. 2014/nnn. vi + xx p.
- Lidgard, D. C., W. D. Bowen, D. J. Boness. 2012. Longitudinal changes in male physical traits and the implications for mating behaviour and success in a long-lived polygynous mammal, the grey seal. Can. J. Zool. 90:849-860
- Lidgard, D. C., W. D. Bowen, I. Jonsen, and S. J. Iverson. 2012. Animal-borne acoustic transceivers reveal patterns of at-sea associations in an upper-trophic level predator. PlosOne 7:e48962-e48962
- Lidgard, D. C., W. D. Bowen, I. Jonsen, and S. J. Iverson. 2014. Predator-borne acoustic transceivers and GPS tracking reveal spatial and temporal patterns of encounters with acoustically-tagged fish in the open ocean. Marine Ecology Progress Series, 501: 157-168
- Luque, S., Ferguson SH, Breed, G. 2014. Spatial behaviour of a keystone Arctic marine predator and implications of climate warming in Hudson Bay. Journal of Experimental Marine Biology and Ecology. In press
- Marcoux M, McMeans BC, Fisk AT, Ferguson SH. 2012. Composition and temporal variation in the diet of belugas in Cumberland Sound using stable isotopes. Marine Ecology Progress Series 471: 283–291
- Marcoux, M., Lesage, V., Thiemann, G.W., Iverson, S.J., Ferguson, S.H. In press Age estimation of belugas using fatty acid composition: a promising method with some caveats. Marine Mammal Science X: XX-XX
- Martin, B. and Moors-Murphy, H.B. 2013. Analysis of northern bottlenose whale pulses and associated reflections recorded form the Gully Marine Protected Area. Proceedings of Meetings on Acoustics, International Congress on Acoustics. Montreal, Quebec. 3pAB4. 9 pp.
- Matthews C.J.D. and Ferguson S.H. 2014. Spatial segregation and similar trophic-level diet among eastern Canadian Arctic/north-west Atlantic killer whales inferred from bulk and compound specific isotopic analysis. Journal of the Marine Biological Association of the United Kingdom. 94(6), 1343–1355. doi:10.1017/S 0 (025) 315-413001379
- McQuinn, I.H., Sears, R., Plourde, S., Gosselin, J.-F., Lesage, V., Doniol-Valcroze, T., St. Pierre, J.F., Dion, M., Bourassa, M.-N., Raymond, A., Michaud, R., and Ménard, N. 2013. Le rôle structurant du krill dans la distribution, le déplacement et le comportement d’alimentation des rorquals bleus dans l’EMSL et les eaux adjacentes, pp. 44-50 In in Gagné, P, Ouellet, P, Savenkoff, C., Galbraith, P.S., Bui, A.O.V., Bourassa, M.-N. (Éd.), Rapport intégré de l’initiative de recherche écosystémique (IRÉ) de la région du Québec pour le projet : Les espèces fourragères responsables de la présence des rorquals dans l’estuaire maritime du Saint-Laurent. DFO Can. Sci. Advis. Sec. Res. Doc. 2013/086. vi + 181 p. Available at http://www.dfo-mpo.gc.ca/csas-sccs/
- Measures, L.N. 2014. Anisakiosis and pseudoterranovosis: Reston, Va., U.S. Geological Survey Circular 1393, 34 p., 2 appendices.
- Montevecchi, W.A., Chardine, J., Rail, J.-F., Garthe, S., Pelletier, D., Regular, P., Burkel, C., Hedd, A., Tranquilla, L.M., Bennett, S., Mooney, C., Power, K., Power, T., Hogan, H., Daoust, P.-Y., Lawson, J.W., Rogers, L., Wilhelml, S., Montevecchi, M., and Lang, A. 2013. Extreme event in a changing ocean climate: warm-water perturbation of 2012 influences breeding gannets and other marine animals in the Northwest Atlantic and Gulf of St. Lawrence. The Osprey 44(2):14-19
- Moravec, F., I. de Buron and L. Measures. 2013. First description of the gravid female of Philometra rubra (Leidy, 1856) (Nematoda: Philometridae), a parasite of the abdominal cavity of temperate basses Morone spp. (Moronidae: Perciformes) in North America. J. Parasitol. 99: 496 - 500
- Morin, P.A., F.I. Archer, V.L. Pease, B.L. Hancock-Hanser, K.M. Robertson, R.M. Huebinger, K.K. Martien, J.W. Bickham, J.C. George, L.D. Postma, and B.L. Taylor. 2012. An empirical comparison of SNPs and microsatellites for population structure, assignment, and demographic analyses of bowhead whale populations. Endangered Species Research 19: 129-147
- Mosnier, A., Doniol-Valcroze, T., Gosselin, J.-F., Lesage, V. Measures, L. and Hammill, M. 2014. An age-structured Bayesian population model for St. Lawrence Estuary beluga (Delphinapterus leucas). DFO Can. Sci. Advis. Sec. Res. Doc. 2013/127 v+39 p.
- Mosnier, A., Doniol-Valcroze, T., Gosselin, J.-F., Lesage, V., Measures, L., and Hammill, M.O. 2014. An age structured Bayesian population model for St. Lawrence Estuary beluga (Delphinapterus leucas). DFO Can. Sci. Advis. Sec. Res. Doc. 2013/127. v + 39 p.
- Nichol, L.M. and J.K.B. Ford. 2012. Information relevant to the assessment of critical habitat for Blue, Fin, Sei and North Pacific Right Whales in British Columbia DFO Can. Sci. Advis. Sec. Res. Doc. 2011/137. vi + 31 p.
- Nichol, L. M., A. M. Hall, G. M. Ellis, E. Stredulinsky, M. Boogaards, and J. K. B. Ford. 2013. Dietary overlap and niche partitioning of sympatric Harbour Porpoises and Dall’s Porpoises in the Salish Sea. Progress in Oceanography 115:202-210
- Nweeia MT, FC Eichmiller, PV Hauschka, GA Donahue, JR Orr, SH Ferguson, CA Watt, WP Kuo, JG Mead, CW Potier, R Dietz, AA Giuseppetti, SR Black, AJ Trachtenberg. 2014. Sensory ability in the narwhal tooth organ system. The Anatomical Record 297: 599–617
- Øigård,T.-A., A.K. Frie, K., T. Nilssen and M.O. Hammill. 2012. Modelling the abundance of grey seals (Halichoerus grypus) along the Norwegian coast. ICES J. of Mar. Sci. 69:1436-1447. doi 10.1093/icesjms/fss103.
- Pearson, L.E., H.E.M. Liwang, M.O. Hammill, J.M. Burns. 2014. Shifts in thermoregulatory strategy during ontogeny in harp seals (Pagophilus groenlandicus). J. of Thermal Biology 44:93-102. DOI: 10.1016/j.jtherbio.2014.02.001
- Pearson, LE, H.E.M. Liwanag , M. O.Hammill, J. M. Burns . 2014. To each its own: Thermoregulatory strategy varies among neonatal polar phocids. Comparative Biochemistry and Physiology, Part A 178 (2014) 59–67
- Petersen, S.D., Johnson, L., LeBlanc, B., Higdon, J.W., Yurkowski, D., Matthews, C., Postma, L., and Ferguson, S.H. 2014. Preliminary investigation of genetic capture-mark-recaptureto census bowhead whales (Balaena mysticetus) in Nunavut, Canada. DFO Canadian Science Advisory Secretariat, Research Document 2014/017. v + 9 p.
- Plourde, S., Galbraith, P., Lesage, V., Grégoire, F., Bourdage, H., Gosselin, J.-F., McQuinn, I., and Scarratt, M. 2014. Ecosystem perspective on changes and anomalies in the Gulf of St. Lawrence: a context in support to the management of the St. Lawrence beluga whale population. DFO Can. Sci. Advis. Sec. Res. Doc. 2013/129. vi+27p. Available at http://www.dfo-mpo.gc.ca/csas-sccs/.
- Pomerleau, C., Lesage, V., Ferguson, S.H., Winkler, G., Petersen, S.D., Higdon, J.W. 2012. Prey assemblage isotopic variability as a tool for assessing diet and the spatial distribution of bowhead whale (Balaena mysticetus) foraging in the Canadian eastern Arctic. Marine Ecology Progress Series 469:161-174
- Pomerleau C., V. Lesage, G. Winkler, B. Rosenberg, S. H. Ferguson. 2014. Contemporary diet of bowhead whales (Balaena mysticetus) from the Eastern Canadian Arctic inferred from fatty acid biomarkers. Arctic 67: 84 – 92. http://dx.doi.org/10.14430/arctic4366
- Postma, L.D., Petersen, S.D., Turgeon, J., Hammill, M.O., Lesage, V., and Doniol-Valcroze, T. 2012. Beluga whales in James Bay: a separate entity from eastern Hudson Bay belugas? DFO Can. Sci. Advis. Sec. Res. Doc. 2012/074. iii + 23 p.
- Postma, L.D., Petersen, S.D., Turgeon, J., Hammill, M. O. and Lesage, V., Doniol-Valcroze, T. 2012. Beluga in James Bay: A separate entity from eastern Hudson Bay belugas? DFO Can. Sci. Advis. Sec. Res. Doc. 2012/074. iii + 23 p. Available at http://www.dfo-mpo.gc.ca/csas-sccs/
- Postma, L.D., Tenkula, D., Johnson, L., Petersen, S.D., LeBlanc, B., Higdon, J.W., Matthews, C., and Ferguson, S.H. 2014. Relatedness among bowhead whales (Balaena mysticetus) sampled in Foxe Basin and Cumberland Sound, Nunavut, Canada. DFO Can. Sci. Advis. Sec. Res. Doc. 2013/nnn. iv + 16 p.
- Postma, L.D., Johnson, L., Tenkula, D., Petersen, S.D., LeBlanc, B., Higdon, J.W., Matthews, C., and Ferguson, S.H. 2014. Genetic kinship analyses of bowhead whales (Balaena mysticetus) sampled in Foxe Basin and Cumberland Sound, Nunavut, Canada. DFO Canadian Science Advisory Secretariat, Research Document 2014/018. iv + 16 p.
- Reinhart, N. R., S. H. Ferguson, W. R. Koski, J .W. Higdon, B. LeBlanc, O. Tervo, and P. D. Jepson. 2013. An assessment of killer whale Orcinus orca rake mark occurrence in the Eastern Canada-West Greenland bowhead whale Balaena mysticetus population. Polar Biology 36: 1133-1146
- Riesch, R., L.G. Barrett-Lennard, G.M. Ellis, J.K.B. Ford, and V.B. Deecke. 2012. Cultural traditions and the evolution of reproductive isolation: ecological speciation in killer whales? Biological Journal of the Linnean Society 106:1–17
- Rioux, È., V. Lesage, L. Postma, É. Pelletier, J. Turgeon, R. Stewart, G. Stern, and M. Hammill. 2012. Determining harvest composition and wintering assemblages of belugas at a contemporary ecological scale using stable isotopes and trace elements. Endangered Species Research 18: 179-191
- Rioux,E. Véronique Lesage, Lianne Postma, Émilien Pelletier, Julie Turgeon, Robert E. A. Stewart, Gary Stern, Mike O. Hammill. 2012. Use of stable isotopes and trace elements to determine harvest composition and wintering assemblages of belugas at a contemporary ecological scale. Endangered Species Research. 18:179-191
- Roux, M.-J., Sparling, P., Felix, J. and Harwood, L. A. 2014. Ecological Assessment of Husky Lakes and Sitidgi Lake, Northwest Territories, Canada, 2000-2004. Canadian Technical Report Fisheries and Aquatic Sciences 3071
- Sauvé,C, J. Van de Walle, M.O. Hammill, J.P.Y. Arnould, G. Beauplet. 2014. Stomach Temperature Records Reveal Nursing Behaviour and Transition to Solid Food Consumption in an Unweaned Mammal, the Harbour Seal Pup (Phoca vitulina). PLoS ONE 9(2): e90329. doi:10.1371/journal.pone.0090329
- Scarratt, M., Michaud,S., Measures,L., and Starr, M. 2014. Phycotoxin analyses in St. Lawrence Estuary beluga. DFO Can. Sci. Advis. Sec. Res. Doc. 2013/124 v+16 p.
- Sekiguchi, K, T.A. Jefferson, Y. Iwahara, M.Yoshioka, K. Mori, J.K. B. Ford, Y. Mitani and U. Gorter. 2014. An infrequently-occurring anomalous color pattern on Pacific white-sided dolphins, Lagenorhynchus obliquidens. In: J.B. Samuels (ed.), Dolphins: Ecology, Behavior and Conservations Strategies. Nova Publishers, New York. Pp. 183-199.
- Simard, Y., and Roy, N. 2013. Évaluation du rôle de l’activité humaine, Section 5.3.1 : Bruit, navigation. In Gagné, J.A., et al., Éds. Rapport intégré de l’initiative de recherche écosystémique (IRÉ) de la région du Québec pour le projet : les espèces fourragères responsables de la présence des rorquals dans l’estuaire maritime du Saint-Laurent. Secr. can. de consult. sci. du MPO. Doc. de rech. 2013/086. pp. 55-58. + figs. 5.3.1-1 à 5.3.1-7.
- Simard, Y., Roy, N., and Lavoie, D. 2013. Facteurs et processus clés déterminant l’abondance et la distribution du krill dans la dynamique saisonnière de la distribution du rorqual bleu, Section 3.1 : Zone d’agrégation du krill dans l’EMSL. In Gagné, J.A., et al., Éds. Rapport intégré de l’initiative de recherche écosystémique (IRÉ) de la région du Québec pour le projet : les espèces fourragères responsables de la présence des rorquals dans l’estuaire maritime du Saint-Laurent. Secr. can. de consult. sci. du MPO. Doc. de rech. 2013/086. pp. 24-25. + fig. 3.1-1.
- Simard, Y., Roy, N., Galbraith, P., Lavoie, D., Chassé, J., Lambert, N., and Plourde, S. 2013. Transport/échange entre le golfe et l’estuaire, Section 3.4.1 : Approvisionnement de l’estuaire depuis le golfe : courants et transport du krill. In Gagné, J.A., et al., Éds. Rapport intégré de l’initiative de recherche écosystémique (IRÉ) de la région du Québec pour le projet : les espèces fourragères responsables de la présence des rorquals dans l’estuaire maritime du Saint-Laurent. Secr. can. de consult. sci. du MPO. Doc. de rech. 2013/086. pp. 35-38 + figs. 3.4.1-1 à 3.4.1.3-5.
- Simard, Y., Loseto, L., Gautier, S., and Roy, N. 2014. Monitoring beluga habitat use and underwater noise levels in the Mackenzie Estuary: Application of passive acoustics in summers 2011 and 2012. Can. Tech. Rep. Fish. Aquat. Sci. 3068: vi + 49 pp. http://publications.gc.ca/collections/collection_2014/mpo-dfo/Fs97-6-3068-eng.pdf
- Simard, Y., Roy, N., Gervaise, C., Giard, S. 2014. A seaway acoustic observatory in action: The St. Lawrence Seaway. In: “Effects of Noise on Aquatic Life II” ed. by A. Popper and T. Hawkins. Springer. (Proc. Third International Conference on Effects of Noise on Aquatic Life, August 11-16, 2013, Budapest, Hungary.) in press.
- Simard, Y., Roy, N., Giard, S., and Yayla, M. 2014. Canadian year-round shipping atlas for 2013: Volume 2, Centre: Great Lakes and upper St. Lawrence. Can. Tech. Rep. Fish. Aquat. Sci. 3091(Vol.2)E: xviii + 186 pp. https://waves-vagues.dfo-mpo.gc.ca/library-bibliotheque/352592.pdf
- Simard, Y., Roy, N., Giard, S., and Yayla, M. 2014. Canadian year-round shipping atlas for 2013: Volume 3, West Coast. Can. Tech. Rep. Fish. Aquat. Sci. 3091(Vol.3)E: xviii + 327 pp. https://waves-vagues.dfo-mpo.gc.ca/library-bibliotheque/352600.pdf
- Stenson, G.B. 2012 Report of the Joint NAFO/ICES Working group on Harp and Hooded Seals (WGHARP). NAFO SCS Doc 12/17
- Stenson, G.B. 2012. Estimating consumption of prey by harp seals, Pagophilus groenlandicus, in NAFO divisions 2J3KL. Canadian Science Advisory Secretariat Res. Doc. 2012/156
- Stenson, G. B. M. Hammill, S. Ferguson, R. Stewart, and T. Doniol-Valcroze. 2012. Applying the Precautionary Approach to Marine Mammal Harvests in Canada. CSAS Res. Doc. 2012/107
- Stenson, G.B. and M.O. Hammill. 2012. Living on the edge: Observations of Northwest Atlantic harp seals in 2010 and 2011. Can. Sci. Advis. Sec. Res. Doc. 2011/108. Iv + 12 p.
- Stenson, G.B. 2014. The Status of harp and hooded seals in the North Atlantic. NAFO SCR Doc 14/026. N6321
- Stenson, G.B. 2014. Updated Estimates of Harp Seal Removals in the Northwest Atlantic. DFO Can. Sci. Advis. Sec. Res. Doc. 2014/015. v + 35 p.
- Stenson, G.B. and M.O. Hammill. 2014. Can ice breeding seals adapt to habitat loss in a time of climate change? ICES J. Mar. Sci. doi:10.1093/icesjms/fsu074. Online May 2014
- Stenson, G.B., M.O. Hammill, J.W. Lawson and J-F. Gosselin. 2014. Estimating pup production of Northwest Atlantic harp seals, Pagophilus groenlandicus, in 2012. DFO Can. Sci. Advis. Sec. Res. Doc. 2014/057
- Stenson, G. B., D. Wakeham, A. Buren and M. Koen-Alonso. 2014. Density-dependent and density-independent factors influencing reproductive rates in Northwest Atlantic harp seals, Pagophilus groenlandicus. DFO Can. Sci. Advis. Sec. Res. Doc. 2014/058
- Stewart, R.E.A., V. Lesage, J.W. Lawson, H. Cleator and K.A. Martin. 2012. Science Technical Review of the draft Environmental Impact Statement (EIS) for Baffinland’s Mary River Project. DFO Can. Sci. Advis. Sec. Res. Doc. 2011/086. vi+62 p.
- Sutherland, D.A., F. Straneo, G. B. Stenson, F. J.M. Davidson, M.O. Hammill, and A. Rosing-Asvid. 2013 Atlantic water variability on the SE Greenland continental shelf and its relationship to SST and bathymetry. J. Geophysical Research: Oceans, 118, 1–9, doi:10.1029/2012JC008354
- Truchon, M-H, Measures, L., L’Héreault, V., Brêthes, J-C, Galbraith, P.S., Harvey, M., Lessard, S., Starr, M. and Lecomte, N. 2013. Marine mammal strandings and environmental changes: a 15-year study in the St. Lawrence ecosystem. PLoS One 8: e59311
- Tryland, M., Nymo, I.H., Nielsen, O., Nordøy, E.S., Kovacs, K.M., Krafft, B.A., Thoresen, S.I., Sbakk, K.A., Osterrieder, K., Roth, S.J., Lydersen, C., Godfroid, J., and Blix, A.S. 2012. SERUM CHEMISTRY AND ANTIBODIES AGAINST PATHOGENS IN ANTARCTIC FUR SEALS, WEDDELL SEALS, CRABEATER SEALS, AND ROSS SEALS Journal of Wildlife Diseases, 48(3), 2012, pp. 632–645
- Tucker, S. G. Stenson, W.D. Bowen and S. Iverson. 2013. Fueling phocids: divergent exploitation of primary energy sources and parallel ontogenetic diet switches among three species of sub-arctic seals. Mar. Mammal. Sci. 29(4): E428–E447
- Tuomi,P.A., Murray, M.J., Garner, M.M., Goertz, C.E.C., Nordhausen, R.W., Burek-Huntington, K.A., Getzy, D.M., Nielsen,O., Archer, L.L., Maness, H.T.D., Wellehan, J.F. X. Jr., and Waltzek, T.B. 2014. NOVEL POXVIRUS INFECTION IN NORTHERN AND SOUTHERN SEA OTTERS (ENHYDRA LUTRIS KENYONI AND ENHYDRA LUTRIS NEIRIS), ALASKA AND CALIFORNIA, USA. Journal of Wildlife Diseases, 50(3), pp. 607-615. DOI: 10.7589/2013-08-217
- Turgeon, J., Duchesne, P., Colbeck, G.J.C., Postma, L. and M.O. Hammill. 2012. Spatiotemporal segregation among summer stocks of beluga (Delphinapterus leucas) despite nuclear gene flow: implication for an endangered population in eastern Hudson Bay (Canada). Conservation Genetics 13:419-433
- Vélez-Espino, A.L., J.K.B. Ford, H. Andres Araujo, G. Ellis, C.K. Parken and R. Sharma. 2014. Relative importance of chinook salmon abundance on resident killer whale population growth and viability. Aquatic Conservation: Marine and Freshwater Ecosystems. (2014). DOI: 10.1002/aqc.2494
- Vélez-Espino, L.A., J.K.B. Ford, C.K. Parken, G. Ellis, E. Ward, Larrie LaVouy, K. Balcomb, M.B. Hanson, D.P. Noren, T. Cooney, and R. Sharma. 2013. Sensitivity of resident killer whale population dynamics to Chinook salmon abundance. Prepared for Pacific Salmon Commission, Southern Boundary Restoration and Enhancement Fund, Vancouver, B.C. 191 pp.
- Walkusz, W., Williams, W.J., Harwood, L. A., Moore, S. E., Stewart, B. E., Kwasniewski, S. 2012. Composition, biomass and energetic content of biota in the vicinity of feeding bowhead whales (Balaena mysticetus) in the Cape Bathurst upwelling region (south eastern Beaufort Sea). Deep-sea Research I 69: 25-35
- Watt, C.A., Ferguson, S.H. Fisk, A., and Heide-Jørgensen, M.P. 2012. Using stable isotope analysis as a tool for narwhal (Mondon monoceros) stock delineation. DFO Can. Sci. Advis. Sec. Res. Doc. 2012/057. iv + 29 p.
- Watt, C.A., Orr, J., LeBlanc, B., Richard, P., and Ferguson, S.H. 2012. Satellite tracking of narwhals (Monodon monoceros) from Admiralty Inlet (2009) and Eclipse Sound (2010-2011). DFO Can. Sci. Advis. Sec. Res. Doc. 2012/046. iii + 17 p.
- Watt, C. A., M. P. Heide-Jørgensen, and S. H. Ferguson. 2013. How adaptable are narwhal: a comparison of foraging patterns among the world’s three narwhal populations. Ecosphere 4(6):71. http://dx.doi.org/10.1890/ES13-00137.1
- Watt CA, and SH Ferguson. 2014. Fatty acids and stable isotopes (13C and 15N) reveal temporal changes in narwhal (Monodon monoceros) diet linked to migration patterns. Mar Mamm Sci in press.
- Westdal, KH, Higdon, JW, Ferguson SH. 2013. Attitudes of Nunavut Inuit towards killer whales (Orcinus orca). Arctic 66: 279-290.
- Young, B. G., S. H. Ferguson. 2013. Using stable isotopes to understand changes in ringed seal foraging ecology as a response to a warming environment. Marine Mammal Science. 30: 706–725. DOI: 10.1111/mms.12075
- Young, B.G., S.H. Ferguson. 2013. Seasons of the ringed seal: pelagic open-water hyperphagy, benthic feeding over winter and spring fasting during molt. Wildlife Research 40: 52-60. http://www.publish.csiro.au/?paper=WR12168
- Date modified: