
Tutorial: Find species at risk tool
This tutorial explains step-by-step on how to use the find Species at Risk tool.
On this page
- Step 1: Open the Find aquatic species at risk tool
- Step 2: Activate the tools
- Step 3: Using the select a draw tools
- Step 4: Saving the results
Step 1: Open the Find aquatic species at risk tool
Click on the Find aquatic species at risk button, located in the toolbar on the top right corner of your screen. This will open the menu shown below:
Button composed of a fish in water in a magnifying glass to open a map query tool.
Find aquatic species at risk tool opened to the Select area tab.
Step 2: Activate the tools
To activate the tools, zoom in to the map. Once zoomed into a ratio of 1:1,200,000 (10 km) the Select draw tool shows 3 drawing options:
- Point (1 km buffer)
- Freehand area
- Polygon area

Find aquatic species at risk tool opened to Select a draw tool.
Step 3: Using the select a draw tools
- Use the Point tool to display critical habitat and distribution information about all aquatic species at risk within a 1-km radius of a point you click on the map. The tool will switch to the Results tab and display the search results.
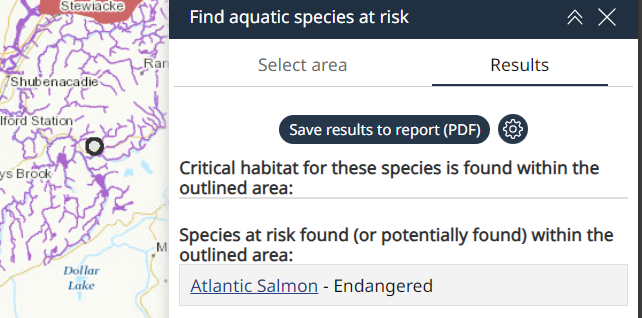
Results tab showing the list of species found within a 1-km radius of a point. A Save results to report (PDF) button and a gear icon are shown to open the pdf report and change the title of the report, respectfully.
- Use the Freehand area tool to draw an area on the map within which you want to see species at risk critical habitat and distribution information. Click and hold the left mouse button, then drag the mouse around until you have finished drawing the desired area. When you release the mouse button, the tool will switch to the Results tab and display the search results.
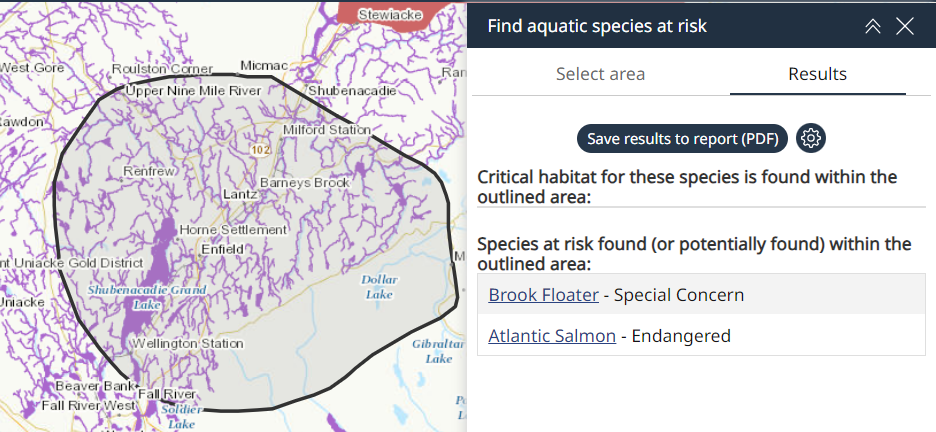
Results tab showing the list of species found within an area defined by the Freehand area tool. A Save results to report (PDF) button and gear icon are shown to open the pdf report and change the title of the report, respectfully.
- Use the Polygon area tool to piece together a polygon by clicking at multiple points on the map. At each click, the tool will draw a straight line from the previous point. When you are satisfied with the shape, double-click to display the identified species at risk critical habitat and distribution information within the defined polygon. The tool will switch to the Results tab and display the search results.
Step 4: Saving the results
You can save the results for each area selection to your computer or mobile device by selecting the “Save results to report (PDF)” button. The file will be created and downloaded to the device and can be opened using any PDF reader.
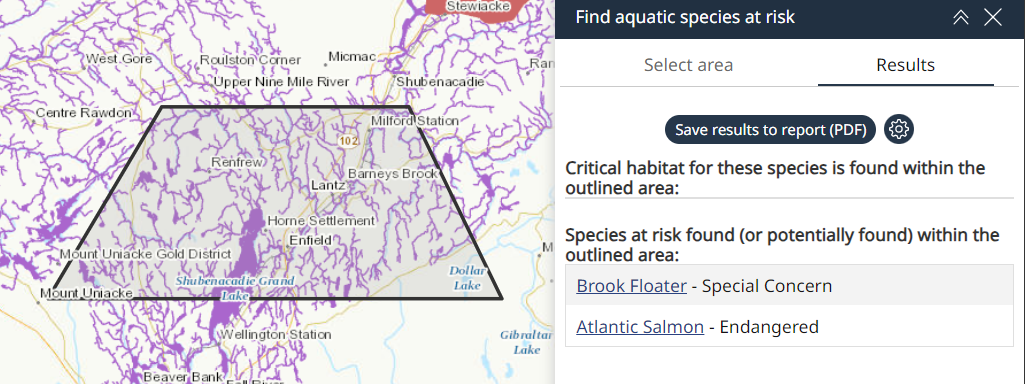
Results tab showing the list of species found within an area defined by the Polygon area tool. A Save results to report (PDF) button and gear icon are shown to open the pdf report and change the title of the report, respectfully.
Users also have the option of customizing the title of the report by clicking on the gear icon prior to downloading the pdf report.
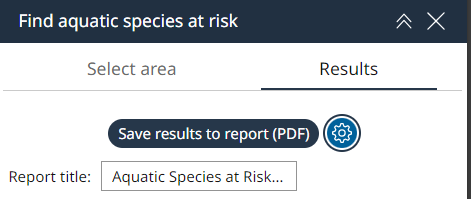
Gear icon highlighted showing the option for changing the title of the report.
- Date modified: