
Canada's position among the world's fisheries
2.1 Capture
According to the Food and Agriculture Organization of the United Nations (FAO), Canada ranked 18th worldwide in terms of the total volume of marine catches in 2004 (the total volume of catches from Canadian waters represented 1% of the world total). The top three rankings in 2004 were occupied by China, Peru and Chile, respectively. Collectively, they accounted for more than one-third of the world's marine catches.
Canada occupies an important position in terms of the volume of landings for certain species groups: in 2004, Canada made up 20% of the total world harvest of the 'lobsters, spiny rock lobster' species group and about 10% of world harvest for scallops, sea urchins and crabs.
| ISSCAAP Group1 | Volume of landings 2004 (t) | ||
|---|---|---|---|
| Canada | World | % Can. | |
| Lobsters, spiny-rock lobster | 47,479 | 232,922 | 20% |
| Scallops | 82,606 | 800,542 | 10% |
| Sea urchins and other echinoderms | 10,247 | 111,183 | 9% |
| Crabs, sea spiders | 123,283 | 1,360,953 | 9% |
| Flounders, halibuts, soles | 54,003 | 874,929 | 6% |
| Shrimp | 178,768 | 3,602,942 | 5% |
| Clams, cockles, arkshells | 39,370 | 846,914 | 5% |
| Kelp | 33,328 | 767,274 | 4% |
| American eel | 329 | 10,118 | 3% |
| Salmons, trouts, smelts | 26,629 | 878,609 | 3% |
| Others | 521,497 | 76,937,026 | 1% |
| Total | 1,117,539 | 86,423,412 | 1% |
1ISSCAAP: International Standard Statistical Classification of Aquatic Animals and Plants.
Sources: DFO, Economic Analysis and Statistics and FAO, Fishstat.
In the two FAO fishing zones Footnote 1 where almost all Canadian fisheries are located, the Pacific North-east (zone 67) and the Atlantic Northwest (zone 21), Canada ranks second and has accounted for 21% of the volume of catches in both zones since 2002. The United States is ranked first with 73% of the catches. The total catches in the Pacific Northeast and the Atlantic Northwest represented approxi-mately 5% of world marine catches in 2004.
Figure 2.1: Total catches on the Atlantic and Pacific coasts of Canada and the United States (FAO zones 21 and 67), by country, 2004
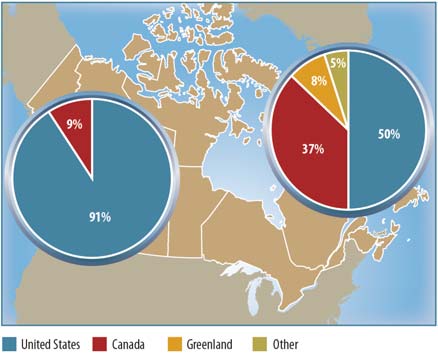
Source: FAO, Fishstat.
Canada has a more significant position in the Atlantic Northwest than in the Pacific Northeast. In 2004, Canadian fishers accounted for 37% of catches (871,000 metric tonnes) reported in zone 21, the Atlantic Northwest, versus only 9% of catches in zone 67, the Pacific Northeast.
On average, the United States was responsible for almost half of total catches in the Atlantic Northwest, between 2002 and 2004, just ahead of Canada's 37%. Canada's ranking was more important in the early 1990s in terms of volume: catches by Canadian fishers represented 42% of the total catches (the average between 1988 and 1990) compared to the 40% share for their American counterparts. Note that the volume of catches plummeted almost 30% in this fishing zone after the cod collapse of the early 1990s.
2.2 International trade
In 2004, Canada ranked 6th among the world's fish and seafood exporters (in terms of total export value) behind the United States and Denmark. This ranking was lower than in 2002 and 2003, when Canada ranked fifth, ahead of Denmark. China remained the leading world exporter of fish and seafood between 2002 and 2004.
The situation changed considerably during the last decade: in 1990, Canada and the United States were ranked 2nd and 1st, respectively, in terms of the value of exports of fish and seafood. Beginning 1991, the gradual decline in groundfish landings until the collapse of Atlantic cod in 1992, as well as the increase in aquaculture production in Asian countries prompted Canada's world export ranking to slip from 2nd to 7th place by 1993. Since then, increases in the price of crustaceans have allowed the country to regain some of its ranking.
China has been the most improved country: in 1990, it only ranked 6th among the world's fish and seafood exporters but beginning 2001, it climbed up to 1st place and has, since then, kept its position. China's significant aquaculture production and its processing sector activities explain this high value of fish and seafood exports in the country.
| Rank | Country | Value of exports ($m) | % of total
(2004) |
||
|---|---|---|---|---|---|
| 2002 | 2003 | 2004 | |||
| 1 | China | 7,900 | 8,111 | 9,383 | 10% |
| 2 | Norway | 5,655 | 5,138 | 5,427 | 6% |
| 3 | Thailand | 5,797 | 5,489 | 5,274 | 6% |
| 4 | United States | 5,211 | 4,843 | 5,088 | 5% |
| 5 | Denmark | 4,528 | 4,520 | 4,654 | 5% |
| 6 | Canada1 | 4,807 | 4,646 | 4,563 | 5% |
| 7 | Spain | 2,989 | 3,139 | 3,359 | 4% |
| 8 | Chile | 3,022 | 3,073 | 3,314 | 4% |
| 9 | Netherlands | 2,846 | 3,076 | 3,212 | 3% |
| 10 | Vietnam | 3,196 | 3,088 | 3,134 | 3% |
| - | Other countries | 46,829 | 45,185 | 46,778 | 50% |
| Total | 92,780 | 90,309 | 94,185 | 100% | |
1 These totals may not match exactly those found in Section 4 due to the difference in data sources.
Sources: FAO, FishStat and Bank of Canada.
Canada imports far less fish and seafood than it exports and for that reason only ranked 13th on the world list of seafood importers in 2004. Japan and the United States were the two largest importers of fish and seafood products that year.
| Rank | Country | Value of imports ($m) | % of total
(2004) |
||
|---|---|---|---|---|---|
| 2002 | 2003 | 2004 | |||
| 1 | Japan | 21,767 | 17,679 | 19,295 | 19% |
| 2 | United States | 15,938 | 16,466 | 15,716 | 16% |
| 3 | Spain | 6,073 | 6,889 | 6,816 | 7% |
| 4 | France | 5,083 | 5,326 | 5,486 | 6% |
| 5 | Italy | 4,581 | 5,001 | 5,099 | 5% |
| 6 | China | 3,496 | 3,398 | 4,121 | 4% |
| 7 | United Kingdom | 3,699 | 3,551 | 3,699 | 4% |
| 8 | Germany | 3,832 | 3,723 | 3,683 | 4% |
| 9 | Denmark | 2,951 | 3,060 | 3,082 | 3% |
| 10 | South Korea | 2,956 | 2,743 | 2,939 | 3% |
| 11 | Hongkong | 2,806 | 2,484 | 2,509 | 3% |
| 12 | Netherlands | 2,110 | 2,399 | 2,407 | 2% |
| 13 | Canada1 | 2,160 | 2,030 | 2,040 | 2% |
| 14 | Belgium | 1,679 | 1,956 | 1,992 | 2% |
| - | Other countries | 18,996 | 19,013 | 20,414 | 21% |
| Total | 98,127 | 95,717 | 99,299 | 100% | |
1 These totals may not match exactly those found in Section 4 due to the difference in data sources.
Sources: FAO, FishStat and Bank of Canada.
2.3 Demand
According to FAO data, per capita consumption of fish and seafood in Canada was 23 kg in 2004. This was not very high in comparison with that of countries where most Canadian marine products were exported to, such as China, Japan, Iceland, Norway and France. Canadian fish and seafood consumption, however, did slightly exceed that of its main trading partner, the United States, where per capita consumption was 21 kg in 2004.
| Country | Per capita annual consumption (kg) | ||||
|---|---|---|---|---|---|
| Fish and Seafood | Bovine meat | Pork | Chicken, Turkey | Total | |
| Iceland | 67 | 13 | 22 | 19 | 120 |
| Japan | 67 | 5 | 11 | 15 | 97 |
| Norway | 48 | 20 | 30 | 12 | 111 |
| China | 31 | 6 | 36 | 8 | 81 |
| France | 31 | 19 | 30 | 17 | 97 |
| Canada1 | 23 | 18 | 27 | 36 | 105 |
| United Kingdom | 22 | 16 | 18 | 30 | 85 |
| United States | 21 | 24 | 17 | 51 | 114 |
| Russia | 19 | 16 | 9 | 16 | 60 |
Source: FAO, FAOSTAT.
- Date modified: