
Commercial fisheries and aquaculture
After the Atlantic cod collapse of 1992 and the subsequent moratorium on the species in several zones in Atlantic Canada, commercial fishing has been significantly transformed in Canada. During the early 1990s, groundfish (cod in particular) were very prominent in both the harvesting and processing sectors. After the cod collapse, and over time, their importance has substantially declined: in 2004, groundfish accounted for less than 10% of the total value of commercial marine fisheries landings in Canada.
Crustaceans have largely replaced groundfish as the major species, and given their relatively higher price, have also driven up the total value generated by the fish harvesting industry. In 2004, the value of landings for crustaceans represented close to 70% of the total commercial marine fisheries landings in Canada. However, in terms of volume, marine fisheries ranked far ahead of crustaceans. The latter, in spite of the fact that they made up two-thirds of the value of Canadian fisheries, only represented slightly more than 30% of the total volume of commercial marine fisheries landings in 2004.
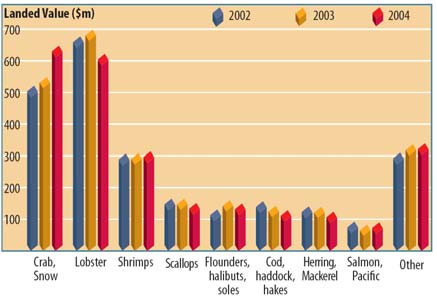
Figure 3.1: Total value of landings, major commercial marine species, Canada, 2002-2004
Source: DFO, Economic Analysis and Statistics.
The most important crustaceans are lobster, snow crab and shrimp. These three alone represented, on average, more than 65% of the total value of landings of commercial marine species in Canada between 2002 and 2004. Between 2002 and 2004, the value of snow crab landings rose by $126 million (26%) reaching a total of $613 million. This increase is attributable to an exceptionally high price of $5.93 per kilogram in 2004, despite a slight 3% decrease in the volume of landings.
The price of lobster and shrimp dipped in 2004 by 5% and 20%, respectively. The 3% drop in the volume of lobster landings combined with a lower price brought about an overall 8% drop in the value of lobster landings in 2004.
The value of shrimp landings, however, rose slightly (3%) in spite of the lower price, due to the abundance of this species which has led to an increase in quotas of close to 30% between 2002 and 2004.
Among the other commercial marine species in Canada, there were significant increases in the value of landings between 2002 and 2004 for Greenland halibut (+ $23m), Pacific Dungeness crab (+ $19m), Stimpson's surf clam, (+ $12m), capelin (+ $7m) and Pacific hake (+ $4m). The most significant declines in 2004 were in the value of landings for Pacific herring (- $15m), Atlantic cod (- $14m), scallop (- $12m), haddock (- $8m) and sablefish (-$6m).
The detailed evolution of the volume, value and price of landings of major commercial marine species in Canada between 2002 and 2004 is presented in Annex II, tables 6.1 to 6.3. In addition, an overview of the main fishing fleets in Atlantic Canada is presented in Annex I, tables 5.1 to 5.5.
3.1.1 Provinces
Of the six provinces that have a marine fishing industry, Nova Scotia and Newfoundland and Labrador were the two provinces where fisheries posted their highest values.
In 2004, 30% (332,000 metric tonnes) of the total volume of commercial marine fisheries in Canada was landed in Nova Scotia, representing a total of $744 million, or 33% of the value of all landed catches in the country. This represents a decrease of about 10% over 2002, when landings in Nova Scotia accounted for 368,000 metric tonnes valued at $809 million or 37% of the total value of commercial marine fisheries in Canada.
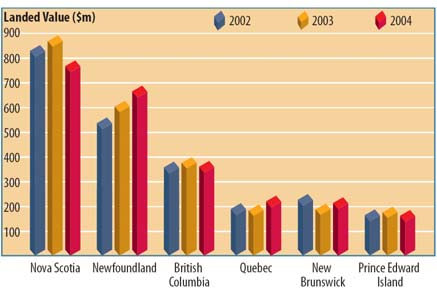
Figure 3.2: Total value of landings, commercial marine species, by province, Canada, 2002-2004
Source: DFO, Economic Analysis and Statistics.
The province of Newfoundland and Labrador (NL) has, in contrast, realized an increase of almost 30% in the volume and value of landings between 2002 and 2004, from a total of $514 million (275,000 metric tonnes) in 2002 to $645 million (358,000 metric tonnes) in 2004. Its share of total commercial marine fisheries landings in Canada increased by 5% during the same period, rising from 24% to 29% of the total value of sea port landings in the country.
British Columbia ranked third in commercial marine fisheries landings in Canada and contributed 15% of the total value of fisheries in the country in 2004; a total of $339 million (187, 000 metric tonnes). The volume and the value of landings in this province remained at virtually the same levels between 2002 and 2004.
Quebec and New Brunswick have fishing industries of comparable size and ranked fourth and fifth, respectively. The value of landings in New Brunswick was $193 million in 2004 compared to $200 million in Quebec. Both provinces accounted for 17% of the total value of landings in Canada. The value of landings in New Brunswick, however, decreased by 5% between 2002 and 2004, whereas Quebec's landings increased by 13% during the same period.
Prince Edward Island placed sixth in terms of volume and value of fisheries in Canada. In 2004, 6% of total value of commercial marine fisheries landings in Canadian waters was landed in Prince Edward Island ($140 million).
3.1.2 NAFO Areas, Atlantic Canada
Among the fishing zones of the Northwest Atlantic Fisheries Organisation (NAFO), the Southern Gulf of Saint Lawrence was the most lucrative fishing zone in Canada between 2002 and 2004. Significant lobster and snow crab stocks help to explain the importance of fisheries in this zone. Northeastern Newfoundland and Southern Scotian shelf were also lucrative zones throughout these years, contributing more than half of the total value of commercial marine fisheries landings in the Atlantic coast. In 2004, these three zones combined accounted for 70% of the total quantity of commercial marine fisheries landings and 76% of the value of landings in Atlantic Canada.
| NAFO Zones | Value of landings ($m) | % of total
(2004) |
||
|---|---|---|---|---|
| 2002 | 2003 | 2004 | ||
| Southern Gulf of St. Lawrence | 513 | 509 | 548 | 29% |
| Northeastern Newfoundland | 390 | 429 | 466 | 24% |
| Southern Scotian Shelf | 478 | 489 | 440 | 23% |
| Northern Scotian Shelf | 103 | 128 | 120 | 6% |
| Northern Gulf of St. Lawrence | 113 | 98 | 109 | 6% |
| Northern Labrador and Baffin Island | 78 | 96 | 96 | 5% |
| Southern Newfoundland | 65 | 68 | 70 | 4% |
| Georges Bank | 98 | 94 | 62 | 3% |
| Others | 9 | 11 | 11 | 1% |
| Total | 1,846 | 1,921 | 1,922 | 100% |
Source: DFO, Economic Analysis and Statistics.
3.1.3 Active fishing months in Atlantic Canada
Most of the landings on the Atlantic coast of Canada take place between May and October (75% of landings in 2004). The value of landings, however, reaches its peak between May and June. In 2004, landings during these two months reached a value of close to $892 million or almost half of the total value of landings for the year along the Atlantic coast of Canada.
During the months from October to March, there are few, if any, landings in New Brunswick, Prince Edward Island and Quebec. In Newfoundland and Labrador, landings are distributed throughout the entire year, reaching their highest values between May and July. Landed catches are higher during the 12 months of the year in Nova Scotia where values peak between May and July and again in December.
| Month | Value of landings ($m) | |||||
|---|---|---|---|---|---|---|
| NS | NB | PEI | Que | NL | Total | |
| January | 40 | 2 | 0 | 9 | 15 | 66 |
| February | 31 | 2 | 0 | 0 | 16 | 49 |
| March | 31 | 2 | 0 | 0 | 19 | 52 |
| April | 42 | 2 | 0 | 26 | 33 | 103 |
| May | 134 | 79 | 71 | 82 | 154 | 520 |
| June | 88 | 47 | 39 | 49 | 148 | 372 |
| July | 88 | 8 | 3 | 17 | 114 | 230 |
| August | 64 | 14 | 11 | 8 | 55 | 151 |
| September | 37 | 14 | 10 | 6 | 32 | 99 |
| October | 33 | 6 | 4 | 2 | 29 | 73 |
| November | 20 | 12 | 1 | 0 | 16 | 50 |
| December | 136 | 5 | 0 | 0 | 15 | 156 |
| Total | 744 | 193 | 140 | 199 | 645 | 1,922 |
Source: DFO, Economic Analysis and Statistics.
3.1.4 Fishing gear
Close to 60% of the value of marine fisheries in Canada in 2004 came from species caught with traps and pots such as snow crab and lobster. Trawling accounted for 17% of the Canadian total in terms of value and 32% in volume, since the prices of trawled species such as groundfish and shrimp are typically lower than those of species caught using pots and traps such as crab and lobster.
Figure 3.3: Total value of landings, commercial marine species, by fishing gear type, Canada, 2004

Source: DFO, Economic Analysis and Statistics.
3.1.5 Vessels
In 2004, there were more than 16,596 'active' vessels in Canada; i.e. vessels which had one or more marine species landings registered during the year. This number dropped slightly compared to 2002 when active vessels added up to 16,750.
The majority (90%) of these vessels are inshore vessels, i.e., with a vessel length of less than 45'. However, mid-shore and offshore vessels (> 45') that accounted for less than 10% of the total active fishing vessels in Canada in 2004, represented more than 45% of the total value of commercial fisheries landings in the country.
| Vessel length | Number of active vessels1 | % of total
(2004) |
||
|---|---|---|---|---|
| 2002 | 2003 | 2004 | ||
| 1' - 34'11'' | 8,370 | 7,730 | 8,048 | 48% |
| 35' - 44'11'' | 7,020 | 6,856 | 7,064 | 42% |
| 45' - 64'11'' | 1,186 | 1,482 | 1,324 | 8% |
| 65' - 99'11'' | 211 | 210 | 215 | 1% |
| More than 100' | 94 | 92 | 83 | 0% |
| Total | 16,750 | 16,248 | 16,596 | 100% |
1 Vessels which had one or more marine species landings during the year.
Source: DFO, Economic Analysis and Statistics.
Figure 3.4 : Total value of landings, commercial marine species, by boat length, Canada, 2004
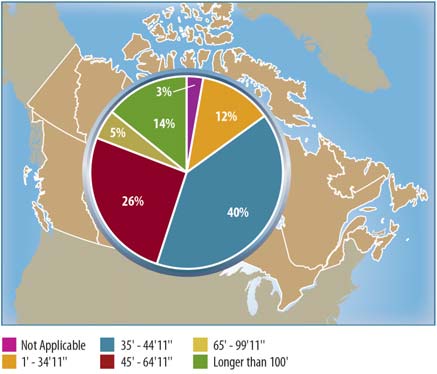
Source: DFO, Economic Analysis and Statistics.
In 2004, the average value of landings by fishing vessels in Canada was $136,200. Of the major commercial marine species in 2004, the average landings by vessel for Northern shrimp (pandalus borealis) and Pacific herring posted a higher value, with an average of more than $330,000 per vessel. The average value of landings by vessel for lobster and cod was considerably lower but nevertheless involved a significant number of vessels (more than 12,000 vessels).
| Major species | Number of active vessels and average value of landings1 | ||
|---|---|---|---|
| # active vessels | # active vessels as % of total vessels | Average value of landings by vessel ($) | |
| Snow crab | 3,480 | 21% | 176,153 |
| Lobster | 8,654 | 52% | 68,194 |
| Shrimp, p. borealis2 | 565 | 3% | 433,450 |
| Scallops | 719 | 4% | 166,102 |
| Dungeness crab | 223 | 1% | 209,887 |
| Pacific halibut | 260 | 2% | 145,869 |
| Greenland halibut | 812 | 5% | 45,927 |
| Herring, Pacific | 106 | 1% | 339,961 |
| Herring | 1,570 | 9% | 22,809 |
| Atlantic cod | 4,088 | 25% | 8,663 |
| Total | 16,596 | 100% | 136,211 |
1 There is no direct link between the value of landings and the net income by vessel since operating costs vary from one fishery to another.
2 This species represented more than 90% of the total value of shrimp landings in Canada in 2004.
Source: DFO, Economic Analysis and Statistics.
In 2004, more than one-third (37%) of active fishing vessels in Canada had landings in the province of Newfoundland and Labrador (6,226 vessels). Nova Scotia came in second, with 3,911 vessels or 23% of the Canadian total. Since 2002, the number of active vessels has declined in all provinces except Prince Edward Island.
| Province | Number of active vessels1 | % of total
(2004) |
||
|---|---|---|---|---|
| 2002 | 2003 | 2004 | ||
| Nova Scotia | 3,918 | 3,911 | 3,911 | 23% |
| New Brunswick | 1,994 | 1,943 | 1,958 | 12% |
| Prince Edward Island | 1,400 | 1,358 | 1,416 | 8% |
| Quebec | 1,257 | 1,182 | 1,236 | 7% |
| Newfoundland and Labrador | 6,268 | 5,949 | 6,226 | 37% |
| British Columbia | 2,483 | 2,442 | 2,403 | 14% |
| Total2 | 16,750 | 16,248 | 16,596 | 100% |
1 Vessels which had one or more marine species landings during the year.
2 The sum may not add up to the totals given that some vessels may have landings in more than one province.
Source: DFO, Economic Analysis and Statistics.
3.2 Commercial freshwater fisheries
In Canada, commercial fishing of freshwater species is relatively small compared to commercial marine fishing. With a total value of landings of $64 million in 2004, commercial freshwater fisheries represented less than 3% of the total value of commercial fishing in Canada. The major water bodies where these fisheries mainly take place are Lake Winnipeg, Cedar Lake, Lake Manitoba, Lake Winnipegosis and Great Slave Lake.
Between 2002 and 2004, the total value landings of commercial freshwater species fell by $25 million (- 25%). The volume of landings only decreased by 11% during this period, but the prices of freshwater species were 20% lower overall, which explains the substantial drop in the total value of landings.
| Species | Value of landings ($’000) | Share of total
in 2004 (%) |
||
|---|---|---|---|---|
| 2002 | 2003 | 2004 | ||
| Pickerel | 33,131 | 29,059 | 26,130 | 41% |
| Perch | 16,475 | 14,265 | 12,694 | 20% |
| Whitefish | 15,014 | 12,877 | 10,790 | 17% |
| Smelt | 2,235 | 1,787 | 3,121 | 5% |
| White bass | 3,009 | 2,666 | 2,562 | 4% |
| Sauger | 3,528 | 2,580 | 1,866 | 3% |
| Pike | 2,072 | 1,589 | 1,203 | 2% |
| Sucker (Mullet) | 1,544 | 1,207 | 756 | 1% |
| Lake trout | 506 | 620 | 586 | 1% |
| Others | 7,587 | 4,639 | 4,086 | 6% |
| Total | 85,101 | 71,289 | 63,794 | 100% |
Source: DFO, Central and Arctic, Policy Sector.
The main freshwater species that are commercially fished in Canada are pickerel, perch and whitefish. The landings of these three species represented close to 80% of the total landed catches of freshwater fish in Canada in 2004.
Ontario and Manitoba led the way in commercial freshwater fishing with landed values of $30 million and $25 million, respectively, in 2004. Both provinces accounted for 85% of the value of all commercial freshwater fisheries landings in Canada that year.
| Provinces | Value of landings ($’000) | % of total
(2004) |
||
|---|---|---|---|---|
| 2002 | 2003 | 2004 | ||
| Ontario | 38,702 | 31,782 | 29,513 | 46% |
| Manitoba | 33,228 | 27,245 | 24,655 | 39% |
| Saskatchewan | 5,836 | 4,346 | 2,985 | 5% |
| Quebec | 2,864 | 2,715 | 2,977 | 5% |
| Alberta | 2,300 | 3,034 | 2,249 | 4% |
| Northwest Territories | 1,475 | 1,231 | 1,009 | 2% |
| New Brunswick | 697 | 936 | 406 | 1% |
| Total | 85,101 | 71,289 | 63,794 | 100% |
Source: DFO, Central and Arctic, Policy Sector.
3.3 Aquaculture
The total value of aquaculture production rose to $527 million in Canada in 2004. Close to 75% of this value came from farmed salmon in British Columbia and in New Brunswick. Since the production of Canadian farmed salmon fell in 2004, so did the overall value of all aquaculture production (-16%), despite an increase in the value of other species such as farmed mussels in Prince Edward Island.
| Species | Value of Canadian aquaculture production ($’000) | Variation
2002-2004 (%) |
||
|---|---|---|---|---|
| 2002 | 2003 | 2004 | ||
| Salmon | 502,036 | 441,471 | 387,038 | -23% |
| Mussels | 31,281 | 30,929 | 32,761 | 5% |
| Trout | 32,643 | 25,714 | 22,086 | -32% |
| Oysters | 15,176 | 19,208 | 16,207 | 7% |
| Clams | 7,100 | 7,903 | 7,052 | -1% |
| Total aquaculture | 628,318 | 590,984 | 526,562 | -16% |
Source: Statistics Canada, Agriculture Division.
British Columbia and New Brunswick dominate Canadian aquaculture production, particularly in the case of salmon. Farmed salmon production was concentrated in these two provinces in 2004. Prince Edward Island, which boasts valuable farmed mussel production, ranked third in Canada in terms of the value of its aquaculture production that year.
| Selected Provinces | Value of Canadian aquaculture production ($’000) | |||
|---|---|---|---|---|
| Salmon | Mussels | Trout | Total | |
| British Columbia | 212,038 | 278 | 714 | 227,788 |
| New Brunswick | 175,000 | 500 | 4,000 | 181,005 |
| Prince Edward Island | x | 23,249 | x | 33,175 |
| Newfoundland and Labrador | x | 5,055 | 0 | 22,055 |
| Nova Scotia | x | 3,198 | 0 | 19,127 |
| Ontario | 0 | 0 | 15,500 | 15,500 |
| Quebec | 0 | 481 | 1,831 | 11,439 |
| Canada | 387,038 | 32,761 | 22,086 | 526,562 |
Source: Statistics Canada, Agriculture Division.
- Date modified: