
Canada's position among the world's fisheries
2.1 Harvesting
The Food and Agriculture Organization (FAO) of the United Nations ranks Canada in 20th place in terms of the global volume of fish landings in 2006; this represents 1% of the world total. This is a drop of one position from 2005, when Canada was ranked 19th. The top three countries with respect to total fish landings were China, Peru and the U.S. respectively. Collectively, they accounted for 31% of worldwide catches in 2006.
While global aquaculture production has continued to increase, fish landings have effectively decreased by 2% in 2006 as compared to the previous year.
| Rank | Country | Volume of Landings (,000 t) | |||
|---|---|---|---|---|---|
| 2004 | 2005 | 2006 | % change 2005-2006 |
||
| 1 | China1 | 17,440 | 17,525 | 17,572 | 0% |
| 2 | Peru | 9,612 | 9,394 | 7,021 | -25% |
| 3 | United States | 4,995 | 4,961 | 4,866 | -2% |
| 4 | Indonesia | 4,653 | 4,704 | 4,769 | 1% |
| 5 | Chile | 5,312 | 4,738 | 4,474 | -6% |
| 6 | Japan | 4,428 | 4,196 | 4,302 | 3% |
| 7 | India | 3,391 | 3,691 | 3,855 | 4% |
| 8 | Russia | 3,000 | 3,248 | 3,350 | 3% |
| 9 | Thailand | 2,840 | 2,814 | 2,776 | -1% |
| 10 | Norway | 2,673 | 2,547 | 2,401 | -6% |
| … | |||||
| 20 | Canada2 | 1,193 | 1,124 | 1,074 | -4% |
| - | Other countries | 36,419 | 36,561 | 36,689 | 0% |
| Total | 95,955 | 95,504 | 93,150 | -2% | |
1Includes Hong Kong and Macao.
2Canadian figures may not match exactly those found in Section 3 due to different data sources.
Source: FAO, FishStat Plus, Capture Production.
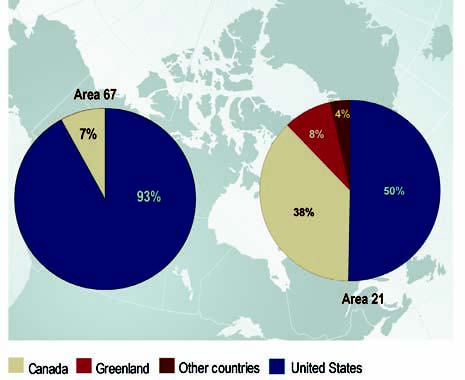
Canadian fish harvesters operate in FAO Footnote 1 fishing areas 21 and 67. Area 21 covers the northwest portion of the Atlantic Ocean, while area 67 includes the northeast part of the Pacific; i.e., both oceans that border Canada to the east and to the west.
In 2006, 5,283 thousand tons of global fish landings were from these two areas, including 1,042 thousand tonnes in Canada (20% of total). Most landings were in the U.S., for a total of 3,973 thousand tons, which represents 75% of the overall landings in these two areas. Total catches in the northeast Pacific and northeast Atlantic represented close to 6% of worldwide catches in 2006.
Figure 2.1: Total catches on the Atlantic and Pacific coasts of Canada and the United States (FAO areas 21 and 67), by country, 2006
Source: FAO, FishStat Plus, Capture Production.
Canada has a more significant position in the Atlantic Northwest than in the Pacific Northeast. In 2006, Canadian fisheries accounted for 38% of catches reported in the Atlantic Northwest (area 21), and 7% of catches in the Pacific North east (area 67).
On average, the United States had close to half of total catches in the northeast Atlantic between 2004 and 2006, compared to 38% for Canada. In terms of volume, Canada ranked first at the beginning of the 1990's: catches by Canadian fish harvesters at that time represented 42% of total catches (average for 1988-1990), as compared to 40% for American fish harvesters. It should be noted that following the collapse of Atlantic cod stocks at the beginning of the 1990's, the total landings in the Atlantic have decreased by nearly 30%.
2.2 Aquaculture
With aquaculture production amounting to about 171 thousands of tonnes in 2006, Canada ranked 23rd in the world in terms of volume and 16th in terms of value. China ranked first in aquaculture production, as it did with respect to marine fisheries. In 2006, the total volume of commercial aquaculture in China reached 45,301 thousand tones, valued at $49.5 billion, exceeding two thirds of the aquaculture production worldwide.
As opposed to marine fisheries, the worldwide aquaculture production experienced significant growth of 11.5% in terms of volume from 2004 to 2006. Several countries, including Pakistan, Mexico, Indonesia, Italy, Myanmar, Vietnam, Turkey and South Korea had growth rates exceeding 30% during that period. In comparison, Canadian aquaculture production increased by 18% between 2004 and 2006.
| Rank | Country | Aquaculture Production, Thousand | |||
|---|---|---|---|---|---|
| 2004 | 2005 | 2006 | % change 2005-2006 |
||
| 1 | China1 | 41,334 | 43,275 | 45,301 | 5% |
| 2 | india | 2,799 | 2,967 | 3,128 | 5% |
| 3 | Indonesia | 1,469 | 2,124 | 2,220 | 5% |
| 4 | Philippines | 1,717 | 1,896 | 2,092 | 10% |
| 5 | Viet Nam | 1,229 | 1,467 | 1,688 | 15% |
| 6 | Thailand | 1,260 | 1,304 | 1,386 | 6% |
| 7 | South Korea | 953 | 1,058 | 1,279 | 21% |
| 8 | Japon | 1,261 | 1,254 | 1,224 | -2% |
| 9 | Bangladesh | 915 | 882 | 892 | 1% |
| 10 | Chile | 685 | 714 | 836 | 17% |
| … | |||||
| 23 | Canada2 | 145 | 155 | 171 | 11% |
| - | Other countries | 6,101 | 6,204 | 6,530 | 5% |
| Total | 59,867 | 63,299 | 66,747 | 5% | |
1Includes Hong Kong and Macao.
2Canadian figures may not match exactly those found in Section 3 due to different data sources.
Source: FAO, FishStat Plus, Aquaculture Production dataset. 2.3 International trade
2.3 International trade
Since 2004, Canada has ranked 6th worldwide among seafood exporting countries in terms of total export value, behind the United States and Denmark, among others. This represents a drop in rank, as in 2003, Canada was 5th, just ahead of Denmark. China has remained the top seafood exporting country between 2004 and 2006, with an export share of 11% in 2006, 7% higher than Canada's share. However, the Chinese share of world exports is considerably less than its share of the global aquaculture production value (68%) and of its percentage of global fishing volume (19%), which can be explained by the fact that a major part of the Chinese aquaculture production goes to the domestic market.
In comparison, Canada exports a larger share of its catches and its aquaculture production, estimated at 85% Footnote 2 (by value). This partly explains that while Canada's wild fisheries and aquaculture production represent about 1% of the worldwide total, Canadian exports amount to 4% of the total value of worldwide exports of fish and seafood.
International trade in seafood has evolved considerably during the last decade. In 1990, the United States and Canada were respectively 1st and 2nd in terms of seafood export value. Beginning in 1991, the gradual decrease in groundfish catches coupled with increased aquaculture production in Asian countries caused Canada to slip from 2nd to 7th place in total export value in 1993. Since 1993, Canada has not been among the top four major seafood exporters.
| Rank | Country | Exports Value1 ($m) | |||
|---|---|---|---|---|---|
| 2004 | 2005 | 2006 | % change 2005-2006 |
||
| 1 | China2 | 9,401 | 9,796 | 10,828 | 11% |
| 2 | Norway | 5,429 | 5,963 | 6,287 | 5% |
| 3 | Thailand | 5,276 | 5,421 | 5,948 | 10% |
| 4 | United States | 5,090 | 5,194 | 4,752 | -9% |
| 5 | Denmark | 4,656 | 4,477 | 4,535 | 1% |
| 6 | Canada3 | 4,564 | 4,380 | 4,177 | -5% |
| 7 | Chile | 3,315 | 3,687 | 4,127 | 12% |
| 8 | Viet Nam | 3,189 | 3,351 | 3,814 | 14% |
| 9 | Spain | 3,360 | 3,154 | 3,257 | 3% |
| 10 | Netherlands | 3,213 | 3,438 | 3,206 | -7% |
| - | Other countries | 47,492 | 48,861 | 50,932 | 4% |
| Total | 94,384 | 96,085 | 98,571 | 3% | |
1Includes re-exports.
2Includes Hong Kong and Macao.
3Canadian figures may not match exactly those found in Section 4 due to different data sources.
Source: FAO, FishStat Plus, Fisheries Commodities Production and Trade dataset.
Table 2.4 on the following page shows the main Canadian fish and seafood exports by volume by product group in 2006. Canada has a significant share of worldwide exports of some products, such as smoked herring (66% of worldwide exports of this product are Canadian products), lobster (52%), frozen crab (37%), fish livers and roes (29%), Greenland, Atlantic and Pacific halibut (17%) and fresh haddock (14%).
| Product1 | Exports Value2 ($m) | |||
|---|---|---|---|---|
| Canada 20063 | World 2006 | % of Canadian exports | % of World exports | |
| Lobster, live, frozen or preserved | 590 | 1,142 | 14% | 52% |
| Crabs, whether in shell or not, frozen | 463 | 1,252 | 11% | 37% |
| Salmon, fresh, frozen or preserved | 629 | 6,814 | 15% | 9% |
| Shrimp, frozen or preserved | 465 | 15,293 | 11% | 3% |
| Fish fillets, fresh or frozen | 144 | 9,987 | 3% | 1% |
| Sea urchins and other molluscs, fresh or frozen | 161 | 1,545 | 4% | 10% |
| Scallop, fresh or frozen | 104 | 1,061 | 3% | 10% |
| Greenland, Atlantic and Pacific halibut, fresh or frozen | 110 | 663 | 3% | 17% |
| Fish livers and roes, dried, smoked, salted or in brine | 50 | 173 | 1% | 29% |
| Mackerel (Scomber spp.), frozen | 59 | 1,038 | 1% | 6% |
| Hake, frozen | 54 | 585 | 1% | 9% |
| Haddock, fresh or chilled | 23 | 172 | 1% | 14% |
| Herring, including fillets, smoked | 25 | 38 | 1% | 66% |
| Other | 1,299 | 58,807 | 31% | 2% |
| Total | 4,177 | 98,571 | 100% | 4% |
1Products grouped according to Harmonized System (HS) categories.
2Includes re-exports.
3Canadian figures may not match exactly those found in Section 4 due to different data sources. Source: FAO, FishStat Plus, Fisheries Commodities Production and Trade dataset.
Canada imports far less fish and seafood than it exports, and ranked 14th on the 2006 world list of seafood importers. Canada's rank has dropped two positions since 2005 when it ranked 12th worldwide. Japan and the United States were the top two major fish and seafood importers during 2006 and they accounted for 31% of the worldwide import value for that year.
| Rank | Country | Imports Value ($m) | |||
|---|---|---|---|---|---|
| 2004 | 2005 | 2006 | % change 2005-2006 |
||
| 1 | Japan | 19,302 | 17,846 | 16,171 | -9% |
| 2 | United States | 15,721 | 14,648 | 15,197 | 4% |
| 3 | Spain | 6,818 | 6,844 | 7,233 | 6% |
| 4 | China1 | 6,671 | 7,229 | 7,126 | -1% |
| 5 | France | 5,488 | 5,579 | 5,794 | 4% |
| 6 | Italy | 5,113 | 5,150 | 5,382 | 5% |
| 7 | Germany | 3,684 | 3,953 | 4,285 | 8% |
| 8 | United Kingdom | 3,700 | 3,889 | 4,255 | 9% |
| 9 | Denmark | 3,083 | 3,183 | 3,333 | 5% |
| 10 | Korea, Republic of | 2,940 | 2,887 | 3,139 | 9% |
| … | |||||
| 14 | Canada2 | 2,040 | 2,048 | 2,089 | 2% |
| - | Other countries | 25,135 | 26,875 | 29,020 | 8% |
| Total | 99,694 | 100,130 | 103,023 | 3% | |
1Includes Hong Kong and Macao.
2Canadian figures may not match exactly those found in Section 4 due to different data sources. Source: FAO, FishStat Plus, Fisheries Commodities Production and Trade dataset.
2.4 Demand
As the annual seafood consumption data for 2006 were unavailable at the time of this report, 2005 values are presented here.
| Country | Annual consumption per capita (kg), 2005 | ||||
|---|---|---|---|---|---|
| Seafood1 | Bovine meat |
Pork | Chicken and Turkey |
Total | |
| Iceland | 91.4 | 11.7 | 18.7 | 20.0 | 141.8 |
| Japan | 64.9 | 6.5 | 13.0 | 14.8 | 99.2 |
| Norway | 47.4 | 18.5 | 30.3 | 12.5 | 108.7 |
| France | 33.5 | 16.6 | 29.6 | 20.2 | 99.9 |
| China | 25.9 | 6.6 | 38.1 | 8.0 | 78.6 |
| USA | 23.8 | 22.6 | 17.4 | 52.4 | 116.3 |
| Canada | 23.1 | 15.9 | 27.3 | 36.4 | 102.8 |
| UK | 20.0 | 17.2 | 20.3 | 29.8 | 87.4 |
| Russian Federation | 17.3 | 16.0 | 7.9 | 17.3 | 58.6 |
| Germany | 14.3 | 12.6 | 47.5 | 13.4 | 87.8 |
1Sum of "fish" and "aquatic products, other" categories. Source: FAOSTAT, Statistics division, FAO. Data copied: November 14, 2007, http://faostat.fao.org.
- Date modified: