
Canada's position among the world's fisheries
2.1 Harvesting
The Food and Agriculture Organization (FAO) of the United Nations ranked Canada in 22nd place in terms of the global volume of fish landings in 2008; this represents just over 1% of the world total. This is a drop of two positions from 2007, when Canada was ranked 20th. The top three countries with respect to total fish landings were China, Peru and Indonesia, respectively. Collectively, they accounted for over 30% of worldwide catches in 2008.
While global aquaculture production has continued to increase, fish landings remained static in 2008 as compared to 2007.
| Rank | Country | Volume of Landings (,000 t) | |||
|---|---|---|---|---|---|
| 2006 | 2007 | 2008 | % change
2007-2008 |
||
| 1 | China1 | 15,062 | 15,143 | 15,317 | 1% |
| 2 | Peru | 7,021 | 7,221 | 7,377 | 2% |
| 3 | Indonesia | 4,819 | 5,055 | 4,960 | -2% |
| 4 | United States | 4,859 | 4,770 | 4,357 | -9% |
| 5 | Japan | 4,420 | 4,402 | 4,355 | -1% |
| 6 | India | 3,845 | 3,859 | 4,105 | 6% |
| 7 | Chile | 4,462 | 4,131 | 3,939 | -5% |
| 8 | Russian Federation | 3,296 | 3,463 | 3,394 | -2% |
| 9 | Philippines | 2,322 | 2,503 | 2,565 | 2% |
| 10 | Myanmar | 2,007 | 2,236 | 2,494 | 12% |
| … | |||||
| 22 | Canada2 | 1,080 | 1,025 | 950 | -7% |
| - | Other countries | 37,545 | 37,180 | 36,988 | -1% |
| Total | 90,737 | 90,989 | 90,800 | 0% | |
1Includes Hong Kong and Macao.
2Canadian figures may not match exactly those found in Section 3 due to different data sources. Source: FAO, FishStat Plus, Capture Production (February 2010).
Canadian fish harvesters operated in FAO Footnote 1 fishing areas 2, 21 and 67. Area 2 covers all inland freshwater commercial fisheries. Area 21 covers the northwest portion of the Atlantic Ocean, while area 67 includes the northeast part of the Pacific; i.e., both oceans that border Canada to the east and to the west. There was effectively no activity in FAO fishing area 18 despite the fact our northern territories border this area. In 2008, 4,638 thousand tonnes of global fish landings were from these two areas, including 919 thousand tonnes in Canada (20% of total). Most landings were in the U.S., for a total of 3,444 thousand tonnes, which represents 74% of the overall landings in these two areas. Total catches in the northeast Pacific and northwest Atlantic represented approximately 5% of worldwide catches in 2008.
Figure 2.1: Total catches on the Atlantic and Pacific coasts of Canada, the United States and Greenland (FAO areas 21 and 67), by country, 2008
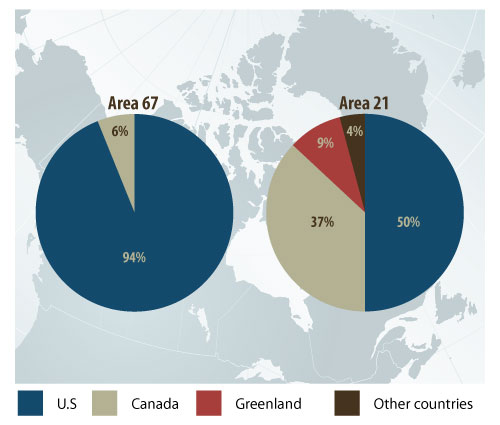
Source: FAO, FishStat Plus, Capture Production (February 2010).
Canada has a significantly higher presence in the Atlantic Northwest than in the Pacific Northeast. In 2008, Canadian fisheries accounted for 37% of catches reported in the Atlantic Northwest (zone 21), and almost 6% of catches in the Pacific Northeast (zone 67).
On average, the United States had close to half (49%) of the total catches in the northwest Atlantic between 2006 and 2008, compared to 38% for Canada. In terms of volume, Canada ranked first at the beginning of the 1990's: catches by Canadian fish harvesters at that time represented 42% of the total catches (average for 1988-1990), as compared to 40% for American fish harvesters. It should be noted that following the collapse of the Atlantic cod stocks at the beginning of the 1990s, the total landings in the Atlantic have decreased by nearly 40%.
2.2 Aquaculture
With aquaculture production amounting to about 144 thousand tonnes in 2008, Canada ranked 27th in the world in terms of volume and 20th in terms of value. China ranked first in aquaculture production, as it did with respect to marine fisheries. In 2008, the total volume of commercial aquaculture in China was 42,674 thousand tonnes, over 62% of worldwide aquaculture production. The value of production for China's aquaculture industry was $59.8 billion in 2008.
As opposed to marine fisheries, the worldwide aquaculture production experienced a growth of 11% in terms of volume from 2006 to 2008. Among countries with levels of production in excess of 50,000 tonnes, Indonesia, Vietnam, Malaysia, Nigeria and Uganda, had growth rates between 45% and 70% in the same period. In comparison, Canadian aquaculture production decreased by 16% between 2006 and 2008.
| Rank | Country | Aquaculture Production (,000 t) | |||
|---|---|---|---|---|---|
| 2006 | 2007 | 2008 | % change
2007-2008 |
||
| 1 | China1 | 39,363 | 41,177 | 42,674 | 4% |
| 2 | Indonesia | 2,479 | 3,121 | 3,855 | 23% |
| 3 | India | 3,181 | 3,112 | 3,479 | 12% |
| 4 | Viet Nam | 1,694 | 2,123 | 2,497 | 18% |
| 5 | Philippines | 2,092 | 2,215 | 2,408 | 9% |
| 6 | Korea, Republic of | 1,279 | 1,399 | 1,395 | 0% |
| 7 | Thailand | 1,407 | 1,351 | 1,374 | 2% |
| 8 | Japan | 1,224 | 1,286 | 1,188 | -8% |
| 9 | Bangladesh | 892 | 946 | 1,006 | 6% |
| 10 | Chile | 832 | 806 | 871 | 8% |
| … | |||||
| 27 | Canada2 | 171 | 153 | 144 | -6% |
| - | Other countries | 6,774 | 7,138 | 7,459 | 4% |
| Total | 61,389 | 64,828 | 68,349 | 5% | |
1Includes Hong Kong and Macao.
2Canadian figures may not match exactly those found in Section 3 due to different data sources.
Source: FAO, FishStat Plus, Aquaculture Production (March 2010).
2.3 International trade
Since 2007, Canada has ranked 8th worldwide among seafood exporting countries in terms of total export value, behind the United States and Chile, among others. This represents a drop in rank, as in 2006, Canada was 6th, just ahead of Chile. China has remained the top seafood exporting country between 2006 and 2008, with an export share of 10.5% in 2008, almost 7% higher than Canada's share. However, China's 8% share of world export value is considerably less than its share of the global aquaculture production value (53%) and its percentage of global fishing volume (17%), which can be explained by the fact that a major part of the Chinese aquaculture production goes to the domestic market.
In comparison, Canada exports a larger share of its catches and its aquaculture production, estimated at 85% Footnote 2 (by value). This partly explains that, while Canada's wild fisheries and aquaculture production represent about 0.7% of the worldwide total (by volume), Canadian exports amount to 3.6% of the total value of worldwide exports of fish and seafood.
International trade in seafood has evolved considerably during the last two decades. In 1990, the United States and Canada were respectively 1st and 2nd in terms of seafood export value. Beginning in 1991, the gradual decrease in groundfish catches coupled with increased aquaculture production in Asian countries caused Canada to slip from 2nd to 7th place in total export value in 1993. Since 1993, Canada has not been among the top four major seafood exporters, although the value of exports from 2000-2004 resulted in Canada ranking as the fifth largest seafood exporting nation in the world. Export values have declined gradually to our current world ranking.
| Rank | Country | Exports Value1 ($m) | |||
|---|---|---|---|---|---|
| 2006 | 2007 | 2008 | % change
2007-2008 |
||
| 1 | China2 | 10,828 | 10,650 | 11,543 | 8% |
| 2 | Norway | 6,287 | 6,760 | 7,456 | 10% |
| 3 | Thailand | 5,983 | 6,149 | 6,980 | 14% |
| 4 | Denmark | 4,535 | 4,455 | 4,924 | 11% |
| 5 | Viet Nam | 3,833 | 4,074 | 4,860 | 19% |
| 6 | United States | 4,752 | 4,836 | 4,833 | 0% |
| 7 | Chile | 4,127 | 4,052 | 4,293 | 6% |
| 8 | Canada3 | 4,177 | 4,012 | 3,976 | -1% |
| 9 | Spain | 3,257 | 3,510 | 3,733 | 6% |
| 10 | Netherlands | 3,206 | 3,547 | 3,640 | 3% |
| - | Other countries | 47,806 | 49,740 | 53,863 | 8% |
| Total | 98,791 | 101,784 | 110,101 | 8% | |
1Includes re-exports.
2Includes Hong Kong and Macao.
3Canadian figures may not match exactly those found in Section 4 due to different data sources.
Source: FAO, FishStat Plus, Fisheries Commodities Production and Trade (December 2010).
Table 2.4 below shows the main Canadian fish and seafood exports by volume by product group in 2008. Canada has a significant share of worldwide exports of some products, such as smoked herring (63% of worldwide exports of this product are Canadian products), lobster (51%), frozen crab (39%), fish livers and roes (26%), Greenland, Atlantic and Pacific halibut (13%) and fresh haddock (14%).
| Product1 | Exports Value2 ($m) | ||
|---|---|---|---|
| Canada 20083 | % of Canadian exports | % of World exports | |
| Lobster, live, frozen or preserved | 555 | 14% | 51% |
| Crabs, whether in shell or not, frozen | 566 | 14% | 39% |
| Salmon, fresh, frozen or preserved | 546 | 14% | 7% |
| Shrimp, frozen or preserved | 369 | 9% | 2% |
| Fish fillets, fresh or frozen | 139 | 3% | 1% |
| Sea urchins and other molluscs, fresh or frozen | 139 | 4% | 9% |
| Scallop, fresh or frozen | 112 | 3% | 11% |
| Greenland, Atlantic and Pacific halibut, fresh or frozen | 86 | 2% | 13% |
| Fish livers and roes, dried, smoked, salted or in brine | 54 | 1% | 26% |
| Mackerel (Scomber spp.), frozen | 52 | 1% | 4% |
| Hake, frozen | 62 | 2% | 10% |
| Haddock, fresh or chilled | 24 | 1% | 14% |
| Herring, including fillets, smoked | 28 | 1% | 63% |
| Other | 1,243 | 31% | 2% |
| Total | 3,976 | 100% | 4% |
1Products grouped according to Harmonized System (HS) categories.
2Includes re-exports.
3Canadian figures may not match exactly those found in Section 4 due to different data sources.
Source: FAO, FishStat Plus, Fisheries Commodities Production and Trade (December 2010).
Canada imports far less fish and seafood than it exports, and ranked as the 16th highest seafood importer in the world in 2008. Canada's rank has dropped two positions since 2006 when it ranked 14th worldwide. Japan and the United States were the top two major fish and seafood importers in 2008 and they accounted for 27% of the worldwide value of imports.
| Rank | Country | Imports Value ($m) | |||
|---|---|---|---|---|---|
| 2006 | 2007 | 2008 | % change
2007-2008 |
||
| 1 | Japan | 16,171 | 14,445 | 16,236 | 12% |
| 2 | United States | 15,197 | 14,784 | 15,218 | 3% |
| 3 | China1 | 7,126 | 7,393 | 8,250 | 12% |
| 4 | Spain | 7,233 | 7,529 | 7,597 | 1% |
| 5 | France | 5,794 | 5,820 | 6,283 | 8% |
| 6 | Italy | 5,382 | 5,561 | 5,845 | 5% |
| 7 | Germany | 4,285 | 4,647 | 4,845 | 4% |
| 8 | United Kingdom | 4,255 | 4,497 | 4,538 | 1% |
| 9 | Denmark | 3,333 | 3,255 | 3,431 | 5% |
| 10 | Korea, Republic of | 3,165 | 3,359 | 3,160 | -6% |
| … | |||||
| 16 | Canada2 | 2,089 | 2,176 | 2,221 | 2% |
| - | Other countries | 29,539 | 33,391 | 38,144 | 14% |
| Total | 103,569 | 106,855 | 115,769 | 8% | |
1Includes Hong Kong and Macao.
2Canadian figures may not match exactly those found in Section 4 due to different data sources.
Source: FAO, FishStat Plus, Fisheries Commodities Production and Trade (December 2010).
- Date modified: