
Book 1, Tab A6 - Financial outlook
Total planned authorities and resource allocation
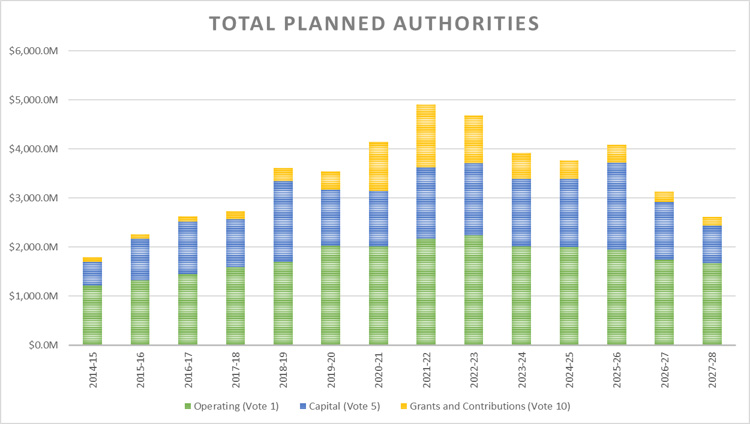
Total planned authorities
Text version: Total planned authorities
| - | 2014-15 | 2015-16 | 2016-17 | 2017-18 | 2018-19 | 2019-20 | 2020-21 | 2021-22 | 2022-23 | 2023-24 | 2024-25 | 2025-26 | 2026-27 | 2027-28 |
|---|---|---|---|---|---|---|---|---|---|---|---|---|---|---|
| Operating (Vote 1) | $1,218.7M | $1,324.6M | $1,457.9M | $1,596.3M | $1,700.9M | $2,028.1M | $2,014.5M | $2,165.8M | $2,241.2M | $2,011.0M | $2,001.2M | $1,940.8M | $1,742.0M | $1,680.4M |
| Capital (Vote 5) | $486.4M | $843.0M | $1,064.9M | $972.8M | $1,641.3M | $1,141.3M | $1,129.8M | $1,467.2M | $1,471.7M | $1,381.6M | $1,392.6M | $1,780.7M | $1,179.1M | $765.2M |
| Grants and Contributions (Vote 10) | $91.5M | $96.9M | $102.0M | $159.7M | $272.9M | $374.9M | $1,004.8M | $1,280.8M | $967.4M | $532.4M | $377.7M | $359.8M | $206.9M | $167.8M |
| Total | $1,796.6M | $2,264.5M | $2,624.8M | $2,728.8M | $3,615.1M | $3,544.3M | $4,149.1M | $4,913.7M | $4,680.2M | $3,925.0M | $3,771.6M | $4,081.3M | $3,128.1M | $2,613.3M |
2014-15 to 2021-22 authorities represent year-end authorities, as per Public Accounts
Does not reflect potential future renewal of sunsetters or funding related to Budget 2023 announcements
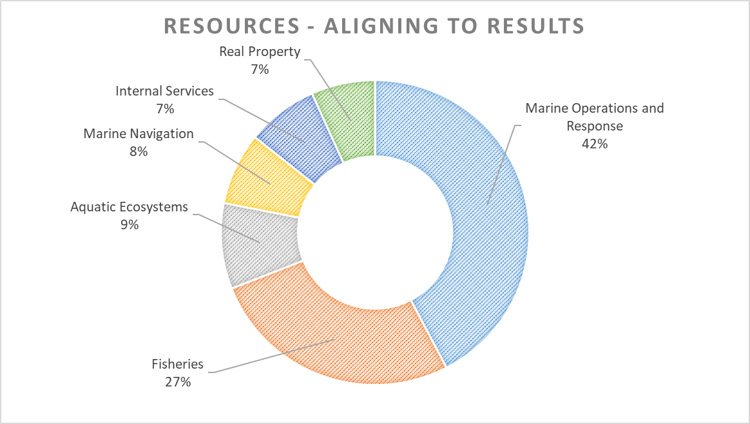
Resources – Aligning to results
Text version: Resources – Aligning to results
Figure 2: Resources – Aligning to results
- Marine Operations and Response: 42%
- Fisheries: 27%
- Aquatic Ecosystems: 9%
- Marine Navigation: 8%
- Internal Services: 8%
- Real Property: 7%
- Total: 100%
Planned authorities and resource allocation
- DFO is a highly decentralized department, managing a 2023-24 budget of ~$4.1 billion, including $186M in statutory authorities
- The Department has recently received an injection of funding to implement key initiatives, notably $1.0 billion from 2022-23 to 2030-31 and $64 million on-going for the Oceans Protection Plan, which will expand on the existing program and establish new measures to proactively combat emerging threats to Canada’s marine safety system and impacts to the marine supply chain
- In addition to its steady on-going funding, DFO received $100 million in temporary funding for the Small Craft Harbour Program and the Ghost Gear Fund for recovery and resilience efforts following Hurricane Fiona
- Some funding initiatives such as Indigenous programs are progressing and moving from peak funding to steadier states. Examples include advancing reconciliation on Indigenous rights issues and implementation of BC agreements
- Budget 2023 announcement to realign government spending will also have an impact on overall authority levels as budget reductions will be implemented across the organization
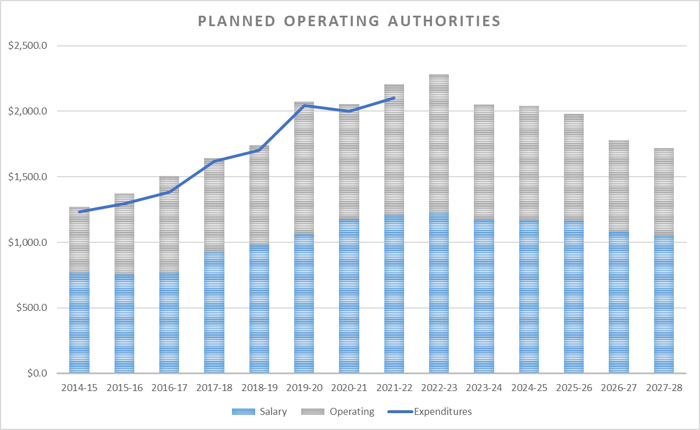
Vote 1 – Planned operating
Planned operating authorities
Text version: Planned operating authorities
| - | 2014-15 | 2015-16 | 2016-17 | 2017-18 | 2018-19 | 2019-20 | 2020-21 | 2021-22 | 2022-23 | 2023-24 | 2024-25 | 2025-26 | 2026-27 | 2027-28 |
|---|---|---|---|---|---|---|---|---|---|---|---|---|---|---|
| Salary | $768.9M | $757.3M | $770.4M | $923.2M | $982.0M | $1,060.5M | $1,176.7M | $1,214.6M | $1,226.6M | $1,171.9M | $1,167.7M | $1,162.1M | $1,077.8M | $1,047.9M |
| Operating | $500.4M | $617.2M | $737.1M | $721.0M | $760.1M | $1,012.3M | $878.7M | $992.1M | $1,054.6M | $879.1M | $873.6M | $818.7M | $704.2M | $672.5M |
| Total authorities | $1,269.4M | $1,374.5M | $1,507.6M | $1,644.2M | $1,742.1M | $2,072.8M | $2,055.4M | $2,206.7M | $2,281.2M | $2,051.0M | $2,041.3M | $1,980.8M | $1,782.1M | $1,720.4M |
| Expenditures | $1,234.3M | $1,294.2M | $1,383.0M | $1,617.6M | $1,704.2M | $2,044.0M | $2,001.9M | $2,100.7M | - | - | - | - | - | - |
Does not reflect potential future renewal of sunsetters or funding related to Budget 2023 announcements
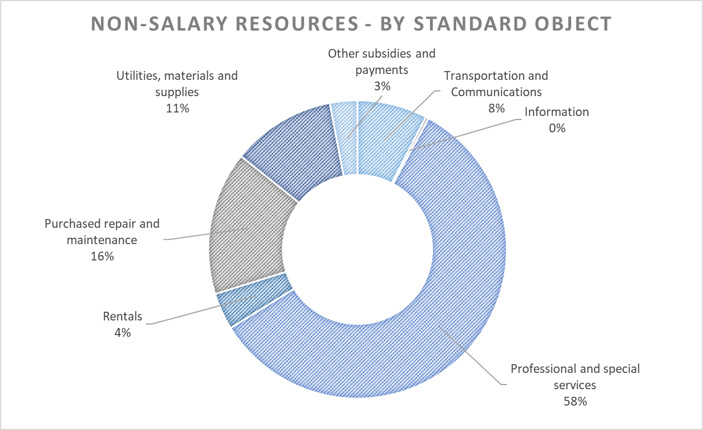
Non-salary resources – by standard object
Text version: Non-salary resources – by standard object
Figure 2: Non-salary resources – By standard object
- Transportation and communications: 8%
- Information: 0%
- Professional and special services: 58%
- Rentals: 4%
- Purchased repair and maintenance: 16%
- Utilities, materials and supplies: 11%
- Other subsidies and payments: 3%
- Total planned Operating authorities for 2023-24 are $2,011.0 million, as voted through the Main Estimates
- Salary makes up approximately 52 per cent of operating spending – approximately 14,000 FTEs are planned for 2023-24, across Canada
- With shifting funding profiles, sunsetting programs and fluctuations to the department’s overall complement of FTEs over the next few years, HR planning is critical to manage the Department’s ability to deliver its programs and mandate
- Directly supporting DFO’s significant asset base (one of the largest asset bases in the Government), in 2023-24, close to 58 per cent of non-salary spending will be on professional or special services and about 16 per cent on repairs and maintenance
Vote 5 – Planned capital
Planned capital authorities
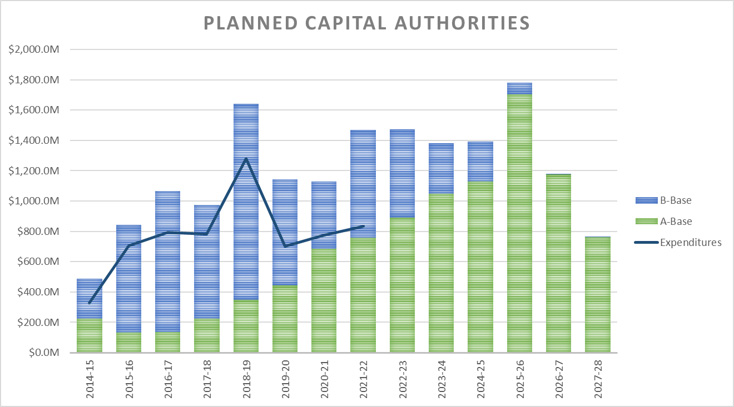
Text version: Planned capital authorities
| - | 2014-15 | 2015-16 | 2016-17 | 2017-18 | 2018-19 | 2019-20 | 2020-21 | 2021-22 | 2022-23 | 2023-24 | 2024-25 | 2025-26 | 2026-27 | 2027-28 |
|---|---|---|---|---|---|---|---|---|---|---|---|---|---|---|
| A-Base | $222.2M | $132.6M | $136.4M | $225.4M | $347.4M | $444.4M | $685.4M | $756.8M | $888.8M | $1,046.1M | $1,128.1M | $1,704.8M | $1,176.3M | $763.0M |
| B-Base | $264.2M | $710.4M | $928.5M | $747.4M | $1,293.9M | $696.9M | $444.4M | $710.4M | $582.9M | $335.5M | $264.5M | $76.0M | $2.9M | $2.1M |
| Total | $486.4M | $843.0M | $1,064.9M | $972.8M | $1,641.3M | $1,141.3M | $1,129.8M | $1,467.2M | $1,471.7M | $1,381.6M | $1,392.6M | $1,780.7M | $1,179.1M | $765.2M |
| Expenditures | $328.9M | $705.3M | $792.9M | $783.9M | $1,280.7M | $701.6M | $773.4M | $835.2M | - | - | - | - | - | - |
A-Base authorities refer to programs with permanent/ongoing funding, while B-Base authorities reflect temporary funding sources.
Does not reflect potential future renewal of sunsetters or funding related to Budget 2023 announcements
Resources – Capital by asset type
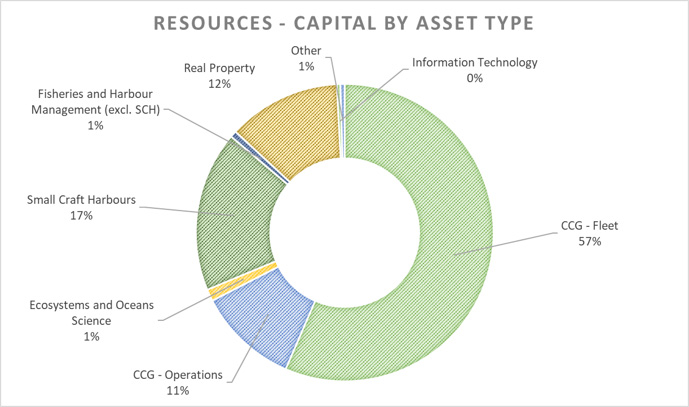
Text version: Resources – Capital by asset type
Figure 2: Resources – capital by asset type
- CCG - Fleet: 56%
- CCG - Operations: 11%
- Ecosystems and Oceans Science: 1%
- Small Craft Harbours: 17%
- Fisheries and Harbour Management (excluding SCH): 1%
- Real Property: 12%
- Information Technology: 0%
- Other: 0%
- Total planned capital authorities for 2023-24 are $1,381.6 million, as voted through the Main Estimates
- Over 97 per cent of DFO’s capital budget is for investments in the Coast Guard, small craft harbours and real property portfolio
- DFO has recently received an influx in funding to invest in the Coast Guard fleet renewal, including polar icebreaker and Arctic Offshore Patrol Vessels. Fleet renewal has been at the forefront of our priorities since 2005 and ensures the continued support to Canada’s marine safety regime
- DFO is working towards adopting accrual budgeting. This would provide predictable capital funding and ensure the proper support of the significant portfolio of assets, including small craft harbours
Vote 10 – Planned grants and contributions
Grant and contribution authorities
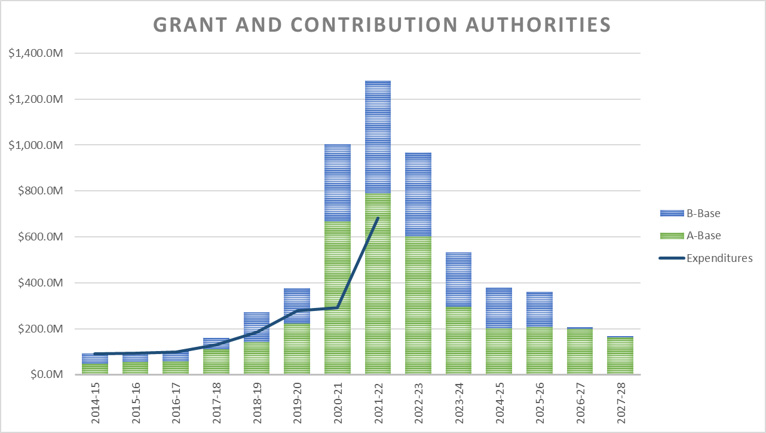
Text version: Grant and Contribution Authorities
| - | 2014-15 | 2015-16 | 2016-17 | 2017-18 | 2018-19 | 2019-20 | 2020-21 | 2021-22 | 2022-23 | 2023-24 | 2024-25 | 2025-26 | 2026-27 | 2027-28 |
|---|---|---|---|---|---|---|---|---|---|---|---|---|---|---|
| A-Base | $48.5M | $54.7M | $58.7M | $111.3M | $140.7M | $222.5M | $667.7M | $790.4M | $601.8M | $295.9M | $200.9M | $206.1M | $199.4M | $162.5M |
| B-Base | $43.0M | $42.2M | $43.3M | $48.4M | $132.2M | $152.3M | $337.1M | $490.4M | $365.6M | $236.5M | $176.8M | $153.7M | $7.5M | $5.3M |
| Total | $91.5M | $96.9M | $102.0M | $159.7M | $272.9M | $374.9M | $1,004.8M | $1,280.8M | $967.4M | $532.4M | $377.7M | $359.8M | $206.9M | $167.8M |
| Expenditures | $89.7M | $94.3M | $99.6M | $128.9M | $185.4M | $279.1M | $291.9M | $681.3M | - | - | - | - | - | - |
- A-Base authorities refer to programs with permanent/ongoing funding, while B-Base authorities reflect temporary funding sources
- Does not reflect potential future renewal of sunsetters or funding related to Budget 2023 announcements
- Total planned Grant and Contribution authorities for 2023-24 are $532.4 million as voted through the Main Estimates
- Authorities increased significantly from 2019-20 to 2021-22, largely due to funding for Reconciliation Agreements. This funding starts returning to a steadier state as larger planned payments related to access, vessels and gear will be made within the scope of the initiative
- Temporary funding sources make up a large portion of the overall authorities. Notable programs funded in this way include the Nature Legacy, Marine Conservation Targets, Pacific Salmon Strategy Initiative, and Fish Funds
- Based on our 2023-24 Main Estimates, the Department has 20 Transfer Payment Programs – with the largest recipients consisting of Indigenous organizations, fish funds and aquatic species and aquatic habitat
- Date modified: