
Tutorial: Build Report
To find widgets in the atlas, see the user guide.
The Build Report widget allows users to share their work. You can capture all of the data you have selected with descriptions in a document. The Build Report widget generates a list of layers and different features associated with those layers in a search area. This can be useful for data discovery and reporting.
Steps
- Add the data layers that you want to show and share in the atlas (see the Add Data tutorial).

- You can search for a location using the Search box (see the Search and Swipe tutorial), create a drawing or use coordinates to select a location for which to build your report. In this example, we used a point drawing and placed the point in The Strait of Juan de Fuca. To do so, open up the Build Report widget and select Drawing. Then select point, which is the first draw mode option.
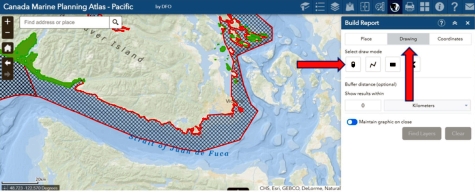
- To select layers within a certain distance of your chosen location, you can create a circular buffer around your chosen point with a user-selected radius, or buffer distance. We chose 75 kilometers as a buffer distance. We also moved the toggle button at the bottom of the window to the left to turn off the Maintain graphic on close option. This way, when we move to another widget, the point and buffer disappear. If you would like to turn them back on, you can slide the button to the right.
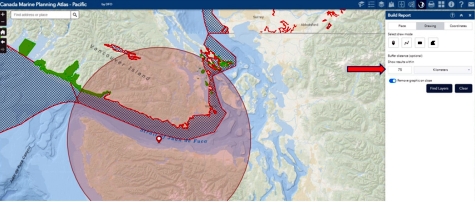
- Then we clicked the Find Layers button. Here, all the layers currently loaded in the atlas will be shown. The number in brackets next to each layer name displays the number of features found in your search area. The layers currently visible in the atlas will be checked automatically for inclusion in the report.
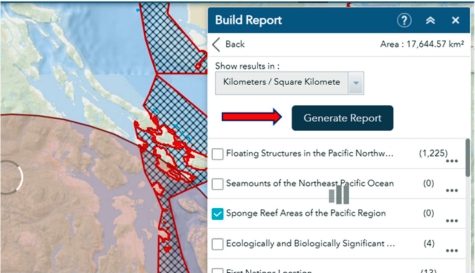
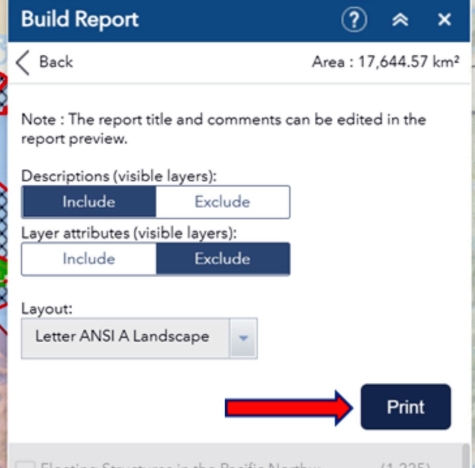
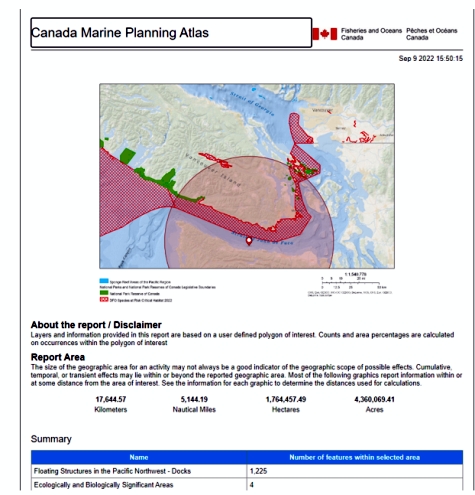
- Next, we clicked the Generate Report button and the Print button. A separate tab will automatically appear in your internet browser. A report will load with all the features and polygons that we decided to summarize for the study area. It may take a few minutes to load all of the data. Once it is complete, you will see a report automatically appear in a new browser tab.
- Review and share your report.
- Date modified: