
User guide: Canadian aquatic species at risk map
This map provides an overview of critical habitat and distribution for aquatic species listed under the Species at Risk Act (SARA). The map does not offer a view of the entire earth. It is focused on Canada.
Tips for interacting with the map:
- Zoom in and out using the zoom buttons and drag the map to reposition it
- As you zoom, the map may display more or less features
- Type a place name or address in the Find address or place bar to reposition and zoom the map directly to that location
- If the critical habitat and distribution colors are hiding the map details, use the Species at risk layer transparency slider to make the colors more transparent
- Use the Find aquatic species at risk tool to access details about the critical habitat and distribution in pre-defined areas
- You can also zoom in to a scale of 10 km or less and use the drawing tools that become available in the Find aquatic species at risk tool, to select a specific area
On this page
- Navigation
- Measurement
- Search
- Species at risk layer transparency
- Coordinates
- About
- Basemap gallery
- User guide
- Find Species at Risk tool
Navigation
The Navigation icons are positioned vertically on the left side of the screen within the map.

Zoom in button |
Zooms in on the map for closer inspection of the map. Zooming in may show more topographic details. |

Zoom out button |
Zooms out on the map for a larger view of the area. Zooming out may show less topographic details. |

Home button |
The Home icon zooms the map to the default view. |
Measurement
The measurement icon looks like a ruler and is located on the left side of the screen within the map.

Measure tool |
The Measurement tool allows users to obtain the distance covered by a line or an area on the map. When clicking on the Measurement tool, a pop-up window opens and presents two measurement options: Measure a linear distance and measure an area and its perimeter. |

Measure distance tool |
To measure a linear distance, select the measure distance tool. Select a point where you want to begin. Drag the mouse to the next point where you want to end your measurement. Double click and release. A distance will appear on the map with its measurement. |

Measure area tool |
To measure an area and its perimeter, select the measure area tool. Select a point where you want to begin, continue clicking on the map to define your area to measure. Double click and release. An area and its perimeter will appear on the map with its measurements. |
Search
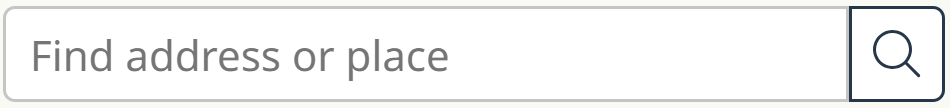
Address text box where the user can enter an address that the map will zoom to |
The Search box in the top left corner of the map allows you to type in and find locations on the map, such as an address or place. |
Species at risk layer transparency
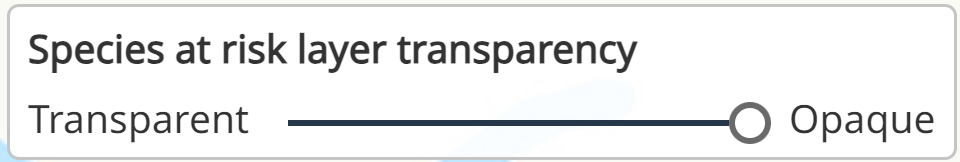
Species at risk layer transparency slider with “Transparent” on one side and “Opaque” on the other. |
The Species at risk layer transparency tool is located in the top right corner of the map. It allows you to change the transparency of the coloured Species at risk areas. Drag the cursor from opaque to transparent to change the level of transparency. |
Coordinates
The coordinates widget gives users coordinates based on the pointer’s location or by adding points. It is located in the bottom right corner of the map.
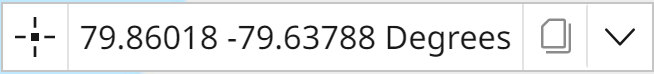
Coordinates |
Displays the coordinates in Decimal Degrees of the cursor as you move it around the map. |

Add pin |
The Add pin button allows users to click a location on a map and get coordinates. It will persist for the session and then disappear when you close the map. It will disappear when clicking again on the Add pin button. |

Copy coordinates |
The Copy coordinates allow users to copy the coordinates of the pin on the map. |

Output coordinate system |
The drop-down menu displays the coordinate system used for the map. |
About

About |
The About button provides more information about this map. It is located in the toolbar in the top right corner of your screen. |
Basemap gallery

Basemap gallery |
The Basemap gallery button looks like a square window with 4 panes and is in the toolbar in the top right corner of your screen. It presents a collection of 3 basemaps that you can select to use as the background of the map:
|
User guide

User guide (help) |
The User guide button provides information on how to use this map. It is located in the toolbar on the top right corner of your screen. |
Find Species at Risk tool
The Find aquatic species at risk tool is located in the toolbar on the top right corner of your screen. This tool allows users to identify aquatic species at risk located within a given marine area or within a searched area defined by the user. The results may be saved as a report (PDF) with links to the SARA public registry for each species identified in the searched area.
Open tool |
Opens the Find aquatic species at risk pop-up tool. Refer to the Tutorial: Find aquatic species at risk tool for detailed information on how to use the tool. |
Select area tab |
The Select area tab is open by default when selecting the Find aquatic species at risk pop-up tool. When sufficiently zoomed into the map, two options are given to the user to identify aquatic species at risk:
|
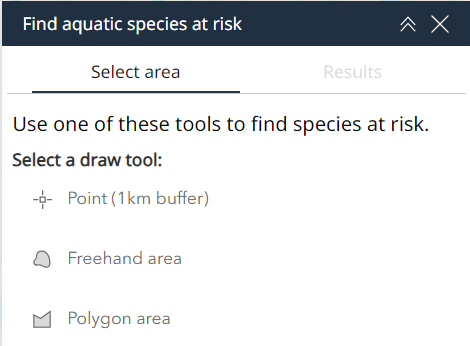
Select a draw tool |
The Select a draw tool gives the user the ability to draw a point, or an area to define where they want to identify aquatic species at risk. |
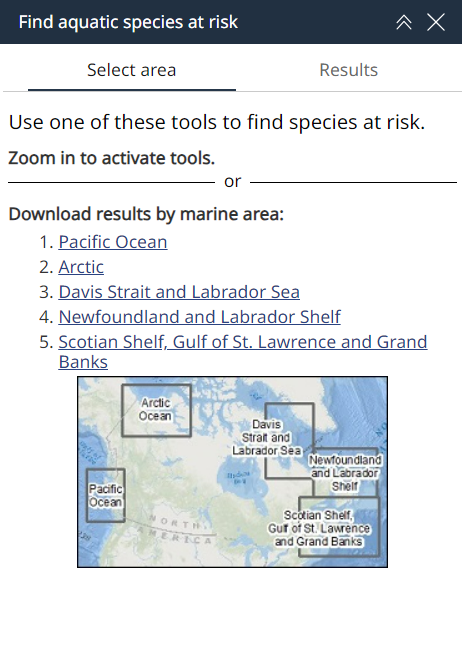
Download results by marine area |
The Download results by marine area section of the tool are links to pre-generated reports for each marine area. The report presents a map of the area, and the list of species found within it. |
Results tab |
The Results tab is greyed out by default but becomes available when select a draw tool has been used. |
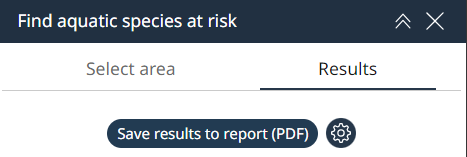
Save results to report (PDF) |
When results are generated and displayed in the results tab, the user has the option to save the report as a PDF document. The gear icon next to the Save results to report (PDF) button allows you change the title to be displayed on the PDF report. |
- Date modified: