
Commercial fisheries and aquaculture Footnote 1
3.1 Commercial marine fisheries
The commercial fishing industry on Canada's east coast underwent a period of significant change after the decline of Atlantic cod stocks in 1992. In the early 1990s, groundfish played a major role in the fish harvesting and processing sectors of Atlantic Canada, representing almost 50% of the landed quantities of fish species. Over time the dominance of groundfish decreased to a level whereby in 2008, it represented less than 15% of landed quantities. In 2008, groundfish as a whole represented just over 9% of the total landed value of marine commercial fishing in Atlantic Canada.
On the Pacific coast, the landings of salmon and, to a lesser extent, herring have declined consistently since the early 1990s. Salmon and herring landing have declined from over 45% of total quantity in 1990 to about 11% in 2008. At the same time, the landed quantity of groundfish has increased from 48% in 1990 to almost 73% in 2008. During the same period, the value of the Pacific salmon and herring fisheries dropped from 70% to almost 14%. The value of groundfish landings has increased from 18% of the total to 41% in 2008.
Shellfish on both coasts have replaced other species as the main species harvested and, due to their relatively high value, Canada's total landed value has remained steady despite declining overall landings. In 2008, shellfish represented close to 78% of the total landed value in Canada. In terms of volume landed, shellfish represented 47% of the total volume of landings in 2008.
The most important crustaceans harvested in Canada are shrimp, snow crab and lobster. Together, these species represented about 66% of the total landed value for marine species in Canada in 2008.
In 2008, the landed value of snow crab saw a sharp increase of 66% from 2006, up from a total of $215 million. This represents an increase in value to $357 million compared to the $215 million in 2006. The primary reasons for this increase were both increased snow crab prices and volume of landings during the 2008 fishing season. This price increase was significant, as in 2006 the average price of snow crab was $2.40/kg, while in 2008 it had increased by 58% to $3.80/kg.
Figure 3.1: Total landed value, main commercial marine species, Canada, 2006-2008
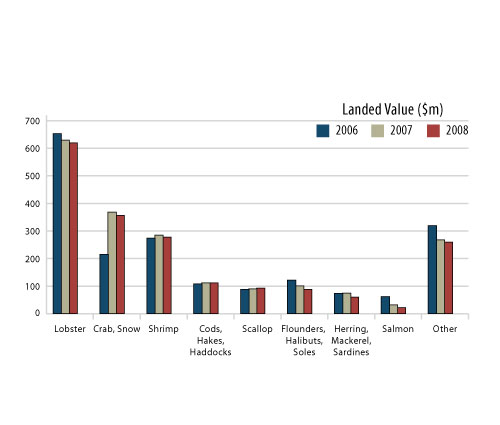
Source: DFO, Economic Analysis and Statistics.
In 2008, lobster harvests continued to outperform snow crab despite the substantial decrease in the average landed price for lobster by 11.5% to $10.50/kg from 2006. In 2008, the total volume of lobster landings increased by almost 21% over 2007 (+$10 million) and the total value amounted to nearly $619 million in 2008, about $9.6 million less than in 2007.
The landed quantities of scallop have continued to increase and, by 2008, they had increased to over 67,600 tonnes. In 2006, the total Canadian landings of scallop were just over 63,400 tonnes before, increasing modestly by just over 3% to 65,300 tonnes in 2007, followed by yet another increase of 3.5% in 2008. Scallop prices have remained stable between 2006 and 2008. The total landed value of scallops increased to almost $93 million in 2008, a gain of $3.3 million compared to 2007.
Between 2007 and 2008, most other commercial marine species in Canada have seen only modest increases in landed value. This includes American eels (+$4.6 million), Bluefin tuna (+$4.2 million), sea scallops (+$3.9 million) and yellowtail flounder (+$3.8 million). In 2008, noticeable reductions in landed value were experienced in some fisheries such as Greenland halibut (-$8.1 million), Pacific halibut (-$7.2 million) and Atlantic herring (-$5.9 million).
Details of the landed volume, value and average price variations for the main marine species landed in Canada between 2006 and 2008 are presented in Appendix II, Tables 6.1 to 6.3. An overview of the main fishing fleets in Canada in 2008 is presented in Appendix I, Tables 5.1 to 5.6. For 2007 tables, see Appendix I, Tables 5.1.1 to 5.1.6 on the CD-ROM.
3.1.1 Provinces
Marine commercial fishing occurs in six of the ten Canadian provinces and three territories. Nova Scotia, Newfoundland and Labrador and British Columbia are the three provinces where fishing has the greatest value, followed by New Brunswick, Prince Edward Island and Quebec. British Columbia and New Brunswick also enjoy a major aquaculture production.
In 2008, 27% (255 thousand tonnes) of the total volume of commercial marine fisheries in Canada was landed in Nova Scotia, for a total of $677 million, or 36% of the total Canadian landed value. The key species were lobster (54%), scallops (13%) and Queen crab (10%) as well as cod, hake and halibut, which accounted for 8% of the landed value. Landings in 2007 were somewhat lower than in 2008, when total landings in Nova Scotia were 262,611 tonnes with a value of $658 million or 34% of the total landed value in Canada.
Figure 3.2: Total landed value, commercial marine fisheries, by province, Canada, 2006-2008
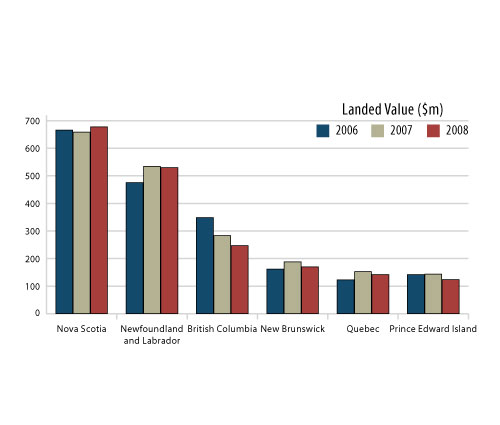
Source: DFO, Economic Analysis and Statistics.
The total landed volume in Newfoundland and Labrador in 2008 fell slightly from that of the previous year. The total landed volume in the province fell to just under 338 thousand tonnes in 2008, a decrease of 5% from 2007. However, while the value of landings decreased for lobster, seals and pelagic species, these were offset by increased landed value for shrimp, other crustaceans and crab, resulting in a decrease of less than 1% in total value to $530 million in 2008. Newfoundland and Labrador's share of the total landings in Canada has increased modestly from 25% of the total landed value in Canada in 2006, to 27% in 2007 and up to 28% in 2008. Key species by value in 2008 were shrimp (35%) and crab (34%).
British Columbia ranked third in terms of landings, as it contributed 13% of the total fishing value in Canada in 2008, for a total of $247 million. The total landed volume in British Columbia decreased from 2007 by 11% to 150 thousand tonnes in 2008. Based on landed value, the key species harvested were crab (15%), flounder, halibut and sole (14%), and clam, cockles and arkshells at 13%.
New Brunswick and Quebec were in fourth and fifth places respectively. In 2008, the landed value in New Brunswick was $170 million, with Quebec at $142 million. Landings in these two provinces represent 16.5% of the total landed value in Canada. Landings in New Brunswick fell by 9.5% in value between 2007 and 2008, largely due to declines in the landed value of crab and herring (an overall decline of 19%). Landed values declined slightly in Quebec in 2008, falling 7% from $153 million in 2007 to $142 million.
Prince Edward Island was in sixth place with respect to the value of marine commercial fishing in Canada. In 2008, 6.6% or $124 million of the total value of catches in Canadian waters was landed in this province.
3.1.2 NAFO areas, Atlantic Canada
Between 2006 and 2008, the southern part of the Gulf of St. Lawrence was the most lucrative NAFO fishing area in terms of the landed value in Canada. The presence of large stocks of lobster and snow crab partly explains the high value of fishing in this area. The southern Scotian shelf and the north-eastern part of Newfoundland also were highly productive areas during this period, contributing 44% of the total landed value of marine species on the Canadian Atlantic coast. In 2008, these three areas combined represented 62% of the total landed volume and 69% of the total landed value in Atlantic Canada.
| Groups | NAFO Areas | Landed Value ($m) | |||
|---|---|---|---|---|---|
| 2006 | 2007 | 2008 | % of total (2008) | ||
| Southern Gulf of St. Lawrence | 4T, 4VN | 419 | 472 | 417 | 25% |
| Southern Scotian Shelf | 4X, 5Y, 6D, 6E | 416 | 368 | 376 | 23% |
| North-Eastern Newfoundland | 2J, 3K, 3L | 273 | 333 | 343 | 21% |
| Northern Scotian Shelf | 4W, 4VS | 109 | 137 | 147 | 9% |
| Northern Gulf of St. Lawrence | 4R, 4S, 3PN | 102 | 117 | 114 | 7% |
| Georges Bank | 5Ze | 73 | 74 | 92 | 6% |
| Southern Newfoundland | 3PS, 3MNO | 84 | 84 | 82 | 5% |
| Northern Labrador and Baffin Island | 2G, 2H, 0A, 0B, 1B | 90 | 88 | 64 | 4% |
| Other | - | 1 | 3 | 8 | 1% |
| Total | 1,567 | 1,676 | 1,642 | 100% | |
Source: DFO, Economic Analysis and Statistics.
3.1.3 Months of activity in Atlantic Canada
On the Atlantic coast of Canada, most fish landings took place between April and September, representing 75% of all landings in 2008. However, it was in May and June that landings had the greatest value, principally due to lobster, shrimp and scallop catches. In 2008, landings during these two months had a value of approximately $728 million, which was 44% of the total landed value on the Atlantic coast.
In general, the volume of fish landed between October and March is relatively lower in New Brunswick, Prince Edward Island and Quebec. In Newfoundland and Labrador, higher fish landings occur from April through October, with higher values during the months of May to July. The volume of landings in Nova Scotia are high from May through October, with only small variations compared to other provinces, while landed value is seen to be somewhat higher from November to January, compared to the volume of landings in these months.
| Months | Landed Value ($m) | |||||
|---|---|---|---|---|---|---|
| NS | NB | PEI | Que | NFL | Total | |
| January | 46 | 3 | 0 | 6 | 15 | 70 |
| February | 31 | 2 | 0 | 0 | 11 | 44 |
| March | 35 | 2 | 0 | 0 | 21 | 57 |
| April | 48 | 2 | 0 | 14 | 44 | 108 |
| May | 125 | 53 | 58 | 60 | 112 | 407 |
| June | 86 | 49 | 39 | 34 | 113 | 320 |
| July | 70 | 9 | 3 | 12 | 82 | 176 |
| August | 44 | 17 | 10 | 7 | 44 | 122 |
| September | 34 | 11 | 9 | 5 | 36 | 95 |
| October | 30 | 4 | 5 | 2 | 26 | 67 |
| November | 47 | 13 | 1 | 1 | 13 | 75 |
| December | 82 | 5 | 0 | 0 | 14 | 101 |
| Total | 677 | 170 | 124 | 142 | 530 | 1,642 |
Source: DFO, Economic Analysis and Statistics.
3.1.4 Fishing gear
In 2008, nearly 56% of the marine fishing value in Canada came from species that were caught using pots and traps, such as crab and lobster. In terms of volume, trawling contributed 35% to the total commerical catch in Canada. This, however, resulted in only 20% of the total value. The lower value results from typically lower market prices for trawled species, such as groundfish and shrimp, than trapped species.
Figure 3.3: Total landed value by fishing gear type, commercial marine fisheries, Canada, 2008

Source: DFO, Economic Analysis and Statistics.
3.1.5 Vessels
In 2008, there were 15,984 active vessels in Canada's marine commercial fisheries. A fishing vessel is considered active if at least one instance of fish landings is recorded during the year. This number has decreased slightly compared to 2007, when the number of active vessels totalled 16,683 (-4%).
The majority (91%) of these vessels were inshore fishing vessels less than 45' in length. While midshore and offshore fishing vessels (more than 45' in length) represented less than 10% of all active fishing vessels in Canada, they recorded 42% of the total Canadian landed value in 2008.
| Vessel Length | Number of Active Vessels1 | |||
|---|---|---|---|---|
| 2006 | 2007 | 2008 | % of
total (2008) |
|
| Unknown length | 10 | 10 | 11 | 0% |
| 1' - 34'11'' | 8,154 | 8,313 | 7,851 | 49% |
| 35' - 44'11'' | 7,041 | 6,916 | 6,760 | 42% |
| 45' - 64'11'' | 1,232 | 1,204 | 1,136 | 7% |
| 65' - 99'11'' | 211 | 196 | 186 | 1% |
| 100' + | 70 | 67 | 59 | 0% |
| Total2 | 16,697 | 16,683 | 15,984 | 100% |
1Vessel that reported landings in a given year.
2Due to some vessel length changes, numbers may not add to total.
Source: DFO, Economic Analysis and Statistics.
Figure 3.4: Total landed value by vessel length, commercial marine fisheries, Canada, 2008
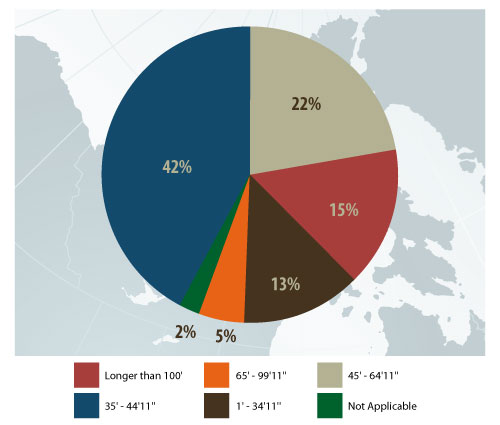
Source: DFO, Economic Analysis and Statistics.
The average landed value per active fishing vessel was $118,176 in Canada in 2008, which was less than 1% higher than the average landed value in 2007. Among the main commercial species, landings of northern shrimp (Pandalus Borealis) and sea scallops had the highest average value per vessel in 2008, reaching on average $548,193 and $185,864 respectively per vessel. The average landed values of lobster ($72,876) and Atlantic cod ($9,321) per vessel were significantly lower primarily because each of these two fleets represents a large segment of all vessels (53% and 30%, respectively).
| Major species | Number of active vessels and average value of landings per vessel1 | ||
|---|---|---|---|
| # of active vessels2 | # of active vessels as a % of total vessels | Average value of landings per vessel ($) | |
| Lobster | 8,500 | 53% | 72,876 |
| Cod, Atlantic | 4,833 | 30% | 9,321 |
| Snow Crab | 2,928 | 18% | 121,954 |
| Salmon | 2,587 | 16% | 8,326 |
| Herring | 1,082 | 7% | 28,146 |
| Greenland Halibut | 701 | 4% | 34,311 |
| Scallops, Sea | 498 | 3% | 185,864 |
| Shrimp, p. Borealis | 465 | 3% | 548,193 |
| Pacific Halibut | 236 | 1% | 119,333 |
| Dungeness Crab | 212 | 1% | 171,642 |
| Total | 15,984 | 100% | 118,176 |
1There is no direct link between the value of landings and the net income by vessel since operating costs vary from one fishery to another.
2Vessels may land more than one species (categories not mutually exclusive).
Source: DFO, Economic Analysis and Statistics.
In 2008, 40% of the total active fishing vessels in Canada landed fish in Newfoundland and Labrador (6,355 vessels). Nova Scotia was second with 3,740 vessels, about 23% of the Canadian total. Between 2007 and 2008, thenumber of active vessels in all provinces except Nova Scotia decreased. In Nova Scotia, the increase in active fishing vessels was very minor (up 2%).
| Province | Number of Active Vessels1 | |||
|---|---|---|---|---|
| 2006 | 2007 | 2008 | % of
total (2008) |
|
| Nova Scotia | 3,810 | 3,664 | 3,740 | 23% |
| New Brunswick | 1,910 | 1,933 | 1,878 | 12% |
| Prince Edward Island | 1,408 | 1,398 | 1,346 | 8% |
| Quebec | 1,264 | 1,305 | 1,269 | 8% |
| Newfoundland | 6,401 | 6,717 | 6,355 | 40% |
| British Columbia | 2,263 | 1,981 | 1,688 | 11% |
| Total2 | 16,697 | 16,683 | 15,984 | 100% |
1Vessels that reported landings, by province, in a given year.
2Due to some vessels landing in more than one province, numbers may not add to total.
Source: DFO, Economic Analysis and Statistics.
3.2 Commercial freshwater fisheries
In Canada, freshwater commercial fishing takes place primarily in Lake Huron, Lake Ontario and Lake Superior in Ontario, in lakes Winnipeg, Cedar, Manitoba and Winnipegosis in the province of Manitoba and in Great Slave Lake in the Northwest Territories. This fishing activity is relatively modest when compared to the commercial fishing of marine species. In 2008, it amounted to 3% of the commercial fishing value and 3% of the total volume in Canada.
The landed volume of freshwater species declined by 3% when compared to 2007, decreasing by 1,034 tonnes for a total of 31,063 tonnes in 2008. The lower landed value of some key species resulted in a drop in total landed value in 2008 to $59 million, $4.4 million (-7%) less than in 2007.
The main freshwater species fished commercially in Canada are yellow pickerel, whitefish and perch. Landings of these three species represented close to 82% of the total landings of freshwater species in Canada in 2008.
| Species | Landed Value ($,000) | |||
|---|---|---|---|---|
| 2006 | 2007 | 2008 | % change
2007-2008 |
|
| Yellow Pickerel | 32,534 | 30,528 | 28,643 | -6% |
| Whitefish | 9,145 | 9,423 | 10,777 | 14% |
| Perch | 18,308 | 13,958 | 9,144 | -34% |
| White Bass | 1,687 | 2,020 | 2,322 | 15% |
| Smelt | 467 | 2,273 | 1,884 | -17% |
| Pike | 965 | 1,035 | 1,605 | 55% |
| Sauger | 491 | 298 | 739 | 148% |
| Sucker (Mullet) | 764 | 580 | 710 | 22% |
| Lake Trout | 447 | 384 | 424 | 10% |
| Other | 3,167 | 3,163 | 3,031 | -4% |
| Total | 67,977 | 63,662 | 59,279 | -7% |
Source: DFO, Central and Arctic, Policy Sector.
Freshwater commercial fishing is the most important fishery in Ontario and Manitoba, with respective landed values of $27 million and $25 million in 2008. Fish landings in these two provinces represented 88% of the overall landed value of freshwater commercial fisheries in Canada in 2008.
| Province | Landed Value ($,000) | |||
|---|---|---|---|---|
| 2006 | 2007 | 2008 | % change
2007-2008 |
|
| Ontario | 36,430 | 32,188 | 27,315 | -15% |
| Manitoba | 23,818 | 23,833 | 24,745 | 4% |
| Saskatchewan | 2,843 | 2,279 | 3,039 | 33% |
| Quebec | 2,030 | 2,030 | 2,030 | 0% |
| Alberta | 1,748 | 2,454 | 1,240 | -49% |
| New Brunswick | 498 | 498 | 498 | 0% |
| Northwest Territories | 610 | 380 | 413 | 9% |
| Total | 67,977 | 63,662 | 59,279 | -7% |
Source: DFO, Central and Arctic, Policy Sector.
3.3 Aquaculture
Overall aquaculture production increased in value to $801 million in Canada in 2008, close to $40 million more than in 2007 (+5%). This higher value can be attributed to increases in the value of salmon and trout.
The aquaculture production value of mussels and oysters decreased by 19% for both species, while trout production increased by 71%. Meanwhile, the value of salmon production increased by only 3% in 2008, due to a higher production volume and higher price.
In 2008, the production value of salmon accounted for about 78% of the total aquaculture production value in Canada.
| Major species | Value of aquaculture production ($,000) | |||
|---|---|---|---|---|
| 2006 | 2007 | 2008 | % change 2007-2008 | |
| Salmon | 748,246 | 604,917 | 624,582 | 3% |
| Trout1 | 19,743 | 23,570 | 40,330 | 71% |
| Mussels | 35,817 | 33,940 | 27,322 | -19% |
| Oysters | 19,063 | 16,726 | 13,502 | -19% |
| Clams | 8,906 | 9,713 | 8,614 | -11% |
| Other | 81,208 | 72,704 | 86,923 | 20% |
| Total2, 3 | 912,983 | 761,570 | 801,273 | 5% |
1Excludes other finfish for all provinces except Quebec beginning in 2006.
2Totals include re-stocking.
3Totals exclude confidential data. Source: Statistics Canada, 2010, Aquaculture Statistics 2009, Catalogue no. 23- 222-XIE.
British Columbia continues to dominate Canadian aquaculture production, accounting for over half of Canada's total. In 2008, New Brunswick reported the second highest production, primarily from finfish. Newfoundland and Labrador, which ranked third in value of production, reported that value was primarily from finfish, although further details are unavailable due to the limited number of producers in the province. In Nova Scotia, which ranked fourth in value of production in 2008, finfish accounted for 69% of the total value of $35.6 million.
| Province | Value of aquaculture production in 2008 ($,000) | ||||
|---|---|---|---|---|---|
| Salmon | Mussels | Trout | Other | Total | |
| British Columbia | 409,267 | 1,281 | 2,816 | 14,879 | 428,243 |
| New Brunswick | 192,140 | 545 | 5,000 | 628 | 198,313 |
| Prince Edward Island | .. | 22,300 | .. | 7,300 | 29,600 |
| Newfoundland and Labrador | .. | .. | .. | .. | 63,120 |
| Nova Scotia | 23,175 | 2,430 | 1,479 | 8,562 | 35,646 |
| Ontario | 0 | 0 | 17,200 | 0 | 17,200 |
| Quebec1 | 0 | 766 | 1,574 | 7,323 | 9,663 |
| Other | 0 | 0 | 812 | 0 | 812 |
| Total Canada | 624,582 | 27,322 | 40,330 | 109,039 | 801,273 |
Note: Provinces with data not available are not included in the Canada totals.
1Quebec totals include restocking.
2 Two of the 3 provinces are confidential. Source: Statistics Canada, 2010, Aquaculture Statistics 2009, Catalogue no. 23-222-XIE.
- Date modified: