
Commercial fisheries and aquaculture Footnote 1
3.1 Commercial marine fisheries
The commercial fishing industry underwent a period of transformation after Atlantic cod stocks collapsed in 1992, and following the subsequent moratorium on this species in several areas of Atlantic Canada. In the early 1990's, groundfish (particularly Atlantic cod) played a major role in the fish harvesting and processing sectors, but over time the dominance of groundfish decreased. In 2005, groundfish as a whole represented less than 11% of the total landed value of marine commercial fishing in Canada.
Crustaceans have replaced groundfish as the main species harvested in Atlantic Canada and due to their relatively high value, the total landed value increased. In 2005, the landed value of crustaceans represented close to 66% of the total landed value in Canada. However, in terms of volume landed, groundfish dominated over crustaceans, as the latter, while accounting for the two-thirds of total Canadian landed value, represented only 30% of the total volume of landings in 2005.
Figure 3.1: Total landed value, main commercial marine species, Canada, 2003-2005
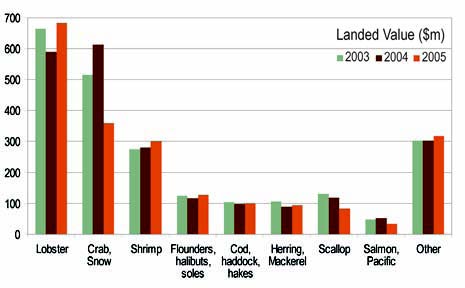
Source: DFO, Economic Analysis and Statistics.
The most important crustaceans are lobster, snow crab and shrimp. Together, these species represented about 65% of the total landed value for marine species in Canada between 2003 and 2005. The landed value of snow crab saw a sharp decrease of 41% in 2005, down to a total of $359m. This represents a loss of $254m compared to the record value of $613m reached in 2004. The main cause of this decline was the decreasing snow crab price that began at the end of the 2004 fishing season, a result of a substitution effect in the American market in response to the peak prices of the 2004 season. This price decrease has been drastic as in 2004 the average price of snow crab was $5.93/kg, while in 2005 it decreased to $3.76/kg.
In 2005, lobster outperformed snow crab. The average landed price for lobster increased by 9% to reach $13.52/kg during that year. Since the total volume of lobster landings also increased, the total value of this species amounted to nearly $700m in 2005, about $100m more than in 2004.
The landed volume of scallop continued to decrease in 2005. In 2003, the total Canadian landings of scallop reached 94,000 tonnes. In 2005, the total landings decreased by almost 40% to 57,000 tonnes. As scallop prices have remained relatively unchanged between 2003 and 2005, the total landed value of scallops has dropped to $82m in 2005, a decrease of $49m compared to 2003.
Between 2004 and 2005, other commercial marine species in Canada have seen major increases in landed value. This includes shrimp Footnote 2 (+$20m), Pacific halibut (+$11m), sablefish (+$10m), mackerel (+$8m) and haddock (+$7m). In 2005, noticeable reductions in landed value took place in some fisheries such as Pacific Dungeness crab (-$19m), Pacific salmons (-$19m) and Pacific herring (-$8m).
Details of the landed volume, value and price evolution for the main marine species landed in Canada between 2003 and 2005 are presented in Appendix II, Tables 6.1 to 6.3. An overview of the main fishing fleets in Canada is also presented in Appendix I, Tables 5.1 to 5.6.
3.1.1 Provinces
Marine commercial fishing is concentrated in six of the thirteen Canadian provinces and territories. Nova Scotia, Newfoundland and Labrador and British Columbia are the three provinces where fishing has the greatest value, followed by New Brunswick, Quebec and Prince Edward Island. British Columbia and New Brunswick also enjoy a major aquaculture production.
In 2005, 26% (291,000 t) of the total volume of marine fisheries in Canada was landed in Nova Scotia, for a total of $742m, or 35% of the total Canadian landed value. This level is similar to that of 2004, when total landings in Nova Scotia attained 332,000 t for a value of $744m or 33% of the total landed value in Canada.
Figure 3.2: Total landed value, marine fisheries, by province, Canada, 2003-2005
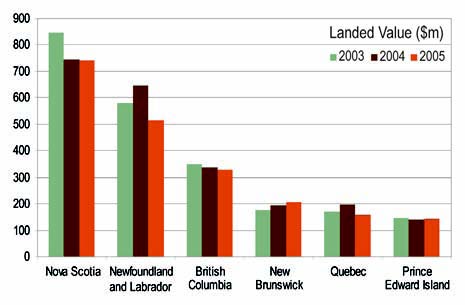
Source: DFO, Economic Analysis and Statistics.
As is the case in Nova Scotia, the total landed volume in Newfoundland and Labrador has remained stable. The total landed volume in this province has reached 357,000 t in 2005, similar to 2004. However, given the decline in the price of snow crab, the total value has fallen to $515m, which represents a 20% decrease compared to 2004. Newfoundland and Labrador's share in the total landings in Canada decreased consequently by 4% during that same period, from 29% of the total landed value in Canada in 2004 to 25% in 2005.
British Columbia ranked third in terms of landings, as it contributed 16% of the total fishing value in Canada in 2005, for a total of $329m (231,000 t). The total landed volume in British Columbia increased by 17% in 2005 over 2004, but due to the low price of important species such as Dungeness crab, salmon and Pacific herring in 2005, the total value of these landings was slightly less than in 2004.
New Brunswick and Quebec are in fourth and fifth places respectively. In 2005, the landed value in New Brunswick was $208m, with Quebec at $160m. Landings in these two provinces represent 16% of the total landed value in Canada. However, Quebec has suffered a sharp decrease of 20% in the value of its landings between 2004 and 2005 while in New Brunswick, this value has increased by 7% during that same period.
Prince Edward Island is in sixth place regarding the volume and value of fishing in Canada. In 2005, 7% or $144m of the total value of catches in Canadian waters was landed in Prince Edward Island.
3.1.2 NAFO areas, Atlantic Canada
Between 2003 and 2005, the southern part of the Gulf of St. Lawrence was the most important NAFO fishing area in terms of landed value in Canada. The presence of large stocks of lobster and snow crab partly explains the high value of fishing in this area. The northeastern part of Newfoundland and the southern Scotian shelf have also been highly productive areas during this period, contributing over half of the total landed value of marine species on the Canadian Atlantic coast. In 2004 and 2005, these three areas combined represented 65% of the total landed volume and 76% of the total landed value in Atlantic Canada.
| Groups | NAFO Areas | Landed Value ($m) | |||
|---|---|---|---|---|---|
| 2003 | 2004 | 2005 | % of Total (2005) | ||
| Southern Gulf of St. Lawrence | 4T, 4VN | 509 | 549 | 513 | 29% |
| Southern Scotian Shelf | 4X, 5Y, 6D, 6E | 489 | 440 | 469 | 27% |
| North-Eastern Newfoundland | 2J, 3K, 3L | 360 | 408 | 314 | 18% |
| Southern Newfoundland | 3Ps, 3MNO | 137 | 130 | 107 | 6% |
| Northern Scotian Shelf | 4W, 4VS | 128 | 123 | 106 | 6% |
| Northern Gulf of St. Lawrence | 4R, 4S, 3Pn | 98 | 109 | 100 | 6% |
| Northern Labrador and Baffin Island | 2G, 2H, 0A, 0B, 1B | 96 | 96 | 92 | 5% |
| Georges Bank | 5Ze | 94 | 62 | 59 | 3% |
| Other | - | 11 | 11 | 9 | 0% |
| Total | 1,921 | 1,928 | 1,768 | 100% | |
Source: DFO, Economic Analysis and Statistics.
3.1.3 Months of activity in Atlantic Canada
On the Atlantic coast of Canada, most landings took place between May and October (78% of landings in 2005). However, it is in May and June that landings had the greatest value. In 2005, landings during these two months have reached a value of approximately $775m, which is slightly less than half the total landed value of that year on the Canadian Atlantic coast.
In general, the volume of fish landed between October and March is low in New Brunswick, Prince Edward Island and Quebec. In Newfoundland and Labrador, fish landings are spread over the whole year, with a higher value during the months of May to July. The volume of landings is high throughout the year in Nova Scotia, while their value is higher between the months of May and July and in December.
| Months | Landed Value ($m) | |||||
|---|---|---|---|---|---|---|
| NS | NB | PEI | Que | NFL | Total | |
| January | 42 | 2 | 0 | 6 | 16 | 66 |
| February | 29 | 2 | 0 | 0 | 16 | 48 |
| March | 29 | 2 | 0 | 0 | 19 | 51 |
| April | 52 | 2 | 0 | 14 | 34 | 102 |
| May | 135 | 72 | 62 | 64 | 78 | 410 |
| June | 92 | 58 | 50 | 49 | 116 | 364 |
| July | 62 | 6 | 3 | 15 | 90 | 175 |
| August | 53 | 19 | 13 | 5 | 47 | 138 |
| September | 36 | 13 | 11 | 3 | 27 | 89 |
| October | 32 | 5 | 4 | 2 | 32 | 75 |
| November | 43 | 18 | 1 | 1 | 24 | 86 |
| December | 139 | 7 | 0 | 0 | 17 | 164 |
| Total | 742 | 208 | 144 | 159 | 515 | 1,768 |
Source: DFO, Economic Analysis and Statistics.
3.1.4 Fishing gear
In 2005, nearly 54% of the marine fishing value in Canada came from species that were caught using traps, such as snow crab and lobster. In terms of value, trawling contributed to 19% of total catches in Canada, but 35% in terms of volume, since the market price of trawled species, such as groundfish and shrimp, are typically less than that of species caught using a trap, such a crab and lobster.
Figure 3.3: Total landed value by fishing gear type, marine fisheries, Canada, 2005
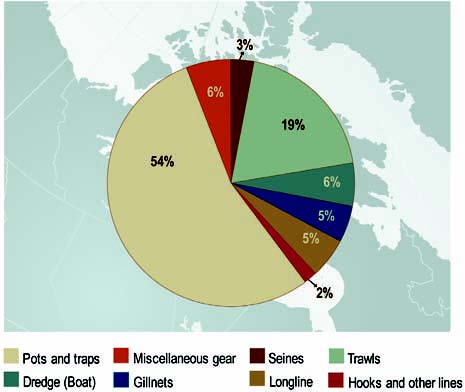
Source: DFO, Economic Analysis and Statistics.
3.1.5 Vessels
In 2005, there were 16,547 "active" vessels in Canada. A fishing vessel is considered active if at least one instance of fish landings is recorded during the year. This number has decreased slightly compared to 2004, when the number of active vessels amounted to 16,590. The great majority (90%) of these vessels are inshore fishing vessels less than 45' in length. However, while midshore and offshore fishing vessels (more than 45' in length) represented less than 12% of all active fishing vessels in Canada, they registered more than 46% of the total Canadian landed value in 2005.
| Vessel length | Number of active vessels1 | |||
|---|---|---|---|---|
| 2003 | 2004 | 2005 | % of
total (2005) |
|
| 1' - 34'11'' | 7,729 | 8,046 | 7,946 | 48% |
| 35' - 44'11'' | 6,856 | 7,064 | 6,771 | 41% |
| 45' - 64'11'' | 1,482 | 1,324 | 1,573 | 10% |
| 65' - 99'11'' | 210 | 215 | 214 | 1% |
| Longer than 100' | 92 | 83 | 78 | 0% |
| Total | 16,242 | 16,590 | 16,547 | 100% |
1Vessel for which at least one landing is registered in a given year.
Source: DFO, Economic Analysis and Statistics.
Figure 3.4: Total landed value by boat length, marine fisheries, Canada, 2005
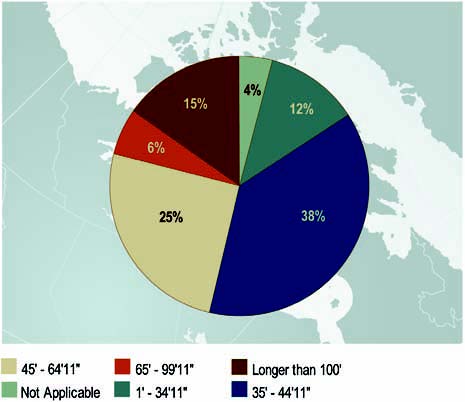
Source: DFO, Economic Analysis and Statistics.
The average landed value per fishing vessel was $104,114 in Canada in 2005, 24% less than the average landed value in 2004. Among the main commercial species, landings of northern shrimp (Pandalus Borealis) and Pacific halibut had the highest value in 2005, reaching on average $544,000 and $179,000 respectively per vessel. The average landed value of lobster and Atlantic cod per vessel was much lower, although the total fleet was very large (13,000 vessels).
| Major species | Number of vessels and average value per vessel in 20051 | ||
|---|---|---|---|
| # of vessels | # active vessels as a % of total vessels | Average value of landings per vessel ($)3 | |
| Crab, Snow (Queen) | 3,274 | 20% | 109,534 |
| Lobster | 8,835 | 53% | 77,418 |
| Shrimp, Pandalus Borealis2 | 463 | 3% | 544,040 |
| Scallop, Sea | 672 | 4% | 51,420 |
| Crab, Dungeness | 231 | 1% | 121,152 |
| Pacific halibut | 271 | 2% | 178,797 |
| Greenland halibut | 867 | 5% | 46,123 |
| Herring, Pacific | 117 | 1% | 239,316 |
| Herring | 1,784 | 11% | 21,839 |
| Cod, Atlantic | 4,735 | 29% | 7,184 |
| Total | 16,547 | 100% | 104,114 |
1There is no direct link between the value of landings and the net income by vessel since operating costs vary from one fishery to another.
2Calculated by dividing the total landed value for each species listed by the number of vessels which registered at least one landing of that species. Note that some vessels may have landed more than one of the species listed in the table and hence, the categories presented are not mutually exlcusive.
3This species represented more than 90% of the total value of shrimp landings in Canada in 2005.
Source: DFO, Economic Analysis and Statistics.
In 2005, 39% of the total active fishing vessels in Canada landed fish in Newfoundland and Labrador (6,380 vessels). Nova Scotia came second with 3,982 vessels, about 24% of the Canadian total. Since 2004, the number of active vessels in New Brunswick and British Columbia has decreased, while it increased in the four other fishing provinces.
| Province | Number of active vessels1 | |||
|---|---|---|---|---|
| 2003 | 2004 | 2005 | % of
total 2005 |
|
| Nova Scotia | 3,911 | 3,911 | 3,982 | 24% |
| New Brunswick | 1,943 | 1,958 | 1,934 | 12% |
| Prince Edward Island | 1,358 | 1,416 | 1,418 | 9% |
| Quebec | 1,182 | 1,236 | 1,252 | 8% |
| Newfoundland | 5,949 | 6,226 | 6,380 | 39% |
| British Columbia | 2,442 | 2,403 | 2,164 | 13% |
| Total2 | 16,242 | 16,590 | 16,547 | 100% |
1Vessels for which at least one landing is registered in a given year.
2The sum of rows may differ from the total as some vessels land in more than one province. Those vessels are counted only once in the Canadian total.
Source: DFO, Economic Analysis and Statistics.
3.2 Commercial freshwater fisheries
In Canada, freshwater commercial fishing primarily takes place in Lakes Winnipeg, Cedar, Manitoba, Winnipegosis and Great Slave. This fishing activity is relatively modest when compared to the commercial fishing of marine species. In 2005, it amounted to only 3% of the commercial fishing value in Canada.
The landed volume of freshwater species has decreased by 4,000 tonnes (-11%) in 2005 compared to the previous year, for a total of 32,000 tonnes. However, the increased price of some species has resulted in a total landed value of $66m, $2.2m (4%) more than in 2004.
The main freshwater species fished commercially in Canada are pickerel, perch and whitefish. Landings of these three species represented close to 84% of total landings of freshwater species in Canada in 2005.
| Species | Value of landings ($,000) | |||
|---|---|---|---|---|
| 2003 | 2004 | 2005 | % change
2004-2005 |
|
| Pickerel | 29,059 | 26,130 | 31,521 | 21% |
| Perch | 14,443 | 13,429 | 14,973 | 11% |
| Whitefish | 12,877 | 10,790 | 8,786 | -19% |
| White bass | 2,666 | 2,562 | 2,316 | -10% |
| Smelt | 1,785 | 3,121 | 1,678 | -46% |
| Sauger | 2,580 | 1,866 | 1,018 | -45% |
| Pike | 1,589 | 1,203 | 855 | -29% |
| Sucker (mullet) | 1,205 | 756 | 793 | 5% |
| Lake trout | 620 | 586 | 486 | -17% |
| Other | 4,680 | 3,351 | 3,609 | 8% |
| Total | 71,504 | 63,794 | 66,035 | 4% |
Source: DFO, Central and Arctic, Policy Sector.
Freshwater commercial fishing is the most important in Ontario and Manitoba, with respective landed values of $35m and $23m in 2005. In 2005, fish landings in these two provinces represented 88% of the overall landed value of freshwater commercial species in Canada.
| Provinces | Value of landings ($,000) | |||
|---|---|---|---|---|
| 2003 | 2004 | 2005 | % change
2004-2005 |
|
| Ontario | 31,782 | 29,513 | 35,133 | 19% |
| Manitoba | 27,245 | 24,655 | 22,683 | -8% |
| Saskatchewan | 4,346 | 2,985 | 2,830 | -5% |
| Quebec | 2,930 | 2,977 | 2,134 | -28% |
| Alberta | 3,034 | 2,249 | 2,032 | -10% |
| Northwest Territories | 1,231 | 1,009 | 817 | -19% |
| New Brunswick | 936 | 406 | 406 | 0% |
| Total | 71,504 | 63,794 | 66,035 | 4% |
Source: DFO, Central and Arctic, Policy Sector.
3.3 Aquaculture
Overall aquaculture production has reached a total value of $715m in Canada in 2005, close to $190m more than in 2004 (+36%). This high value can be attributed to a marked increase in the price of salmon, which rose from $4.00/kg in 2004 to $5.52/kg in 2005.
The aquaculture production value of mussels and oysters has remained relatively stable between 2004 and 2005, while that of trout production has decreased by 5%. Meanwhile, the value of clam production has increased nearly by 20% in 2005, due to a higher production volume.
| Major species | Value of aquaculture production ($,000) | |||
|---|---|---|---|---|
| 2003 | 2004 | 2005 | % change
2004-2005 |
|
| Salmon | 441,471 | 387,038 | 543,634 | 40% |
| Mussels | 30,929 | 32,761 | 33,168 | 1% |
| Trout | 25,714 | 22,086 | 21,070 | -5% |
| Oysters | 19,208 | 16,207 | 16,095 | -1% |
| Clams | 7,903 | 7,052 | 8,378 | 19% |
| Other | 65,759 | 61,418 | 92,762 | 51% |
| Total | 590,984 | 526,562 | 715,107 | 36% |
Source: Statistics Canada, 2006, Aquaculture Statistics 2005, Catalogue no. 23-222-XIE.
*Totals exclude confidential data.
British Columbia and New Brunswick dominate Canadian aquaculture production, particularly in salmon, which is concentrated in these two provinces. In 2005, the production value of salmon exceeded 75% of the total aquaculture production value in Canada.
| Provinces | Value of aquaculture production in 2005 ($,000) | ||||
|---|---|---|---|---|---|
| Salmon | Mussels | Trout | Other | Total | |
| British Columbia | 318,634 | 278 | 673 | 17,325 | 336,910 |
| New Brunswick | 225,000 | 550 | 3,000 | 1,950 | 230,500 |
| Prince Edward Island | x | 21,400 | x | 7,400 | 28,800 |
| Newfoundland and Labrador | x | 6,900 | 0 | 26,600 | 33,500 |
| Nova Scotia | x | 3,060 | 0 | 37,358 | 40,418 |
| Ontario | 0 | 0 | 15,500 | 0 | 15,500 |
| Quebec | 0 | 980 | 1,854 | 9,716 | 12,550 |
| Other | 0 | 0 | 43 | 16,886 | 16,929 |
| Total Canada | 543,634 | 33,168 | 21,070 | 117,235 | 715,107 |
Source: Statistics Canada, 2006, Aquaculture Statistics 2005, Catalogue no. 23-222-XIE.
*Totals exclude confidential data.
- Date modified: