
Commercial fisheries and aquaculture Footnote 1
3.1 Commercial marine fisheries
The commercial fishing industry underwent a period of transformation after the decline of Atlantic cod stocks in 1992. In the early 1990's, groundfish played a major role in the fish harvesting and processing sectors, but over time the dominance of groundfish decreased. In 2006, groundfish as a whole represented less than 17% of the total landed value of marine commercial fishing in Canada.
Crustaceans have replaced groundfish as the main species harvested in Atlantic Canada and due to their relatively high value, Canada's total landed value has increased despite declining overall landings. In 2006, crustaceans represented close to 61% of the total landed value in Canada. However, in terms of volume landed, crustaceans only represented 31% of the total volume of landings in 2006
Figure 3.1: Total landed value, main commercial marine species, Canada, 2004-2006

Source: DFO, Economic Analysis and Statistics.
The most significant crustaceans harvested in Canada are shrimp, snow crab and lobster. Together, these species represented about 64% of the total landed value for marine species in Canada between 2004 and 2006.
In 2006, the landed value of snow crab saw a sharp decrease of 65% from 2004, down to a total of $215 million. This represents a loss of $398 million compared to the record value of $613 million reached in 2004. The primary factor of this decline was decreasing snow crab prices that began at the end of the 2004 fishing season, a result of a substitution effect in the American market in response to the peak prices of the 2004 season. This price decrease has been significant, as in 2004 the average price of snow crab was $5.93/kg, while in 2006 it decreased by 59% to $2.40/kg.
In 2006, lobster harvests continued to outperform snow crab despite the decrease in the average landed price for lobster by 12% to $11.88/kg that year. The total volume of lobster landings increased slightly (+5%) and the total value of this species amounted to nearly $647 million in 2006, about $51 million less than in 2005.
The landed volume of scallop rebounded in 2006 by 11% to reach over 63,000 tonnes. In 2004, the total Canadian landings of scallop reached 82,000 tonnes before decreasing by almost 30% to 57,000 tonnes in 2005. As scallop prices have remained relatively unchanged between 2004 and 2006, the total landed value of scallops has increased to $88 million in 2006, a gain of $5 million compared to 2005.
Between 2005 and 2006, other commercial marine species in Canada have seen major increases in landed value. This includes sablefish (+$32 million), sockeye salmon (+$28 million), sea scallop (+$9 million) as well as Stimpson surf clams (+$7 million). In 2006, noticeable reductions in landed value took place in some fisheries such as northern shrimp (-$24 million), Pacific herring (-$14 million) and yellowtail flounder (-$10 million).
Details of the landed volume, value and price evolution for the main marine species landed in Canada between 2004 and 2006 are presented in Appendix II, Tables 6.1 to 6.3. An overview of the main fishing fleets in Canada is also presented in Appendix I,Tables 5.1 to 5.6.
3.1.1 Provinces
Marine commercial fishing is concentrated in six of the ten Canadian provinces and three territories. Nova Scotia, Newfoundland and Labrador and British Columbia are the three provinces where fishing has the greatest value, followed by New Brunswick, Prince Edward Island and Quebec. British Columbia and New Brunswick also enjoy a major aquaculture production.
In 2006, 26% (284,000 tonnes) of the total volume of commericial marine fisheries in Canada was landed in Nova Scotia, for a total of $661 million, or 34% of the total Canadian landed value. The key species were lobster (57%), scallops (12%), cod, hake and haddock (8%) as well as shrimp (7%). This level is similar to that of 2005, when total landings in Nova Scotia were 291,000 tonnes for a value of $742 million or 35% of the total landed value in Canada.
Figure 3.2: Total landed value, commercial marine fisheries, by province, Canada, 2004-2006
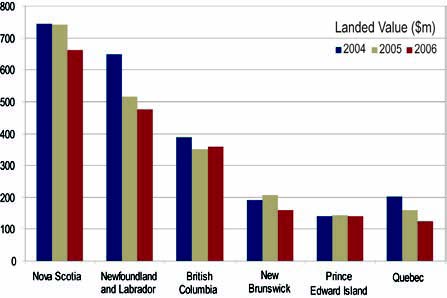
Source: DFO, Economic Analysis and Statistics.
The total landed volume in Newfoundland and Labrador has remained fairly consistent with that of the previous year. The total landed volume in this province reached 374,000 tonnes in 2006, increasing 5% from 2005. However, given the decline in the price of snow crab, the total value has fallen to $474 million, which represents an 8% decrease compared to 2005. Newfoundland and Labrador's share of the total landings in Canada have remained constant with a slight drop of 1% over the previous year, from 25% of the total landed value in Canada in 2005 to 24% in 2006. Key species in 2006 were shrimp (34%) and crab (21%).
British Columbia ranked third in terms of landings, as it contributed 19% of the total fishing value in Canada in 2006, for a total of $360 million. The total landed volume in British Columbia decreased by 13% to 219,000 tonnes. The key species harvested were salmon, trout and smelt (17%), flounder, halibut and sole (15%), and shrimp and prawn at (11%).
New Brunswick and Prince Edward Island are in fourth and fifth places respectively. In 2006, the landed value in New Brunswick was $160 million, with Prince Edward Island at $141 million. Landings in these two provinces represent 16% of the total landed value in Canada. However, New Brunswick has suffered a sharp decrease of 23% in the value of its landings between 2005 and 2006, largely due to a 40% decline in the average price of snow crab. Landed values remained steady in Prince Edward Island, decreasing slightly by 2%.
Quebec is in sixth place with respect to the value of commercial fishing in Canada. In 2006, 7% or $126 million of the total value of catches in Canadian waters was landed in Quebec.
3.1.2 NAFO areas, Atlantic Canada
Between 2004 and 2006, the southern part of the Gulf of St. Lawrence was the most lucrative NAFO fishing area in terms of landed value in Canada. The presence of large stocks of lobster and snow crab partly explains the high value of fishing in this area. The northeastern part of Newfoundland and the southern Scotian shelf have also been highly productive areas during this period, contributing over half of the total landed value of marine species on the Canadian Atlantic coast. In 2006, these three areas combined represented 64% of the total landed volume and 70% of the total landed value in Atlantic Canada.
| Groups | NAFO Areas | Landed Value ($m) | |||
|---|---|---|---|---|---|
| 2004 | 2005 | 2006 | % of Total (2006) | ||
| Southern Gulf of St. Lawrence | 4T, 4VN | 547 | 513 | 416 | 27% |
| Southern Scotian Shelf | 4X, 5Y, 6D, 6E | 440 | 469 | 411 | 26% |
| North-Eastern Newfoundland | 2J, 3K, 3L | 408 | 314 | 273 | 17% |
| Northern Scotian Shelf | 4W, 4VS | 123 | 106 | 109 | 7% |
| Northern Gulf of St. Lawrence | 4R, 4S, 3PN | 109 | 100 | 97 | 6% |
| Northern Labrador and Baffin Island | 2G, 2H, 0A, 0B, 1B | 96 | 92 | 90 | 6% |
| Southern Newfoundland | 3PS, 3MNO | 130 | 107 | 84 | 5% |
| Georges Bank | 5Ze | 62 | 59 | 73 | 5% |
| Other | - | 13 | 10 | 10 | 1% |
| Total | 1,928 | 1,769 | 1,563 | 100% | |
Source: DFO, Economic Analysis and Statistics.
3.1.3 Months of activity in Atlantic Canada
On the Atlantic coast of Canada, most fish landings took place between May and October, representing 78% of all landings in 2006. However, it is in May and June that landings had the greatest value principally due to lobster, shrimp and scallop catches. In 2006, landings during these two months had a value of approximately $598 million, which is almost 40% of the total landed value of that year on the Canadian Atlantic coast. In general, the volume of fish landed between October and March is relatively lower in New Brunswick, Prince Edward Island and Quebec. In Newfoundland and Labrador, fish landings are spread over the whole year, with a higher value during the months of April to July. The volume of landings are consistent throughout the year in Nova Scotia, while landed value is higher between the months of May and July and in December.
| Months | Landed Value ($m) | |||||
|---|---|---|---|---|---|---|
| NS | NB | PEI | Que | NFL | Total | |
| January | 43 | 3 | 0 | 5 | 15 | 65 |
| February | 25 | 2 | 0 | 0 | 19 | 46 |
| March | 29 | 2 | 0 | 0 | 19 | 50 |
| April | 43 | 12 | 4 | 17 | 73 | 148 |
| May | 121 | 54 | 72 | 45 | 86 | 379 |
| June | 64 | 27 | 35 | 26 | 66 | 219 |
| July | 52 | 5 | 2 | 13 | 64 | 137 |
| August | 44 | 17 | 12 | 7 | 42 | 123 |
| September | 37 | 13 | 10 | 6 | 29 | 95 |
| October | 34 | 5 | 4 | 3 | 25 | 70 |
| November | 52 | 13 | 1 | 1 | 21 | 88 |
| December | 117 | 6 | 0 | 0 | 15 | 139 |
| Total | 661 | 160 | 141 | 123 | 474 | 1,559 |
Source: DFO, Economic Analysis and Statistics.
3.1.4 Fishing gear
In 2006, nearly 49% of the marine fishing value in Canada came from species that were caught using pots and traps, such as crab and lobster. In terms of value, trawling contributed to 19% of total catches in Canada, but 25% in terms of volume, since the market price of trawled species, such as groundfish and shrimp, are typically less than that of species caught using a trap.
Figure 3.3: Total landed value by fishing gear type, commercial marine fisheries, Canada, 2006
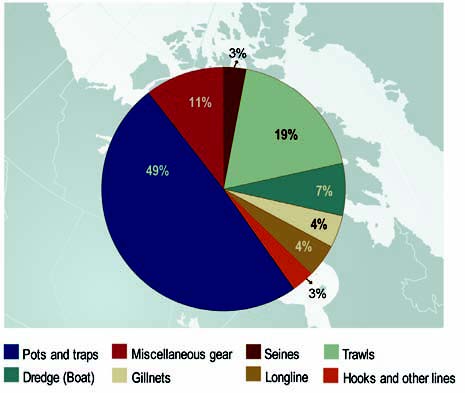
Source: DFO, Economic Analysis and Statistics.
3.1.5 Vessels
In 2006, there were 16,550 "active" vessels in Canada. A fishing vessel is considered active if at least one instance of fish landings is recorded during the year. This number has decreased slightly compared to 2005, when the number of active vessels amounted to 16,722 (-1%).
The majority (91%) of these vessels are inshore fishing vessels less than 45' in length. While midshore and offshore fishing vessels (more than 45' in length) represented less than 10% of all active fishing vessels in Canada, they registered more than 43% of the total Canadian landed value in 2006.
| Vessel length | Number of active vessels1 | |||
|---|---|---|---|---|
| 2004 | 2005 | 2006 | % of total
2006 |
|
| Unknown length | 11 | 139 | 205 | 1% |
| 1' - 34'11'' | 7,984 | 8,025 | 8,055 | 49% |
| 35' - 44'11'' | 7,125 | 6,996 | 6,871 | 42% |
| 45' - 64'11'' | 1,437 | 1,417 | 1,256 | 8% |
| 65' - 99'11'' | 260 | 242 | 228 | 1% |
| 100' + | 87 | 81 | 72 | 0% |
| Total2 | 16,754 | 16,722 | 16,550 | 100% |
1Vessel that reported landings in a given year.
2Due to some vessel length changes, total may not round up.
Source: DFO, Economic Analysis and Statistics.
Figure 3.4: Total landed value by vessel length, commercial marine fisheries, Canada, 2006
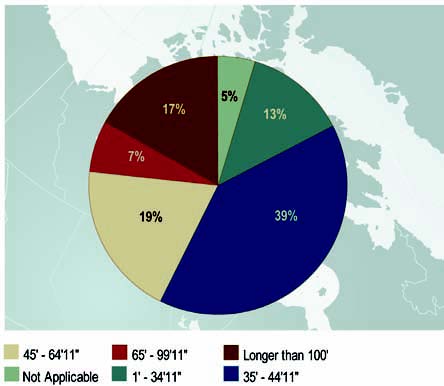
Source: DFO, Economic Analysis and Statistics.
The average landed value per active fishing vessel was $112,068 in Canada in 2006, which is a 8% increase over the average landed value in 2005. Among the main commercial species, landings of northern shrimp (Pandalus Borealis) and Pacific Halibut had the highest value in 2006, reaching on average $473,000 and $178,000 respectively per vessel. The average landed value of lobster ($75,361) and Atlantic cod ($7,615) per vessel was significantly lower, while these two fleets combined represent about 80% of all vessels (13,000 vessels).
| Major species | Number of vessels and average landed value per vessel in 2006 | ||
|---|---|---|---|
| # of active vessels1 | # of active vessels as a % of total vessels | Average landed value per vessel ($) | |
| Snow crab | 3,017 | 18% | 71,380 |
| Lobster | 8,584 | 52% | 75,361 |
| Shrimp, p. Borealis | 483 | 3% | 473,443 |
| Scallops, Sea | 636 | 4% | 133,399 |
| Dungeness crab | 215 | 1% | 99,083 |
| Pacific halibut | 252 | 2% | 178,136 |
| Greenland halibut | 898 | 5% | 40,588 |
| Herring | 1,569 | 9% | 25,291 |
| Cod, Atlantic | 4,879 | 29% | 7,615 |
| Total | 16,550 | 100% | 112,068 |
1Vessels may land more than one species (categories not mutually exclusive)
Source: DFO, Economic Analysis and Statistics.
In 2006, 39% of the total active fishing vessels in Canada landed fish in Newfoundland and Labrador (6,404 vessels). Nova Scotia was second with 3,800 vessels, about 23% of the Canadian total. Since 2005, the number of active vessels in Nova Scotia, New Brunswick and Prince Edward Island has decreased, while it increased in the three other fishing provinces.
| Province | Number of active vessels1 | |||
|---|---|---|---|---|
| 2004 | 2005 | 2006 | % of total
2006 |
|
| Nova Scotia | 3,929 | 3,982 | 3,800 | 23% |
| New Brunswick | 1,952 | 1,934 | 1,898 | 11% |
| Prince Edward Island | 1,413 | 1,418 | 1,386 | 8% |
| Quebec | 1,232 | 1,252 | 1,259 | 8% |
| Newfoundland | 6,149 | 6,380 | 6,404 | 39% |
| British Columbia2 | 2,627 | 2,339 | 2,350 | 14% |
| Total3 | 16,754 | 16,722 | 16,550 | 100% |
1Vessel that reported landings, by province, in a given year.
2This report also includes offshore tuna and joint venture landings which adds 220, 166 and 124 vessels in 2004, 2005 and 2006 respectively.
3Due to some vessels landing in more than one province, total may not round up.
Source: DFO, Economic Analysis and Statistics.
3.2 Commercial freshwater fisheries
In Canada, freshwater commercial fishing primarily takes place in Lakes Winnipeg, Cedar, Manitoba and Winnipegosis in the province of Manitoba as well as in the Northwest Territories Great Slave Lake. This fishing activity is relatively modest when compared to the commercial fishing of marine species. In 2006, it amounted to 4% of the commercial fishing value and 3% of total volume in Canada.
The landed volume of freshwater species has remained steady when compared to 2005, increasing by 194 tonnes for a total of 32,029 tonnes in 2006. The increased price of some species has resulted in a total landed value of $68 million, $1.8 million (+3%) more than in 2005.
The main freshwater species fished commercially in Canada are pickerel, perch and whitefish. Landings of these three species represented close to 88% of total landings of freshwater species in Canada in 2006.
| Species | Value of landings ($,000) | |||
|---|---|---|---|---|
| 2004 | 2005 | 2006 | % change
2005-2006 |
|
| Pickerel | 26,130 | 31,521 | 32,534 | 3% |
| Perch | 13,429 | 14,973 | 18,308 | 22% |
| Whitefish | 10,790 | 8,786 | 9,145 | 4% |
| White bass | 2,562 | 2,316 | 1,687 | -27% |
| Smelt | 3,121 | 1,657 | 467 | -72% |
| Sauger | 1,866 | 1,018 | 491 | -52% |
| Pike | 1,203 | 855 | 965 | 13% |
| Sucker (mullet) | 756 | 793 | 764 | -4% |
| Lake trout | 586 | 486 | 447 | -8% |
| Other | 3,355 | 3,735 | 3,167 | -15% |
| Total | 63,799 | 66,140 | 67,977 | 3% |
Source: DFO, Central and Arctic, Policy Sector.
Freshwater commercial fishing is the most important in Ontario and Manitoba, with respective landed values of $36 million and $24 million in 2006. Fish landings in these two provinces represented 89% of the overall landed value of freshwater commercial species in Canada.
| Provinces | Value of landings ($,000) | |||
|---|---|---|---|---|
| 2004 | 2005 | 2006 | % change
2005-2006 |
|
| Ontario | 29,513 | 35,133 | 36,430 | 4% |
| Manitoba | 24,655 | 22,683 | 23,818 | 5% |
| Saskatchewan | 2,985 | 2,830 | 2,843 | 0% |
| Quebec | 2,977 | 2,217 | 2,030 | -8% |
| Alberta | 2,249 | 2,032 | 1,748 | -14% |
| Northwest Territories | 1,009 | 817 | 610 | -25% |
| New Brunswick | 411 | 429 | 498 | 16% |
| Total | 63,799 | 66,140 | 67,977 | 3% |
Source: DFO, Central and Arctic, Policy Sector.
3.3 Aquaculture
Overall aquaculture production has reached a total value of $913 million in Canada in 2006, close to $198 million more than in 2005 (+28%). This high value can be attributed to a marked increase in the price of salmon, which rose from $5.53/kg in 2004 to $6.33/kg in 2006.
The aquaculture production value of mussels and oysters increased by 7% and 15% respectively, while trout production decreased by 8%. Meanwhile, the value of salmon production has increased by nearly 38% in 2006, due to a higher production volume and higher price. In 2006, the production value of salmon exceeded 81% of the total aquaculture production value in Canada.
| Major species | Value of aquaculture production ($,000) | |||
|---|---|---|---|---|
| 2004 | 2005 | 2006 | % change
2005-2006 |
|
| Salmon | 400,180 | 543,343 | 748,246 | 38% |
| Mussels | 32,807 | 33,582 | 35,817 | 7% |
| Trout | 22,086 | 21,363 | 19,743 | -8% |
| Oysters | 16,740 | 16,521 | 19,042 | 15% |
| Clams | 7,371 | 8,463 | 8,904 | 5% |
| Other | 62,166 | 92,048 | 81,167 | -12% |
| Total1,2 | 541,350 | 715,320 | 912,919 | 28% |
1Totals include re-stocking.
2Totals exclude confidential data.
Source: Statistics Canada, 2008, Aquaculture Statistics 2007, Catalogue no. 23-222-XIE.
British Columbia continues to dominate Canadian aquaculture production, accounting for almost half of Canada's total. In 2006, Newfoundland and Labrador reported the second highest production, primarily from finfish. Specific data for New Brunswick and Nova Scotia, which ranked second and third respectively in 2005, were unavailable for 2006.
| Provinces | Value of aquaculture production in 2006 ($,000) | ||||
|---|---|---|---|---|---|
| Salmon | Mussels | Trout | Other | Total | |
| British Columbia | 407,405 | 1,128 | 1,043 | 17,890 | 427,466 |
| New Brunswick | x | x | x | x | x |
| Prince Edward Island | x | 22,800 | x | 9,100 | 31,900 |
| Newfoundland and Labrador | x | 7,772 | 0 | 44,517 | 52,289 |
| Nova Scotia | x | x | 0 | x | x |
| Ontario | 0 | 0 | 15,700 | 0 | 15,700 |
| Quebec1 | 0 | 430 | .. | 11,335 | 11,765 |
| Other | 340,841 | 3,687 | 3,000 | 26,271 | 373,799 |
| Total Canada2 | 748,246 | 35,817 | 19,743 | 109,113 | 912,919 |
1Quebec totals include restocking.
2Totals exclude confidential data.
Source: Statistics Canada, 2008, Aquaculture Statistics 2007, Catalogue no. 23-222-XIE.
- Date modified: