
Introduction to stock assessment
Unit 2.4: Model-based stock assessments
Video transcript
[Background music begins]
[Visual: The words, “Model-Based Stock Assessment” appear.]
Narrator: Model-Based Stock Assessment.
[Visual: A blue box appears on the left of the screen with the words, “CURRENT BALANCE” inside. An icon showing a small stack of coins appears beneath the box.]
Narrator: A fish stock can be compared to a bank account. In banking, your current balance increases as you accumulate interest.
[Visual: A green box appears on the left of the screen (next to the first box) with the word, “INTEREST” inside. An icon showing a piggy-bank appears beneath the box.]
[Visual: A red box appears in the middle of the screen with the word, “WITHDRAWALS” inside. An icon showing a hand holding money appears beneath the box.]
Narrator: Your balance decreases when you make withdrawals and are charged with banking fees.
[Visual: Another red box appears on the right of the third box with the words, “BANKING FEES” inside. An icon showing an empty hand appears beneath the box.]
Narrator: Together, these factors influence your future bank account balance.
[Visual: A purple box appears on the far right of the screen with the words, “FUTURE BALANCE” inside. An icon showing a large stack of coins appears beneath the box.]
Narrator: Now consider a scenario where biomass (the total weight of all fish in a stock) is being used to assess a fish stock.
[Visual: The text in the first blue box is replaced with the words, “CURRENT BIOMASS”. The icon beneath the box is replace with three fish of the same size.]
Narrator: The current biomass of the fish stock is similar to the current balance of the bank account.
[Visual: The text in the green box is replaced with the word, “GROWTH”. The icon beneath the box is replace with five fish of different sizes.]
Narrator: Reproduction and growth of fish in the stock are like accumulating interest.
Narrator: Fishing and natural mortality reduce the biomass of the stock like how withdrawals and banking fees reduce your bank account balance.
[Visual: The text in both of the red boxes is replaced with the words, “FISHING” and “NATURAL MORTALITY'. The icons beneath the boxes are replace with a fish hook and a fish skeleton.]
[Visual: The text inside the purple box on the far right of the screen is replaced with the words, “FUTURE STOCK”. The icon beneath the box is replace with five fish of different sizes.]
Narrator: At their most basic level, stock assessment models assume that fish in a stock are born, grow, reproduce, and die. In the same way that we can use math and statistics to calculate our estimated future bank balance, we can use stock assessment models to project how a stock may change over time.
[Visual: Fish icons of different sizes appear across the screen. Some are replaced with fish skeletons, to signify the fish growing and dying.]
Narrator: In reality, there are many additional considerations that influence fish stocks. Modelling allows scientists to combine diverse and complex observations into a clearer understanding of past, present, and future stock status under different harvest and environmental conditions.
[Music ends]
[Visual: Animation fades out to black.]
[Visual: The Fisheries and Oceans Canada logo appears.]
[Visual: The Government of Canada logo appears.]
Integrated stock assessments combine various data types (such as length and age composition of the stock, indicators or indices of current and historical abundance, catch) into a framework of different models that provide specific pieces to a larger puzzle.
The following drop-down boxes explore some of the types of models that may be used in integrated stock assessments to explain how fish are born, grow, reproduce, and die.
Individual growth models
Long description
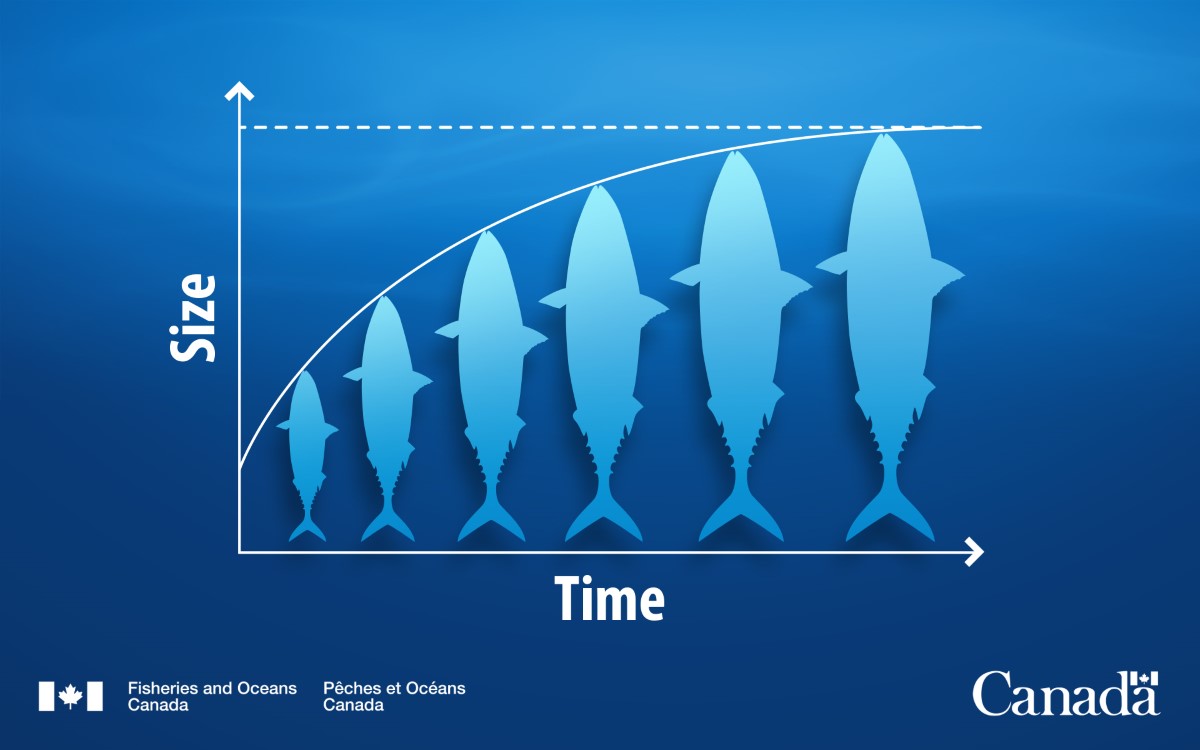
A graph with size on the y-axis and time on the x-axis. Six fish icons are used to show how fish grown over time, starting with smallest on the left to largest on the right. The size of a fish increases rapidly in the beginning, but reaches a plateau in maximum size over time.
Individual growth models assume that growth (either length or weight) increases with age towards a maximum size. The rate at which a fish approaches that maximum size decreases over its lifetime.
Age-based models
Age-based models follow a cohort through time to determine past and present abundance. At each time step, the number of fish removed by fishing is known and natural mortality is estimated or assumed to project abundance in the following year(s).
Statistical catch-at-age models are used to reconstruct historical abundance based on the age of fish caught. From this, mortality rates per cohort can be inferred.
Stock-recruitment models
Long description
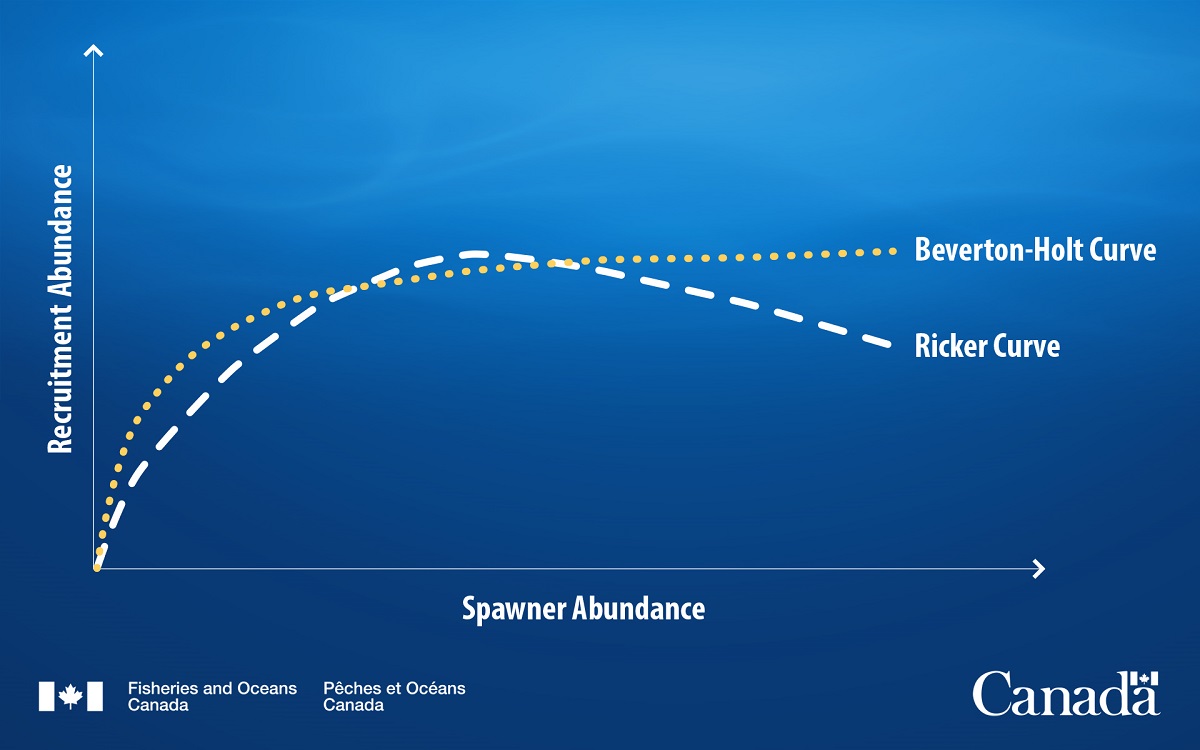
This figure shows the difference between the Beverton-Holt and Ricker stock-recruitment models. The 2 models use slightly different methods of calculating stock-recruitment relationships, so the shapes of their curves differ; however, they both aim to explain the same concept. The Ricker model tends to underestimate the population growth rate and carrying capacity, whereas the Beverton–Holt model tends to overestimated these parameters.
Stock-recruitment models, such as Beverton-Holt and Ricker, explore the relationship between the number of spawners and recruits in a stock. From this, scientists can project the number of future recruits.
Delay-difference models
Delay-difference (stage-based) models introduce a time lag to individual growth models. Recruitment is based on the number of individuals in the stock from a certain number of years ago.
Surplus production models
Surplus production (or biomass dynamics) models assume that:
- stock size is limited by environmental factors and resource availability (for example, food, habitat, mates), also known as carrying capacity (K)
- fish produce more offspring than necessary to replenish the stock
- removing fish promotes productivity by increasing resource availability
- this increased productivity can create a surplus of fish in a stock that can be harvested without affecting the sustainability of the stock over time
Schaefer, Fox, and Pella-Tomlinson are common types of surplus production models.
Long description
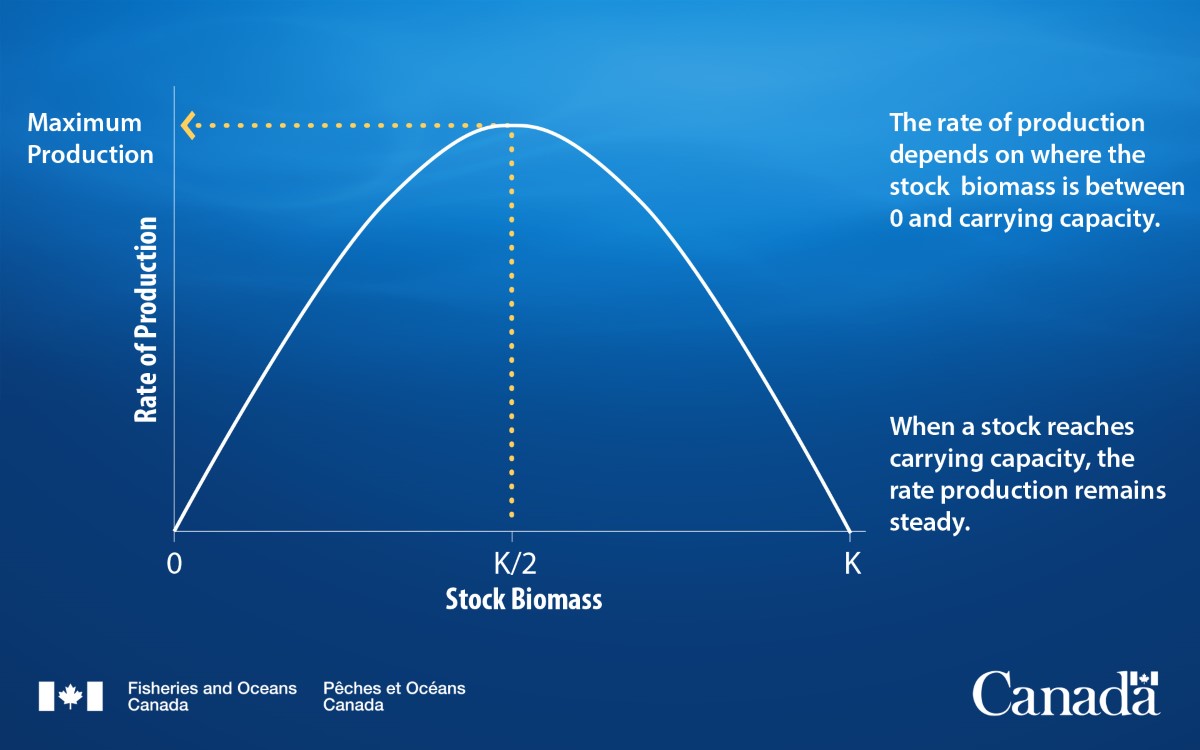
This figure is a simplified version of a surplus production curve. The rate of production is shown by the solid white line. The rate of production is highest when the stock is at half of the carrying capacity of the environment. Beyond K/2, competition for resources increases, so the rate of production decreases. In theory, fishing surplus fish to keep the stock size at K/2 will maintain the greatest rate of production.
- Date modified: